


1 / 2
0
Views
0
Downloads

0.0
0
Save
0 Likes
Interpreting Slopes and Y-Intercepts Worksheet
0 Views
0 Downloads
Paste this activity's link or code into your existing LMS (Google Classroom, Canvas, Teams, Schoology, Moodle, etc.).
Students can open and work on the activity right away, with no student login required.
You'll still be able to track student progress and results from your teacher account.
Information
Description
What It Is:
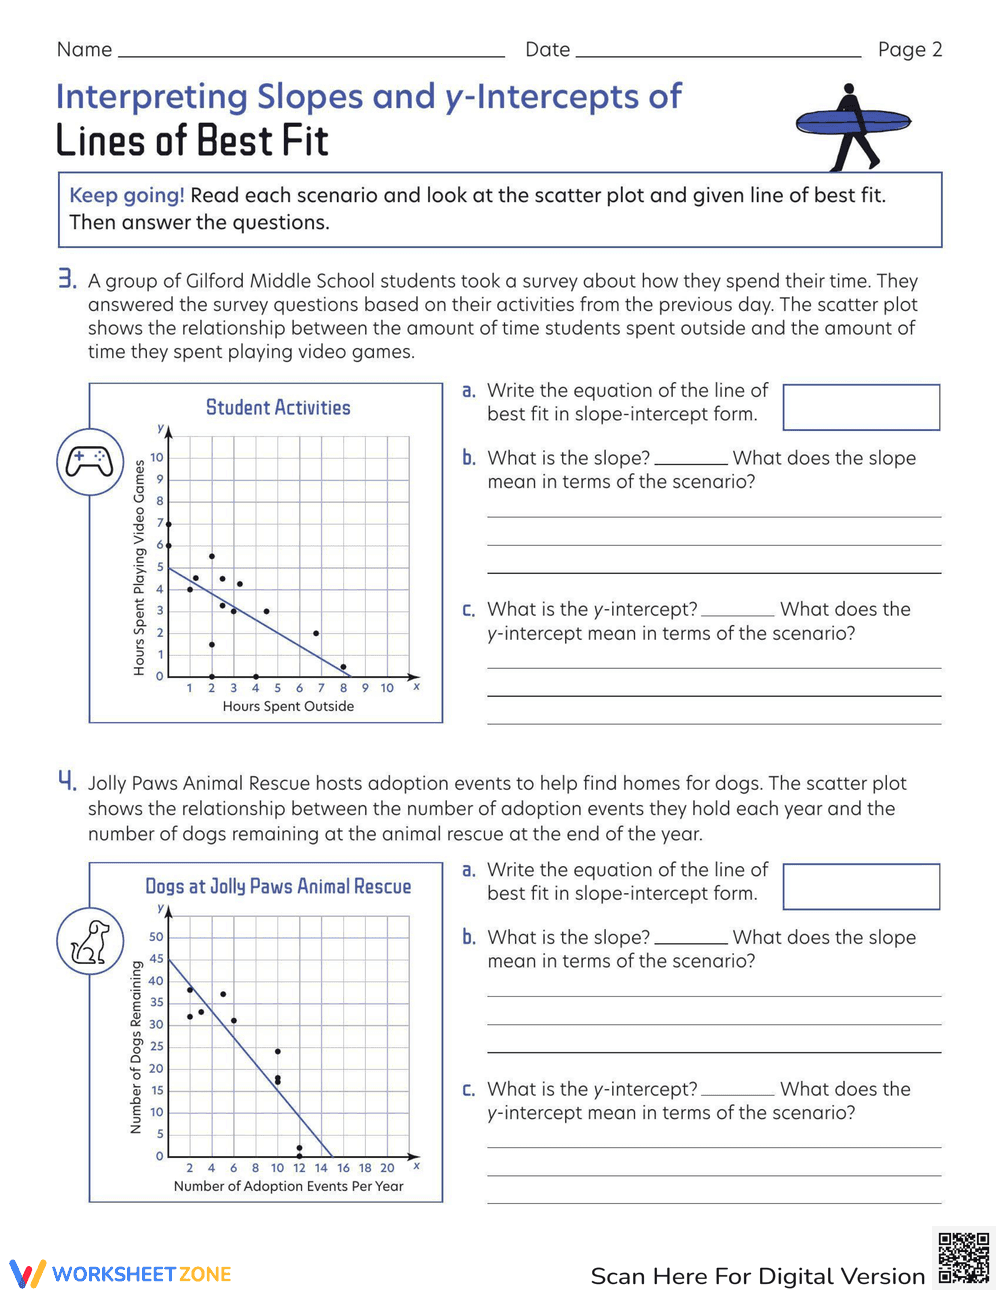
This is an educational worksheet focused on interpreting slopes and y-intercepts of lines of best fit. It presents two real-world scenarios, each accompanied by a scatter plot and a line of best fit. Students are asked to write the equation of the line in slope-intercept form, explain the meaning of the slope in the context of the scenario, and explain the meaning of the y-intercept in the context of the scenario. The first scenario involves a Junior Surf Championship and the relationship between training hours and scores. The second scenario examines the relationship between screen time and the time it takes to fall asleep.
Grade Level Suitability:
This worksheet is suitable for grades 8-10, specifically for students learning about linear equations, scatter plots, and data interpretation. The scenarios provide a real-world context, making the concepts more relatable. The level of analysis required to interpret the slope and y-intercept makes it appropriate for middle and early high school students.
Why Use It:
This worksheet helps students develop skills in interpreting scatter plots and understanding the meaning of slope and y-intercept in real-world contexts. It reinforces the connection between mathematical concepts and practical applications, promoting deeper understanding and critical thinking. It also helps students practice writing linear equations.
How to Use It:
Students should first read the scenario carefully and examine the provided scatter plot and line of best fit. Then, they should determine the slope and y-intercept of the line. Next, they need to write the equation of the line in slope-intercept form. Finally, they should interpret the meaning of the slope and y-intercept within the context of the given scenario, providing a written explanation.
Target Users:
This worksheet is designed for students in middle school or early high school who are learning about linear equations, scatter plots, and data analysis. It is also useful for teachers looking for engaging activities to reinforce these concepts. It is beneficial for students who learn best by applying mathematical concepts to real-world situations.