


Views
Downloads

Printable Interpreting Dot Plots Worksheet | Grade 6 Math
Paste this activity's link or code into your existing LMS (Google Classroom, Canvas, Teams, Schoology, Moodle, etc.).
Students can open and work on the activity right away, with no student login required.
You'll still be able to track student progress and results from your teacher account.
This Interpreting Dot Plots worksheet empowers Grade 6 students to master data visualization and statistical analysis. By engaging with four distinct real-world data sets, learners develop the critical ability to extract meaning from visual displays. This resource ensures students can confidently calculate key statistical measures while understanding the shape of data distributions.
At a Glance
- Grade: 6 · Subject: Math
- Standard:
6.SP.B.5— Summarize numerical data sets in relation to their context by describing patterns- Skill Focus: Statistical data analysis and interpretation
- Format: 4 pages · 20 problems · Answer key included · PDF
- Best For: Middle school data analysis mastery
- Time: 30–45 minutes
What's Inside
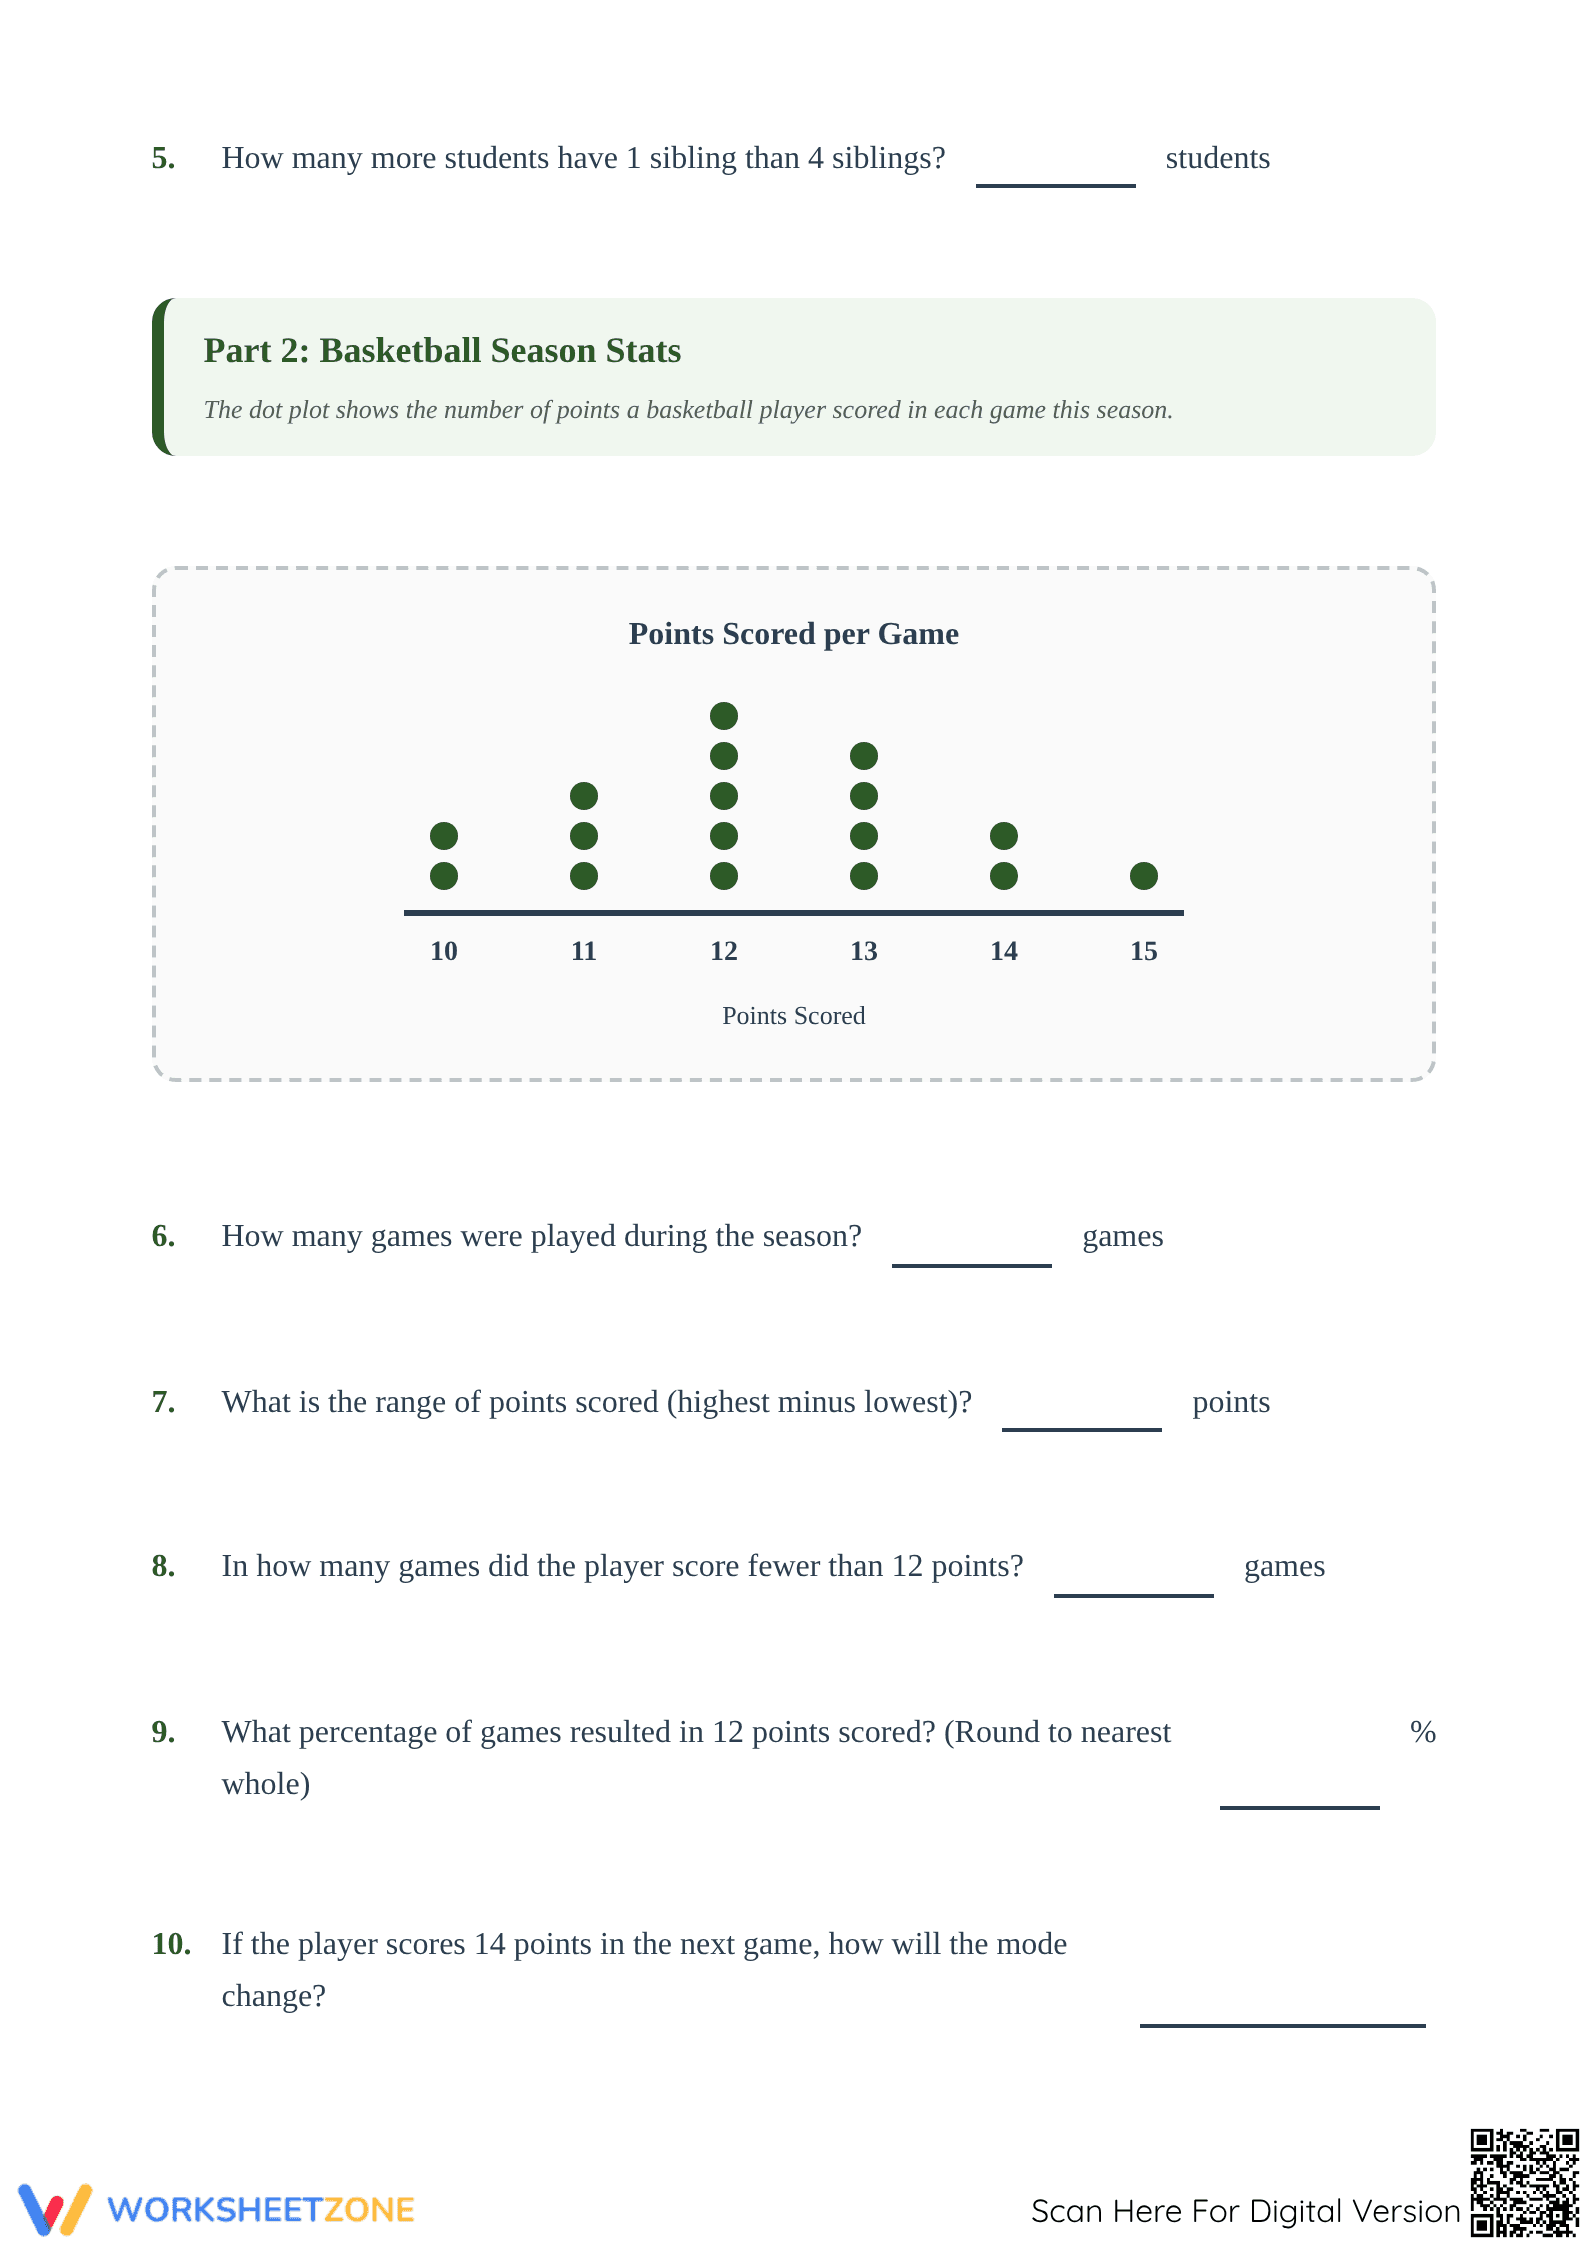
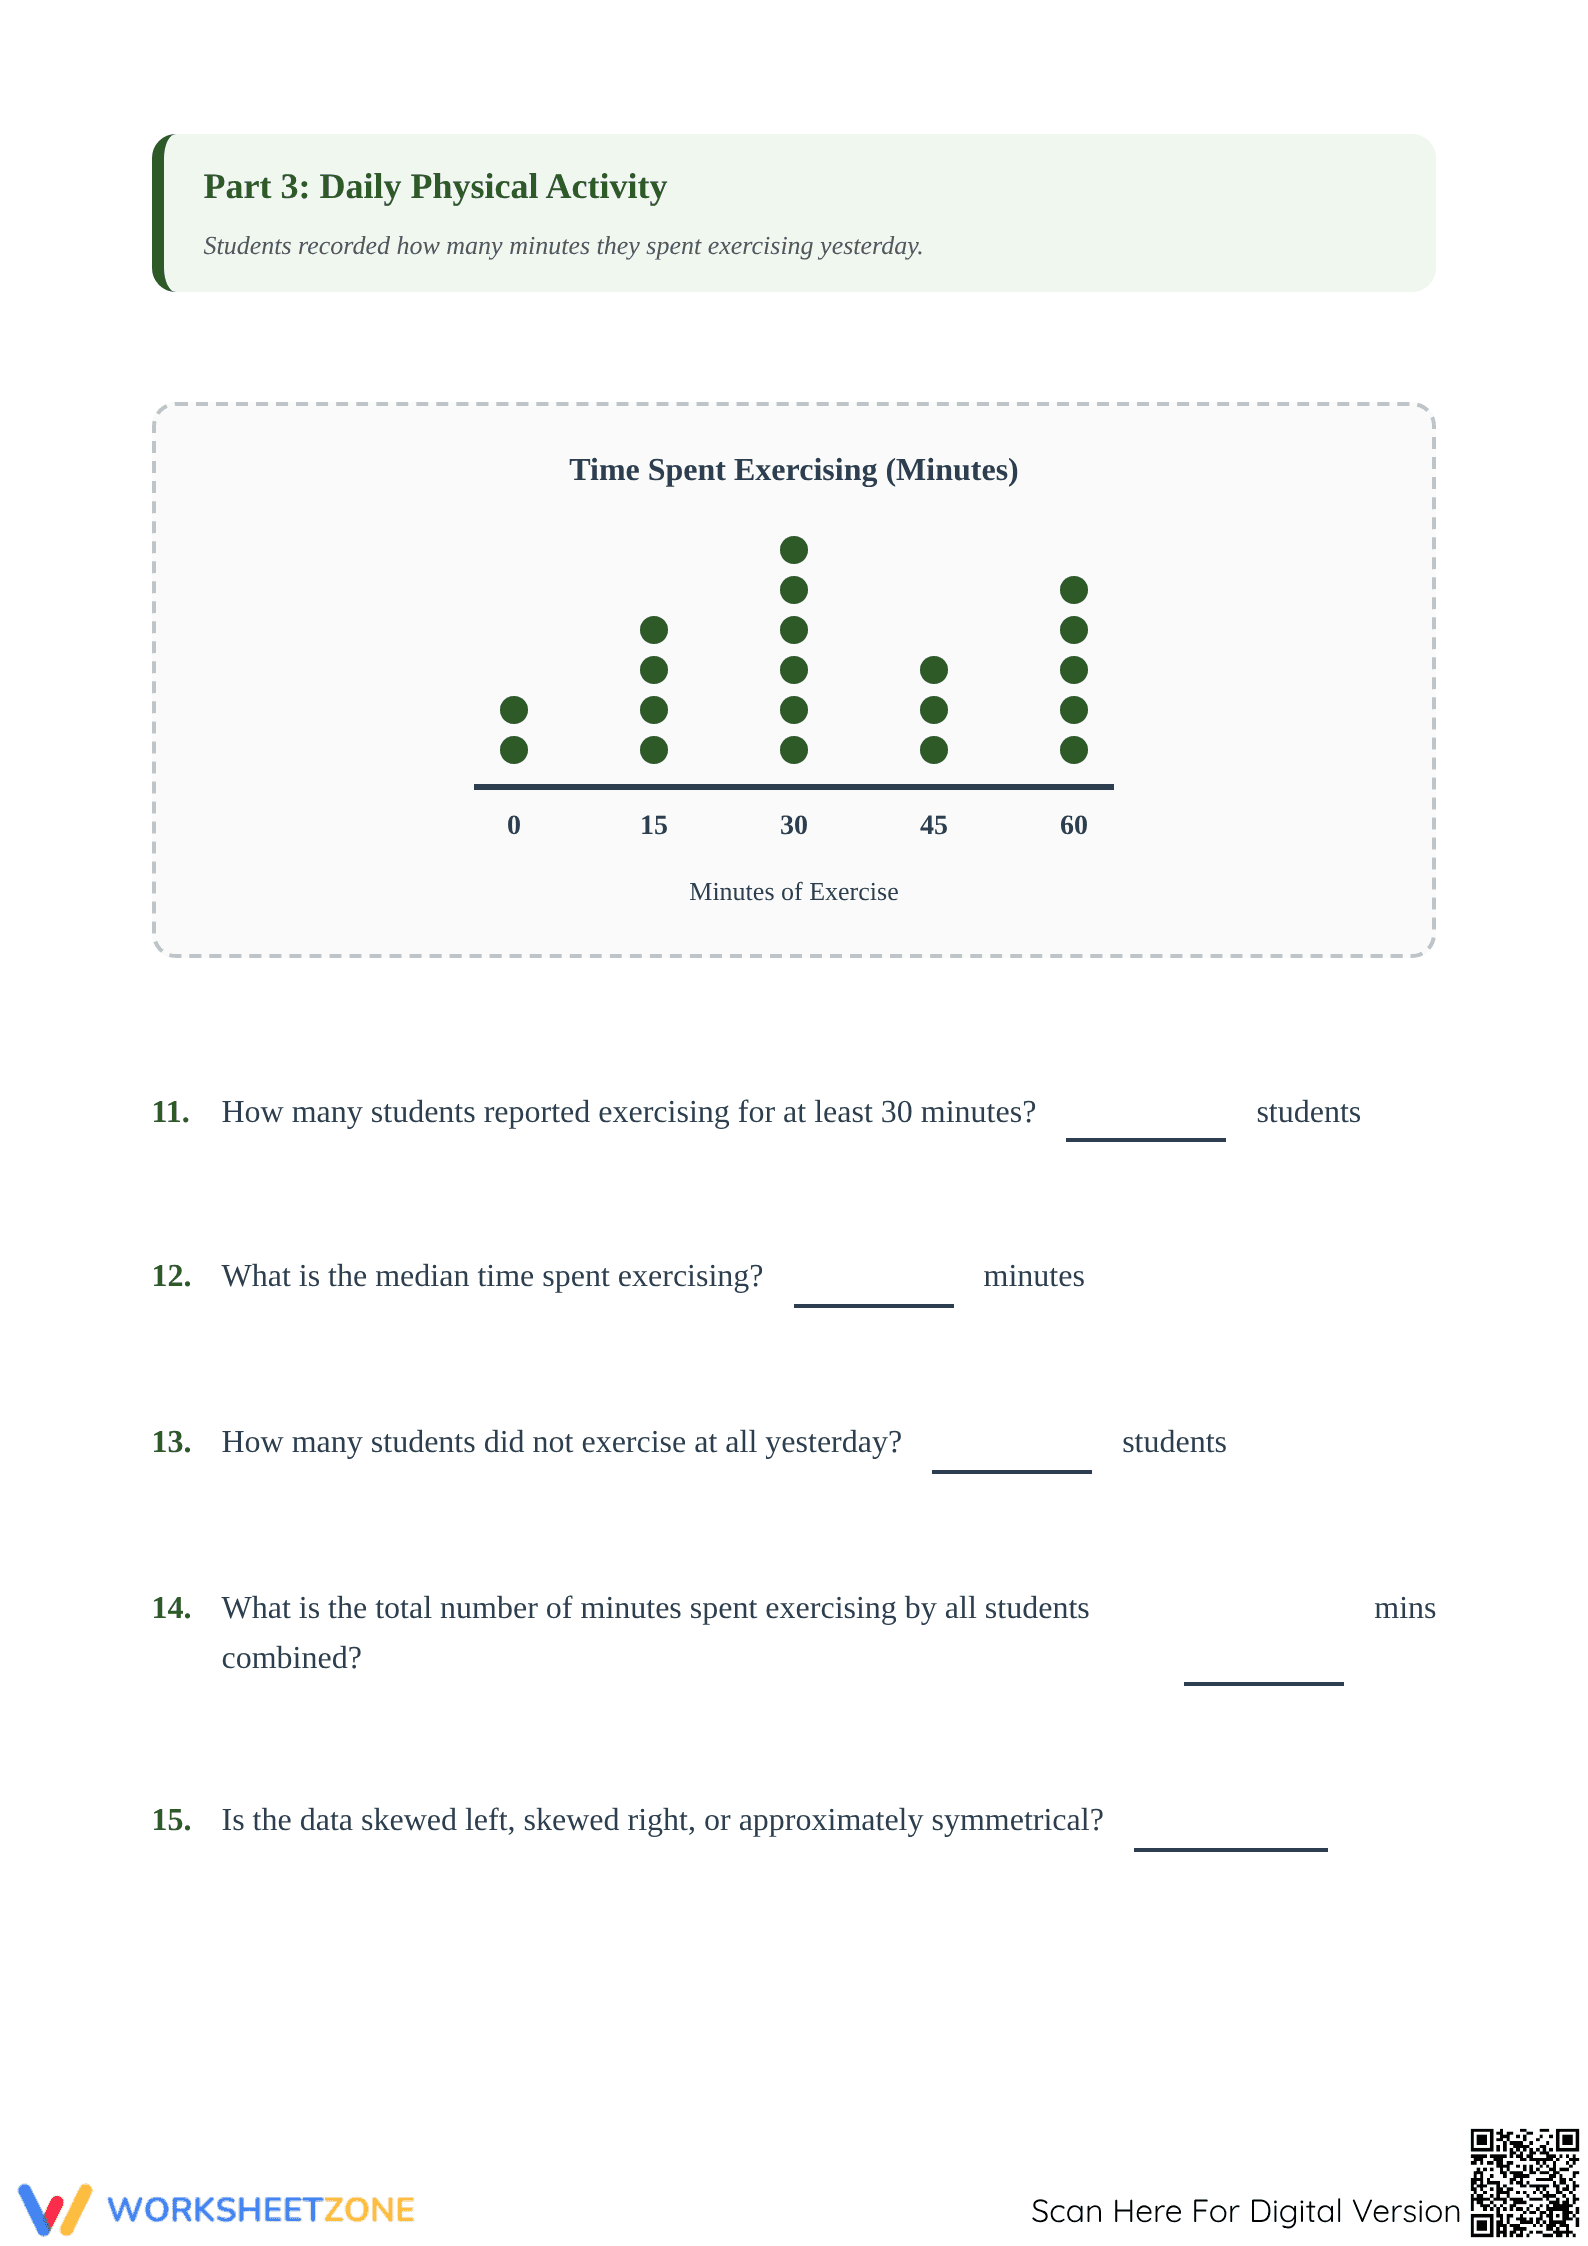
This extensive four-page PDF features 20 structured questions divided into four contextual parts: family surveys, sports stats, physical activity, and weather trends. Each section provides a clear dot plot with five analytical questions. Students will calculate totals, identify the mode and median, determine range, compute percentages, and analyze skewness. A complete answer key is included.
Skill Progression
- Guided Practice: Part 1 uses a family survey context for 5 problems focused on identifying frequencies and total observations.
- Supported Practice: Parts 2 and 3 address range, median, and percentages across 10 problems using sports and exercise data.
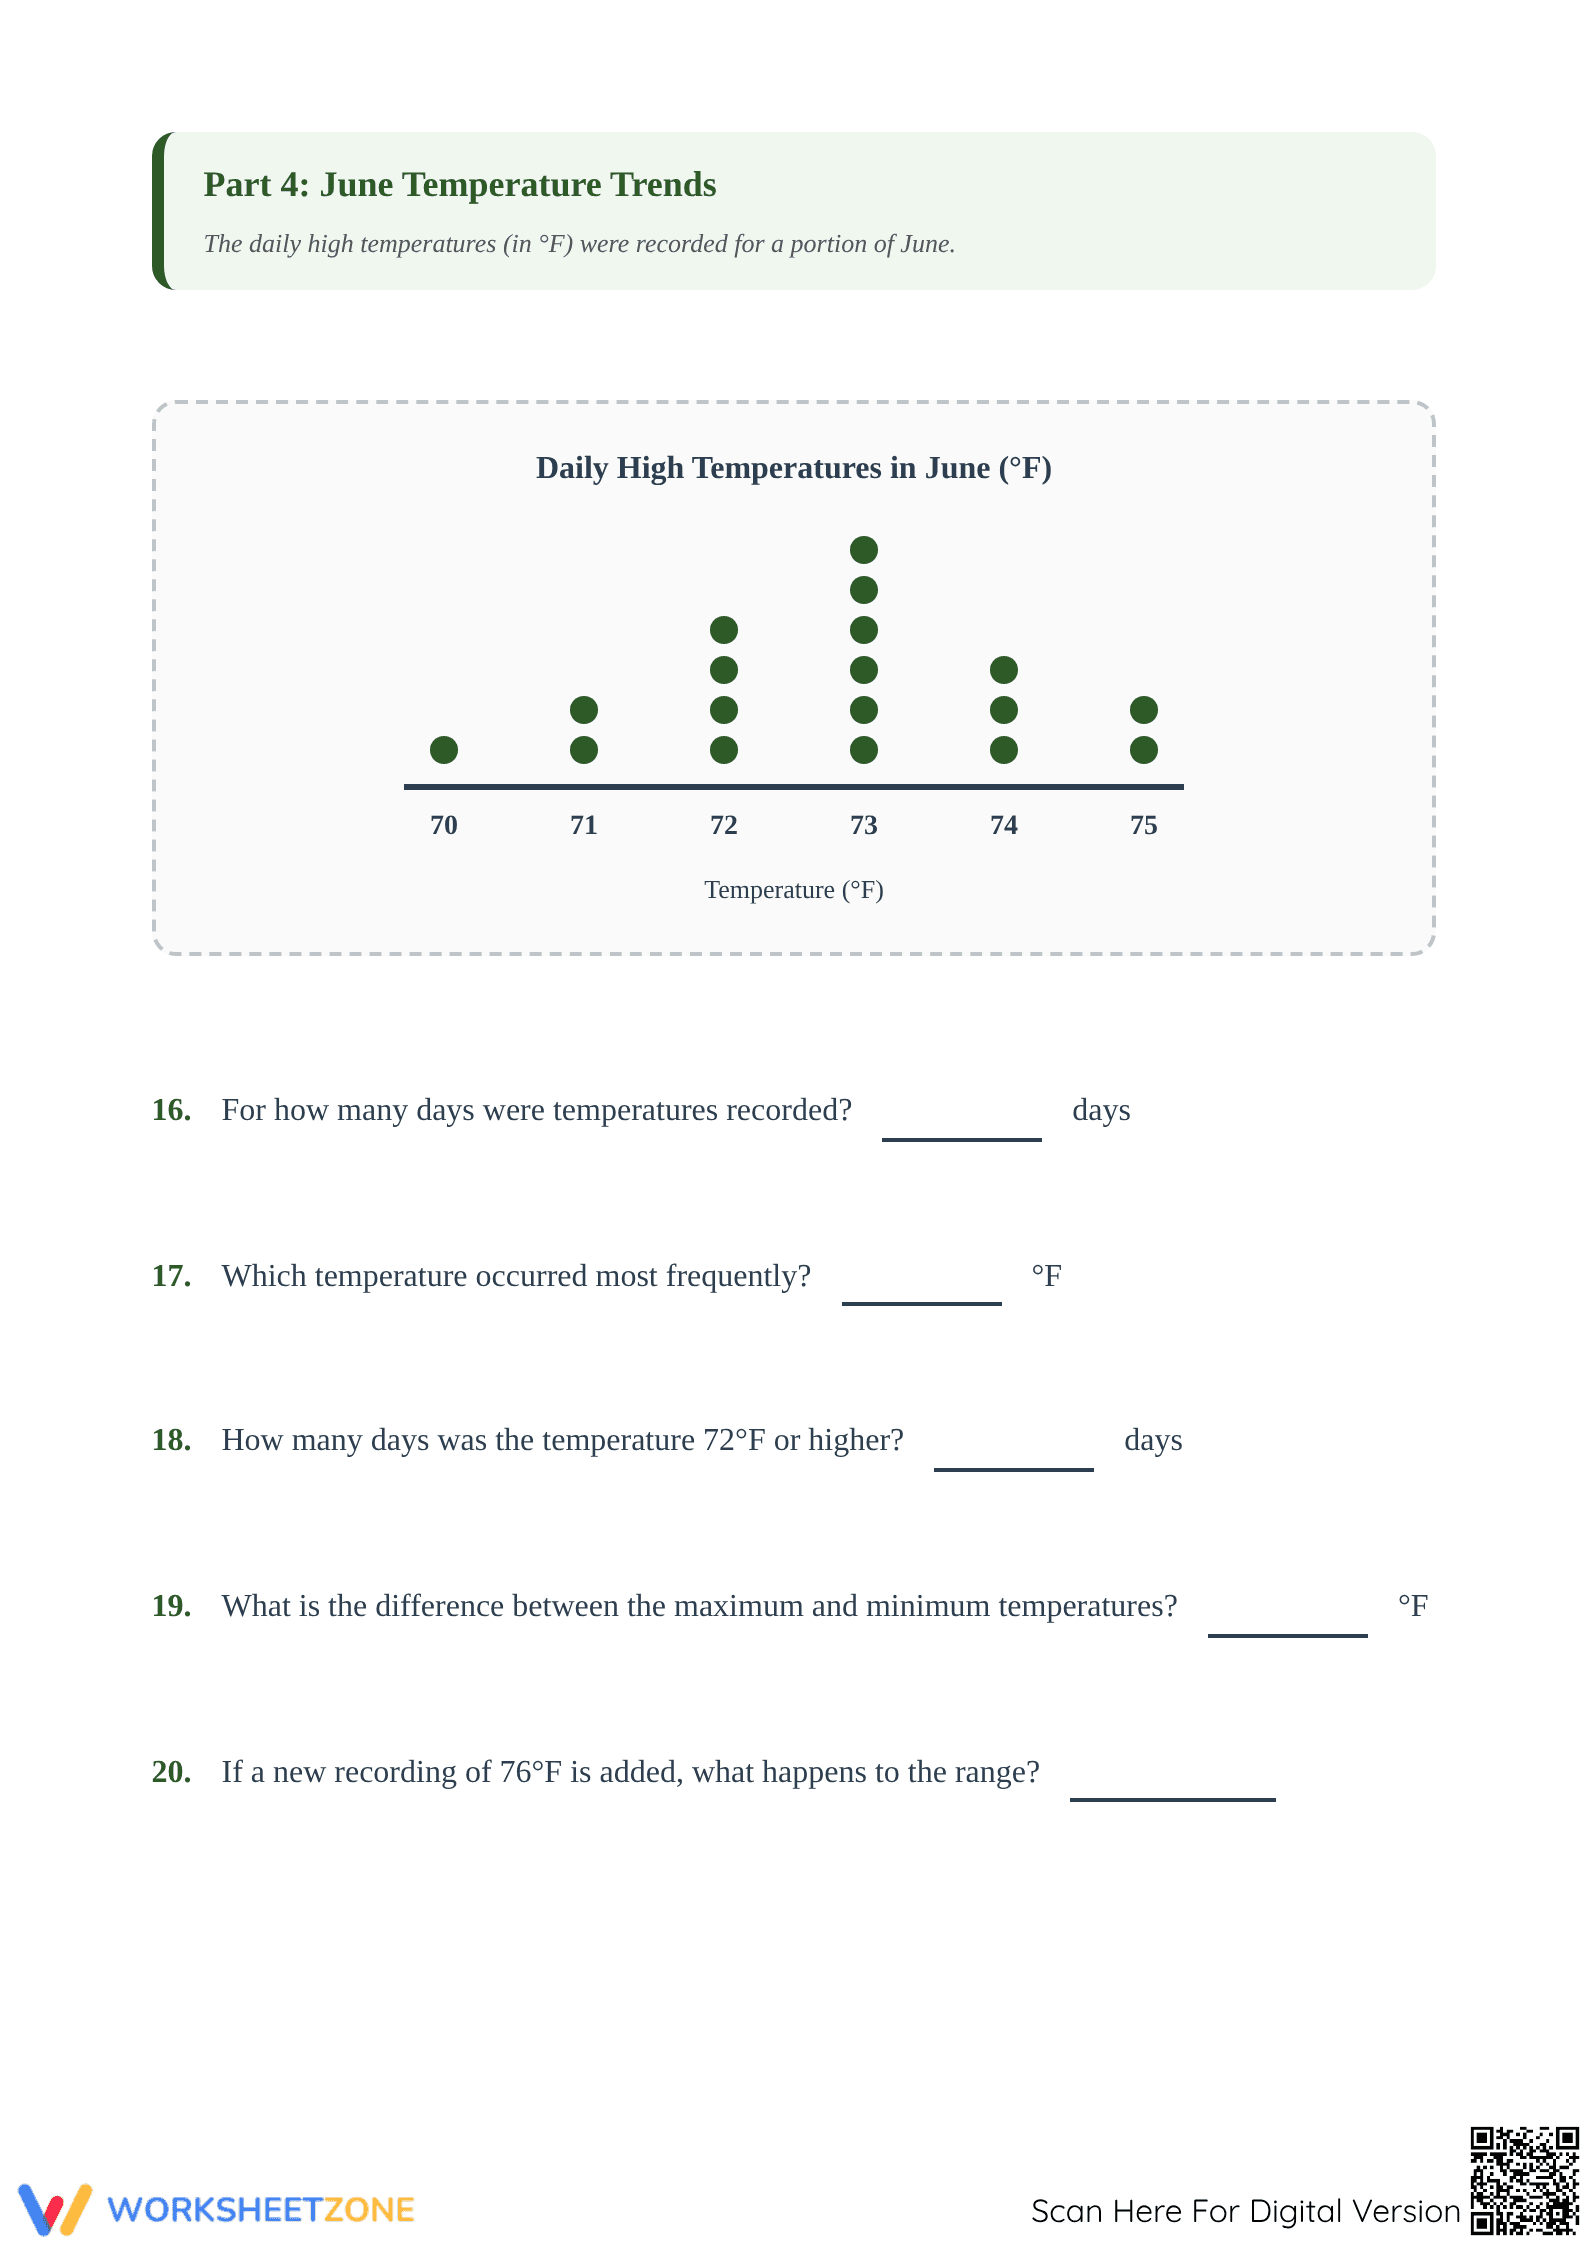
- Independent Practice: Part 4 requires students to analyze distribution shapes and predict how new outliers impact the statistical range.
This scaffolded approach ensures mastery through gradual release.
Standards Alignment
The primary focus is 6.SP.B.5, requiring students to summarize numerical data sets in relation to their context. It specifically addresses identifying the number of observations and describing the attribute under investigation. The worksheet also supports 6.SP.B.4 regarding data display on number lines. Both standard codes can be copied directly into lesson plans or IEP goals.
How to Use It
Use this resource during independent practice after a lesson on statistical distributions. Teachers can use the first page for guided instruction before assigning the remaining pages for individual work. As a formative assessment, check Question 15 to evaluate student understanding of data skewness. Most students will complete all 20 questions within 35 minutes.
Who It's For
This worksheet is designed for Grade 6 students, though its visual layout makes it accessible for Grade 5 enrichment or Grade 7 review. The varied contexts ensure high engagement for diverse populations. It pairs well with instructional videos on calculating the median or anchor charts displaying common data distribution shapes.
Effective instruction in data analysis requires students to connect visual representations with numerical summaries. This interpreting dot plots worksheet provides that essential bridge by requiring learners to translate dots on a number line into statistical facts about mode, median, and range. According to RAND AIRS 2024, students practicing with structured data sets like those found in the 6.SP.B.5 alignment demonstrate significantly higher proficiency in interpreting real-world statistical information compared to those receiving only theoretical instruction. By focusing on this vital skill across four distinct contexts, this comprehensive resource ensures Grade 6 students develop the fluencies required for advanced middle school statistics. The inclusion of skewness analysis and predictive logic further prepares learners for the mathematical complexities of data science. This printable resource serves as a reliable, high-quality tool for classroom teachers and tutors seeking to solidify foundational data literacy and student confidence in statistical analysis. Teachers can effectively integrate this tool into their daily mathematics curriculum to support diverse learning needs.