


0
Views
0
Downloads
Save
0 Likes
Interpreting Dot Plots Worksheet
0 Views
0 Downloads
Paste this activity's link or code into your existing LMS (Google Classroom, Canvas, Teams, Schoology, Moodle, etc.).
Students can open and work on the activity right away, with no student login required.
You'll still be able to track student progress and results from your teacher account.
Information
Description
What It Is:
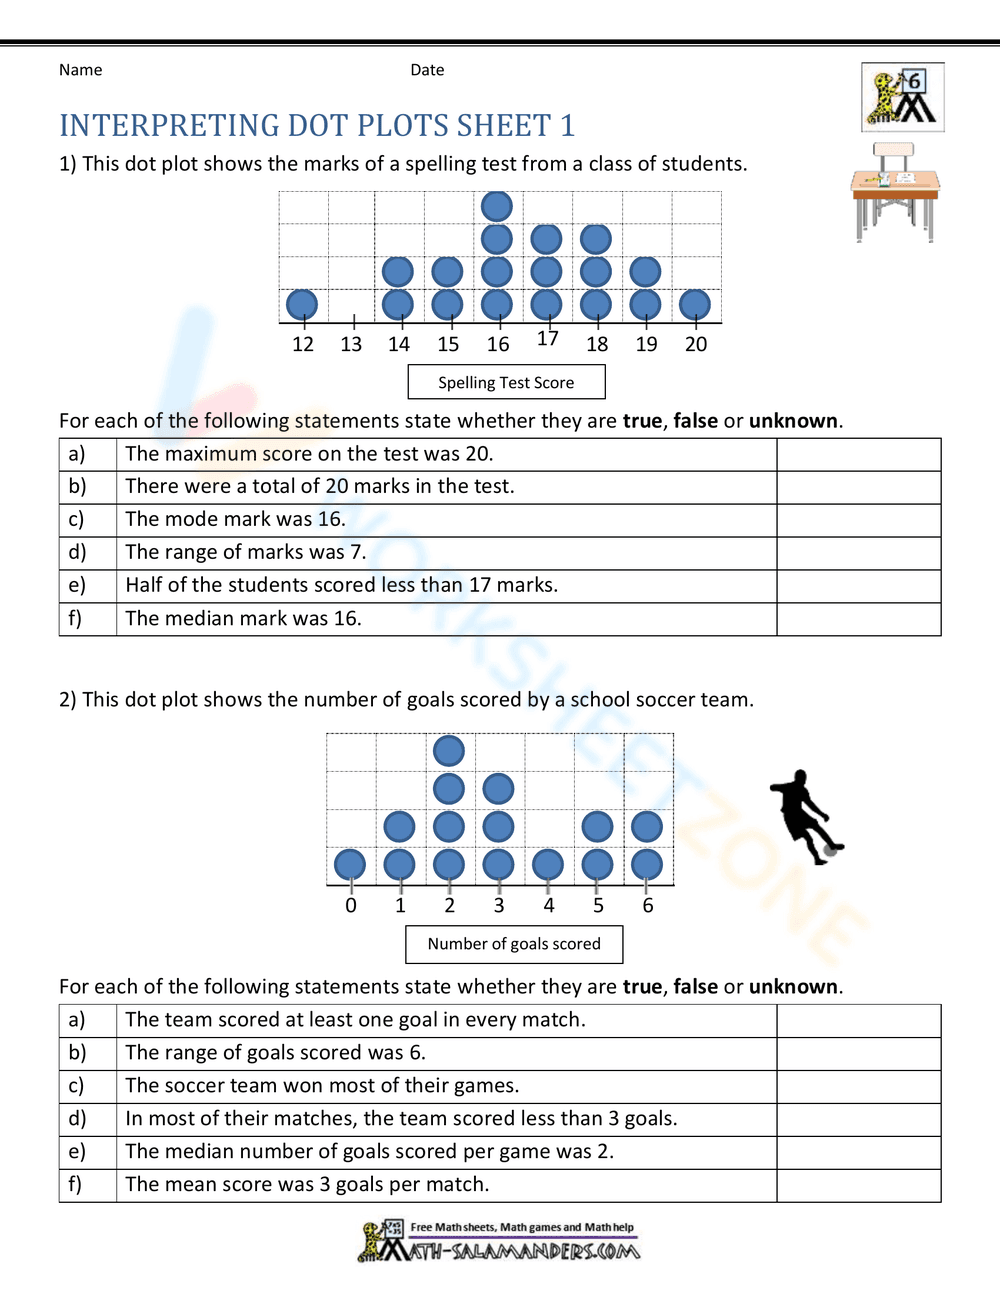
This is an educational worksheet titled 'Interpreting Dot Plots Sheet 1.' It features two dot plots. The first dot plot displays the marks from a spelling test, with scores ranging from 12 to 20. Students are asked to evaluate statements about the dot plot and determine if they are true, false, or unknown. The second dot plot represents the number of goals scored by a school soccer team, ranging from 0 to 6 goals. Students again evaluate statements about the dot plot to determine if they are true, false, or unknown.
Grade Level Suitability:
This worksheet is suitable for grades 4-6. It requires students to interpret data presented in dot plots, calculate measures of central tendency (mode, median, mean, range), and evaluate the truthfulness of statements based on the data. These skills are typically developed in the upper elementary and early middle school grades.
Why Use It:
This worksheet helps students develop data interpretation skills, specifically working with dot plots. It reinforces understanding of statistical measures like mode, median, mean, and range in a visual context. It also promotes critical thinking as students evaluate statements and determine their validity based on the data presented.
How to Use It:
Students should first carefully examine each dot plot and understand what data it represents. Then, they should read each statement provided and analyze the dot plot to determine if the statement is true, false, or if the information is unknown based on the data shown. They can then mark their answer in the space provided.
Target Users:
This worksheet is designed for students in grades 4-6 who are learning about data analysis, dot plots, and basic statistical measures. It can be used as a classroom activity, homework assignment, or as a review tool. It's also helpful for students who need extra practice interpreting data in a visual format.