


Views
Downloads
Graphing Periodic Trends Worksheet | Essential Chemistry
Paste this activity's link or code into your existing LMS (Google Classroom, Canvas, Teams, Schoology, Moodle, etc.).
Students can open and work on the activity right away, with no student login required.
You'll still be able to track student progress and results from your teacher account.
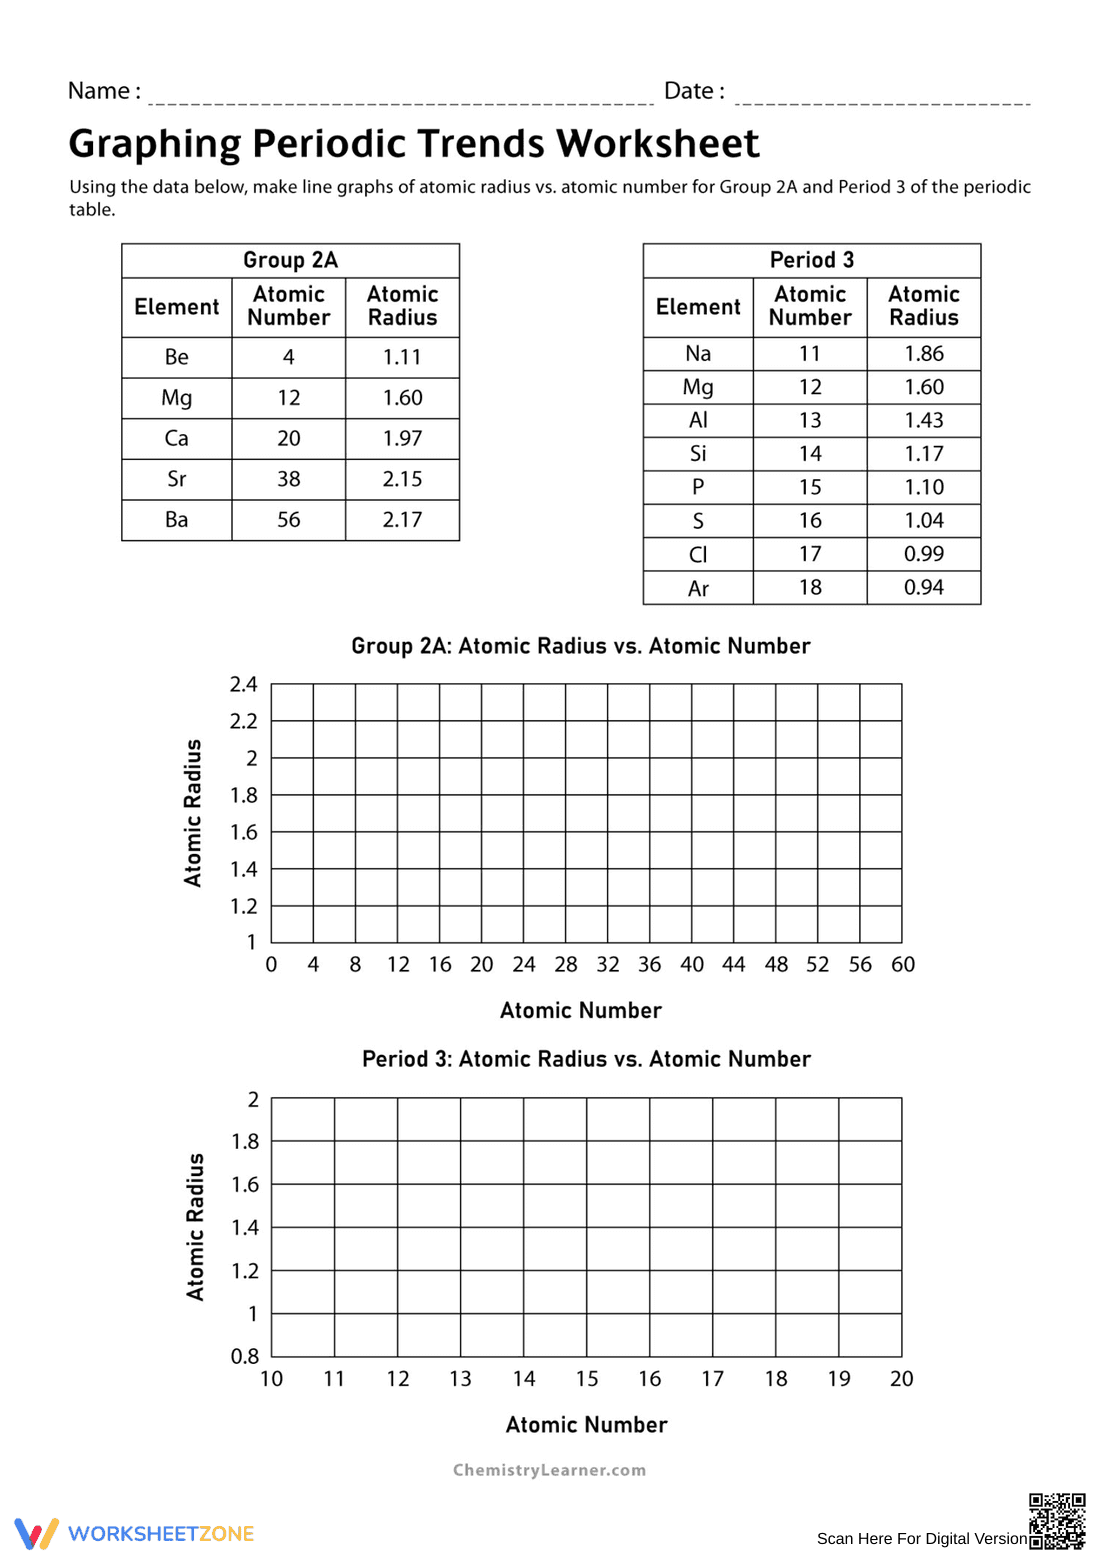
This Graphing Periodic Trends Worksheet provides a structured way for students to visualize how atomic radius changes across periods and down groups. By plotting raw data for 13 different elements, learners move beyond rote memorization to identify the underlying physical patterns of the periodic table through active data analysis.
At a Glance
- Grade: 9-12 · Subject: Chemistry
- Standard:
HS-PS1-1— Use periodic table patterns to predict relative physical properties of elements- Skill Focus: Data visualization and trend analysis
- Format: 1 page · 2 graphing tasks · Answer key included · PDF
- Best For: Introductory chemistry units and lab preparation
- Time: 20–30 minutes
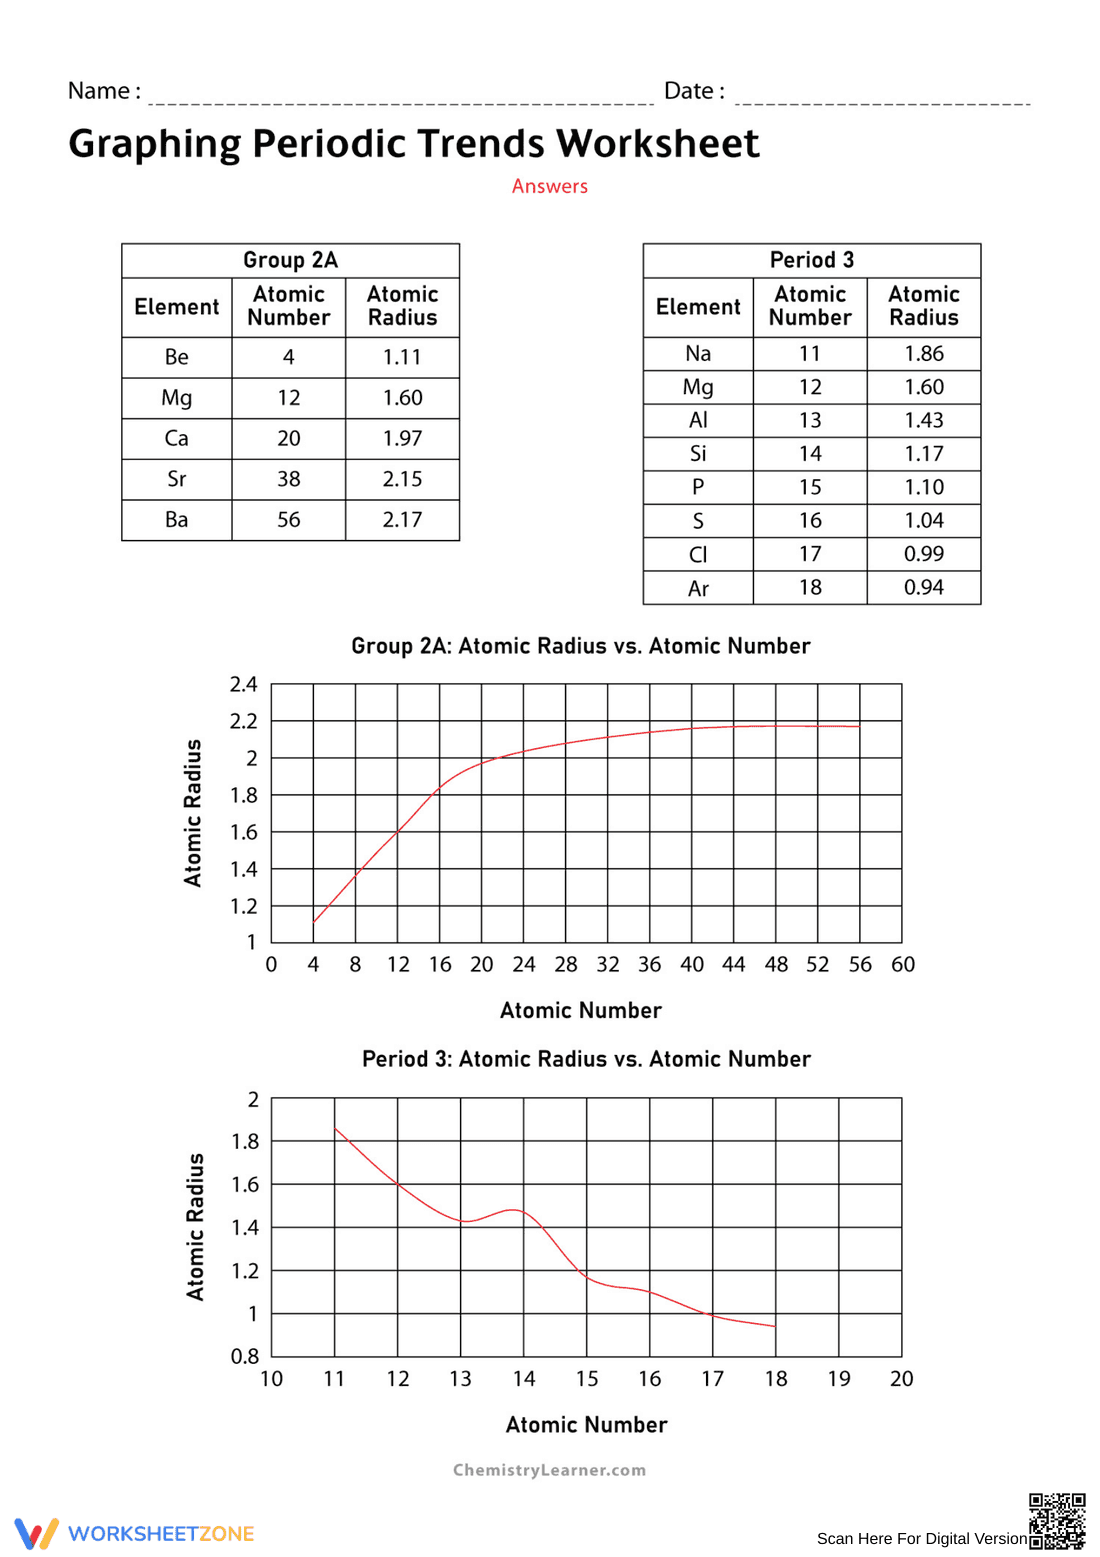
The resource contains two distinct data sets designed to highlight specific trends. The first table focuses on Group 2A (Alkaline Earth Metals), while the second covers the entirety of Period 3. Students are provided with pre-labeled and scaled axes for both atomic number and atomic radius, ensuring the focus remains on accurate plotting and trend interpretation rather than the mechanics of graph setup. The inclusion of a full-color answer key allows for quick grading or student self-assessment.
This worksheet is designed for a zero-prep classroom environment. Step 1: Print the single-page PDF for your class (30 seconds). Step 2: Distribute to students as a bell-ringer or guided practice activity during your periodic table unit (1 minute). Step 3: Use the included visual answer key to project the correct curves for immediate student review and discussion (5 minutes). Total teacher preparation time is under two minutes, making it an ideal choice for busy schedules or emergency sub plans.
Aligned to HS-PS1-1, students use the periodic table as a model to predict the relative properties of elements based on the patterns of electrons. By graphing atomic radius, they see the physical manifestation of effective nuclear charge and electron shielding. Both standard codes can be copied directly into lesson plans, IEP goals, or district curriculum mapping tools to ensure compliance with modern science frameworks.
Use this worksheet during the "Explore" phase of a 5E lesson cycle. Before delivering a formal lecture on atomic radius, have students plot the points to discover the "decreasing across, increasing down" trend themselves. It also serves as an excellent formative assessment to check if students can distinguish between groups and periods. Expect students to spend approximately 25 minutes completing the plots and identifying the resulting curves.
This is ideal for general high school chemistry or honors-level physical science students. It specifically supports visual learners who may struggle with abstract chemical concepts. For a complete lesson, pair this with a periodic table color-coding activity or an interactive simulation to reinforce the relationship between electron shells and atomic size across different element families.
According to the RAND AIRS 2024 report on science literacy, the ability to translate tabular data into graphical representations is a critical predictor of success in advanced STEM coursework. This worksheet addresses that need by requiring students to engage with the standard HS-PS1-1 through active data manipulation. By plotting atomic radius against atomic number, students internalize the periodic law in a way that reading a textbook cannot replicate. Research from Fisher & Frey (2014) suggests that such guided discovery through graphing helps bridge the gap between mathematical data and conceptual scientific understanding. This resource provides the necessary scaffolding—including pre-scaled axes and a clear answer key—to ensure that the cognitive load remains focused on the scientific trend rather than the mechanics of graph construction. It is a high-utility tool for any chemistry curriculum focused on evidence-based mastery of periodic properties.