


Views
Downloads
Printable Bar Graph Worksheet | Grade 3 Math
Paste this activity's link or code into your existing LMS (Google Classroom, Canvas, Teams, Schoology, Moodle, etc.).
Students can open and work on the activity right away, with no student login required.
You'll still be able to track student progress and results from your teacher account.
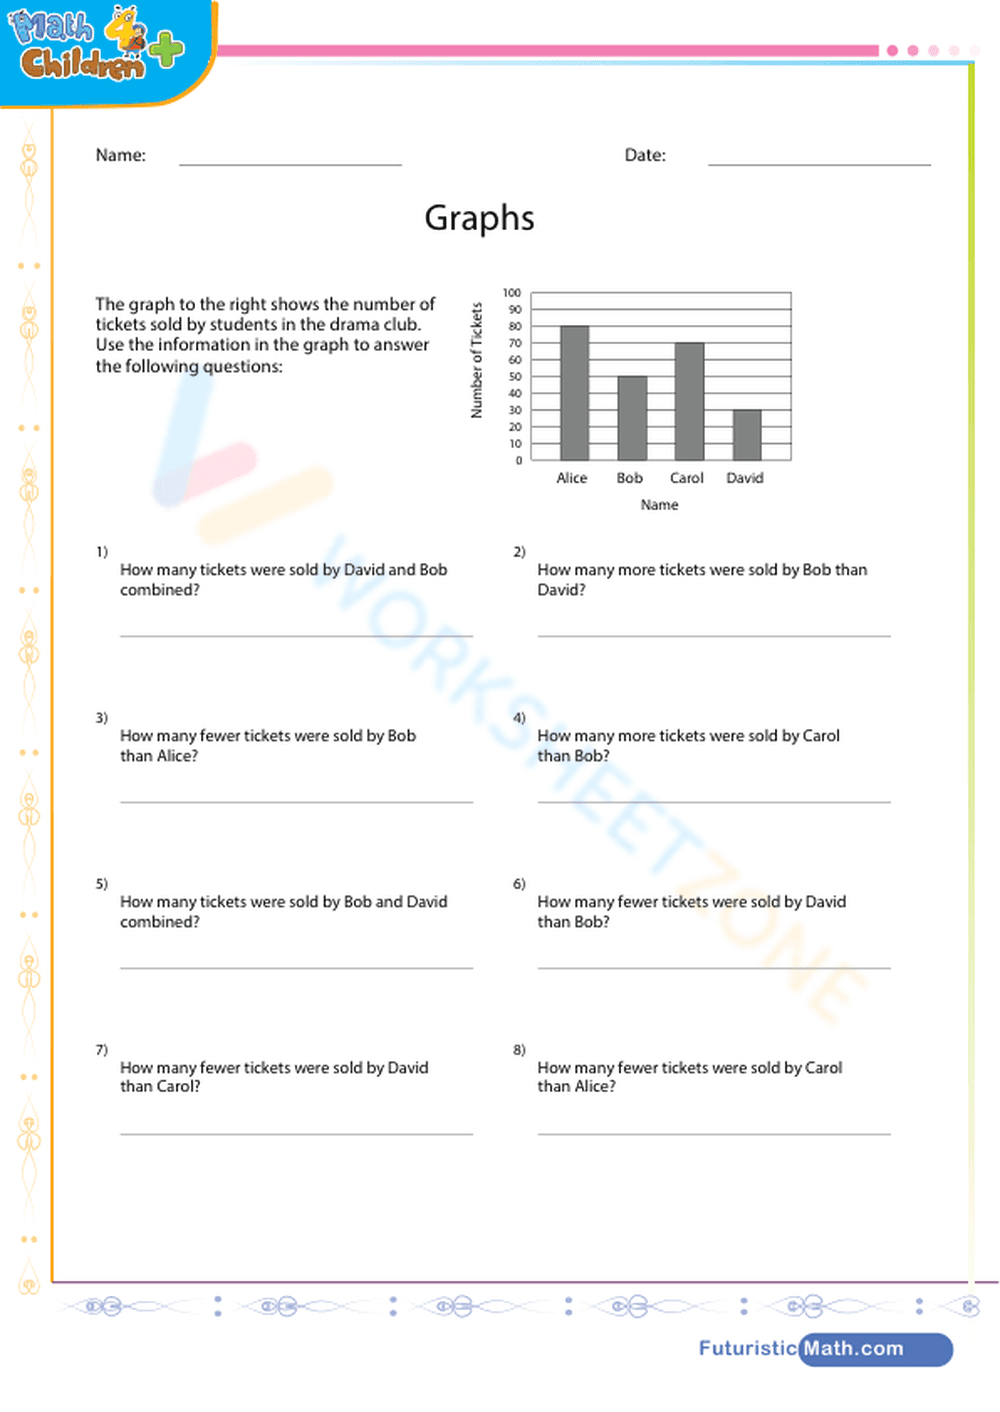
This math worksheet provides targeted practice for Grade 3 students on reading and interpreting scaled bar graphs. Students use the data presented in a clear visual format to answer eight questions, strengthening their ability to analyze information, compare quantities, and perform simple calculations based on the graph.
At a Glance
- Grade: 3 · Subject: Math
- Standard:
CCSS.MATH.CONTENT.3.MD.B.3— Solve problems using information from scaled bar graphs.- Skill Focus: Reading Bar Graphs, Data Interpretation
- Format: 2 pages · 8 problems · Answer key included · PDF
- Best For: Independent practice, formative assessment, homework
- Time: 15–20 minutes
What's Inside
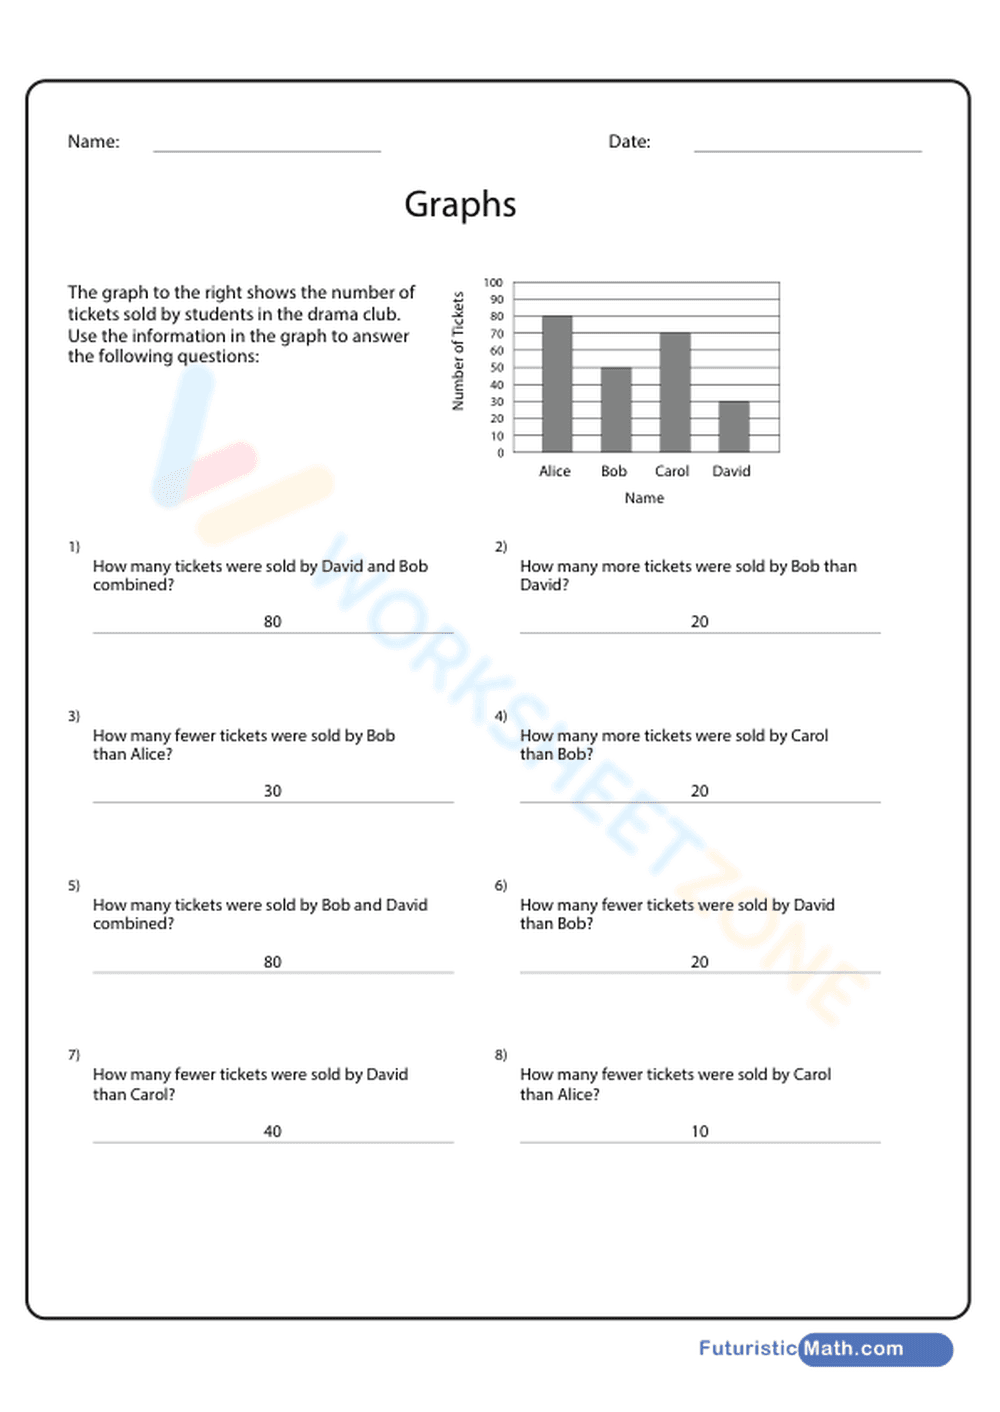
This two-page resource includes a single-page worksheet and a full answer key. The worksheet presents a bar graph showing tickets sold by four students. Below are eight questions that require students to locate data points, combine values, and find the difference between values.
Skill Progression
The worksheet follows a model to build student confidence.
- Guided Practice: The first questions ask students to find the total tickets sold by one or two students, a direct entry point.
- Supported Practice: Middle questions ask "how many more" or "how many fewer," prompting students to subtract after reading the graph.
- Independent Practice: The final questions combine skills, requiring students to interpret comparative language and solve one-step problems independently.
This structure helps all learners access the material.
Standards Alignment
Aligned with Common Core standard CCSS.MATH.CONTENT.3.MD.B.3, which requires students to solve one- and two-step problems using information from scaled bar graphs. This worksheet focuses on the problem-solving component of this standard. The standard code can be copied directly into lesson plans or curriculum maps.
How to Use It
This resource is ideal for independent practice after a lesson on bar graphs. Use it as a math center activity, for homework, or as a quick exit ticket. As a formative assessment, observe if students correctly identify values on the scaled axis before calculating; this can reveal gaps in understanding. Most students can complete the worksheet in 15-20 minutes.
Who It's For
Designed for third-graders learning data analysis, this is also suitable for fourth-graders needing review or advanced second-graders. The clear layout supports diverse learners. Pair this worksheet with an anchor chart defining key vocabulary like "axis" and "scale" to support success.
This worksheet offers practice on CCSS.MATH.CONTENT.3.MD.B.3, helping students solve problems using scaled bar graphs. Developing data literacy is a critical component of elementary mathematics. The RAND AIRS 2024 report highlights that proficiency with visual data in early grades is a key predictor of success in later STEM coursework. By engaging with tasks like reading a bar graph to find differences and totals, students translate abstract numbers into meaningful information. This activity supports the development of analytical skills by requiring learners to not only read data but also to perform operations based on what they read, a foundational skill for evidence-based reasoning.