


Views
Downloads
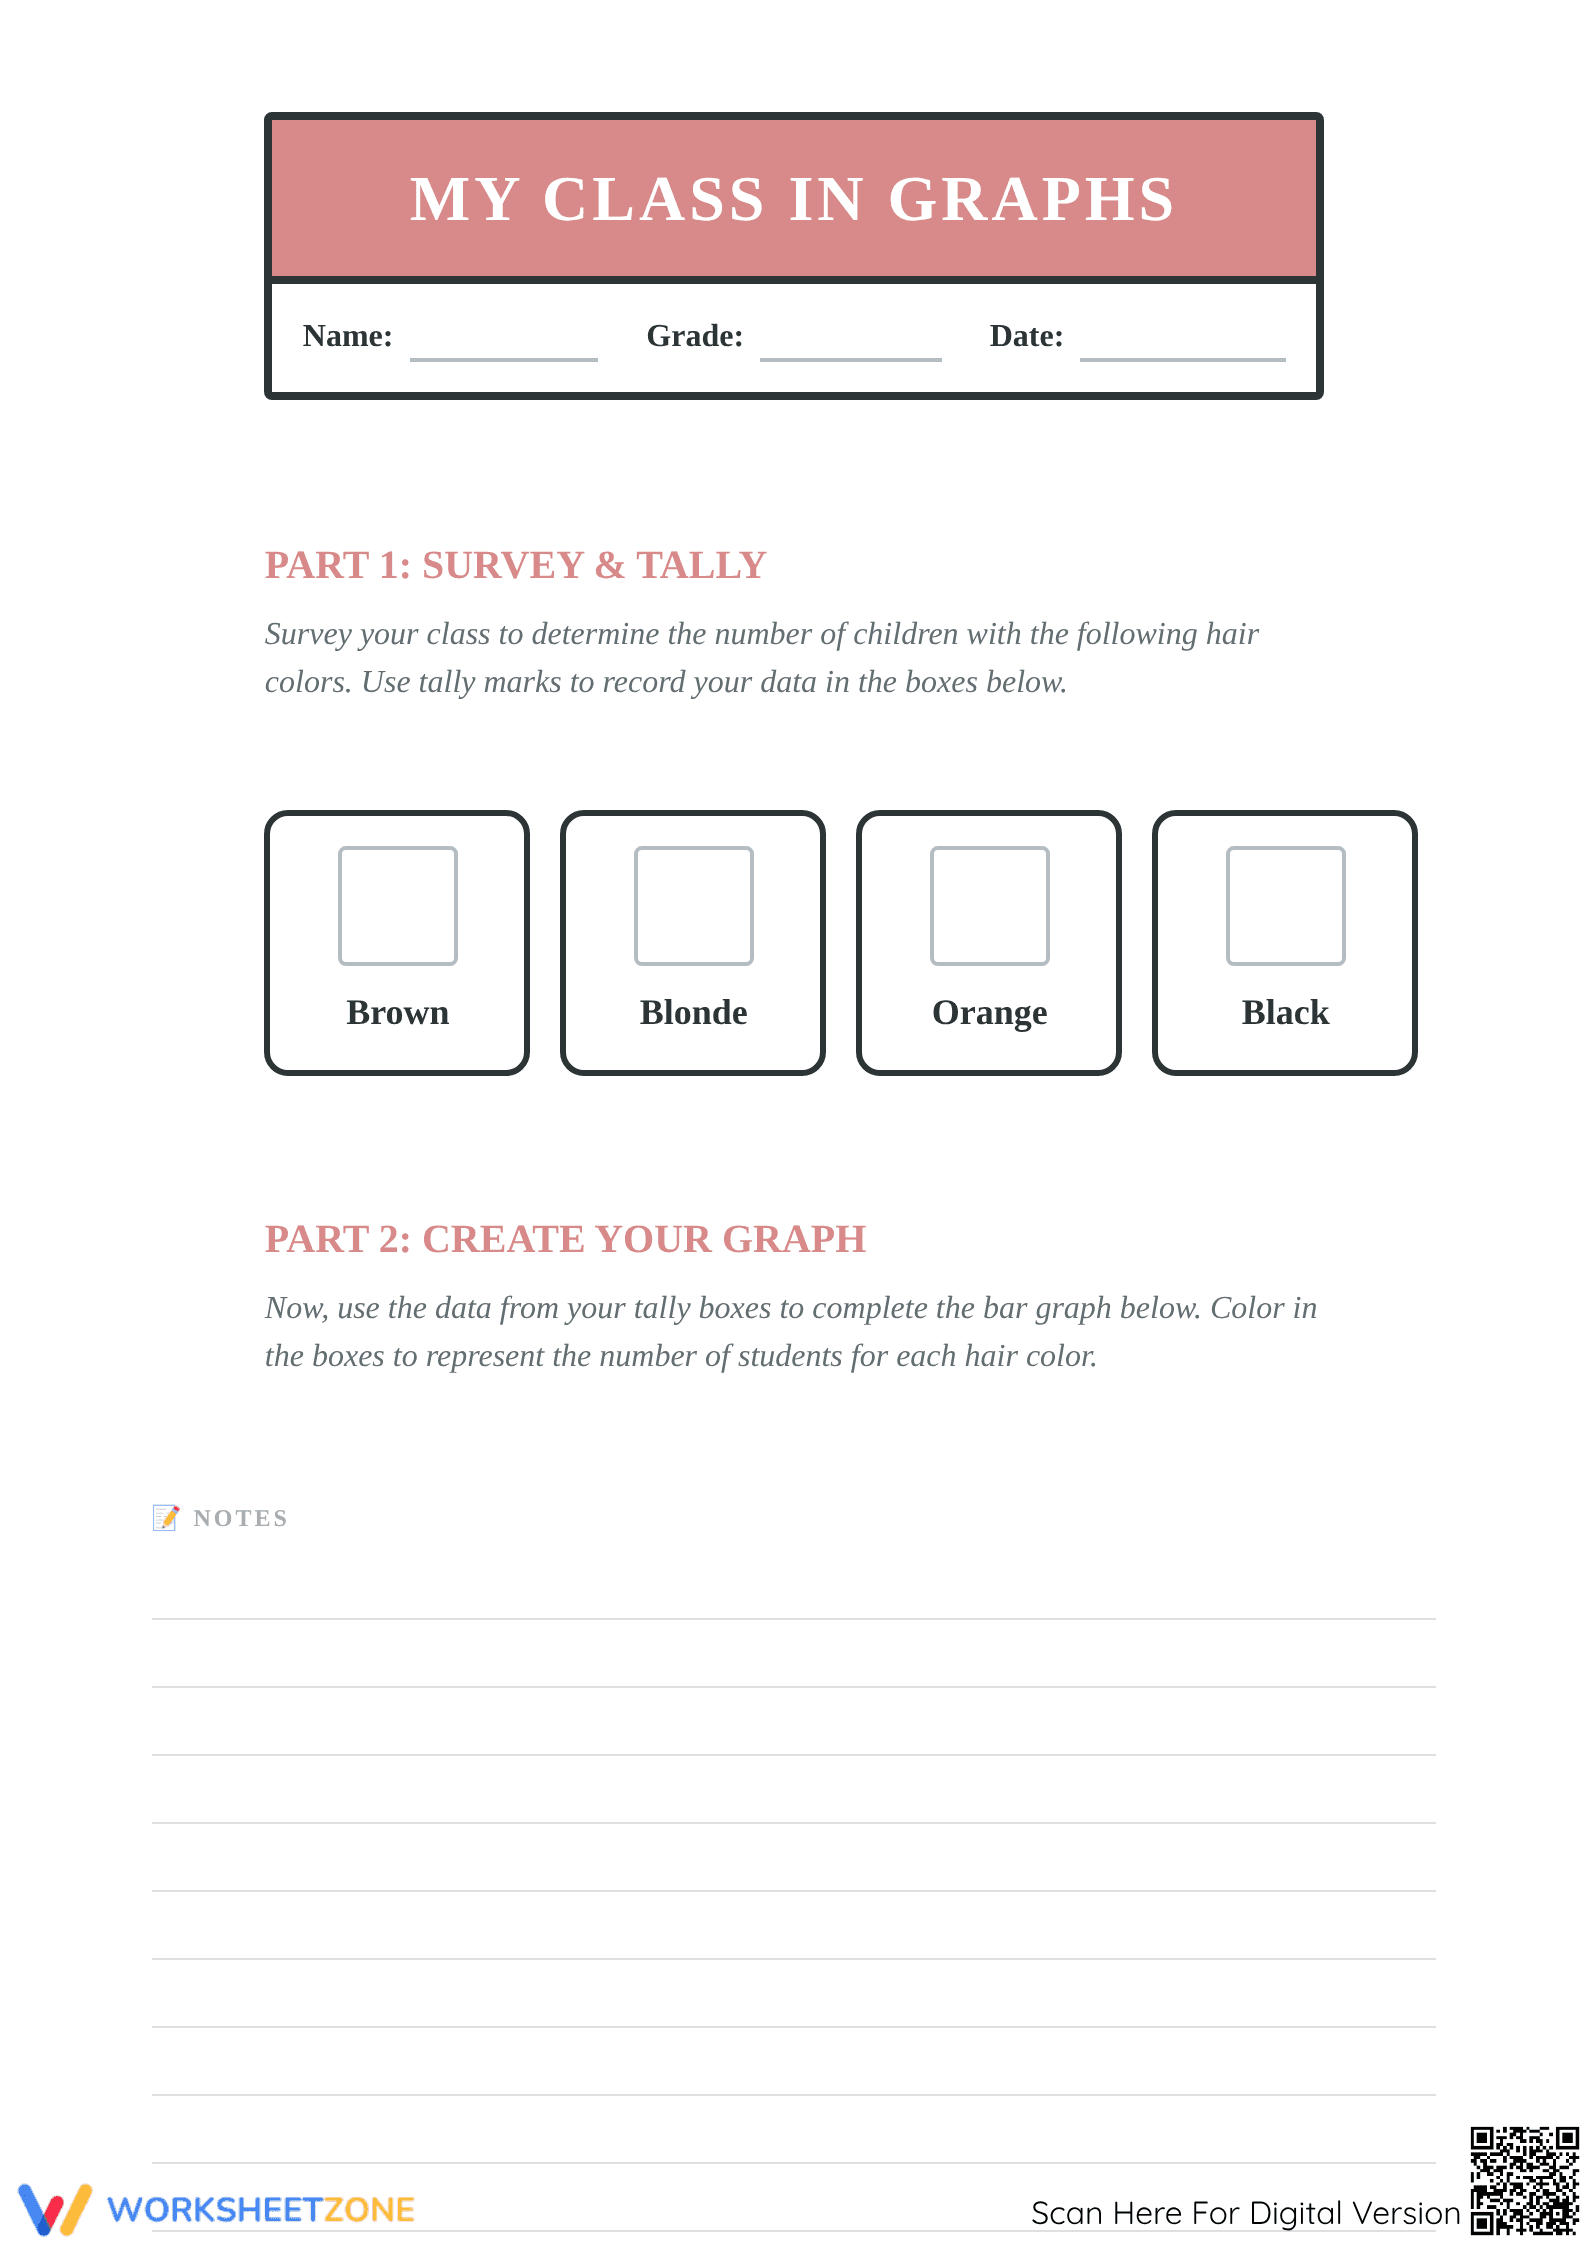
Printable Grade 2 Bar Graph Activity: My Class in Graphs
Paste this activity's link or code into your existing LMS (Google Classroom, Canvas, Teams, Schoology, Moodle, etc.).
Students can open and work on the activity right away, with no student login required.
You'll still be able to track student progress and results from your teacher account.
This Grade 2 worksheet offers a hands-on data collection project. Students survey peers, organize data with tally marks, and construct a bar graph using real-world classroom data (hair colors). This activity helps students understand how numbers translate to visual representations and master data interpretation.
At a Glance
- Grade: 2 · Subject: Math
- Standard:
CCSS.2.MD.D.10— Draw a bar graph to represent data and solve simple problems using the graph.- Skill Focus: Surveying, tallying, and bar graph construction
- Format: 3 pages · 11 tasks · Answer key included · PDF
- Best For: Interactive classroom data projects and introductory graphing
- Time: 25–35 minutes
What's Inside
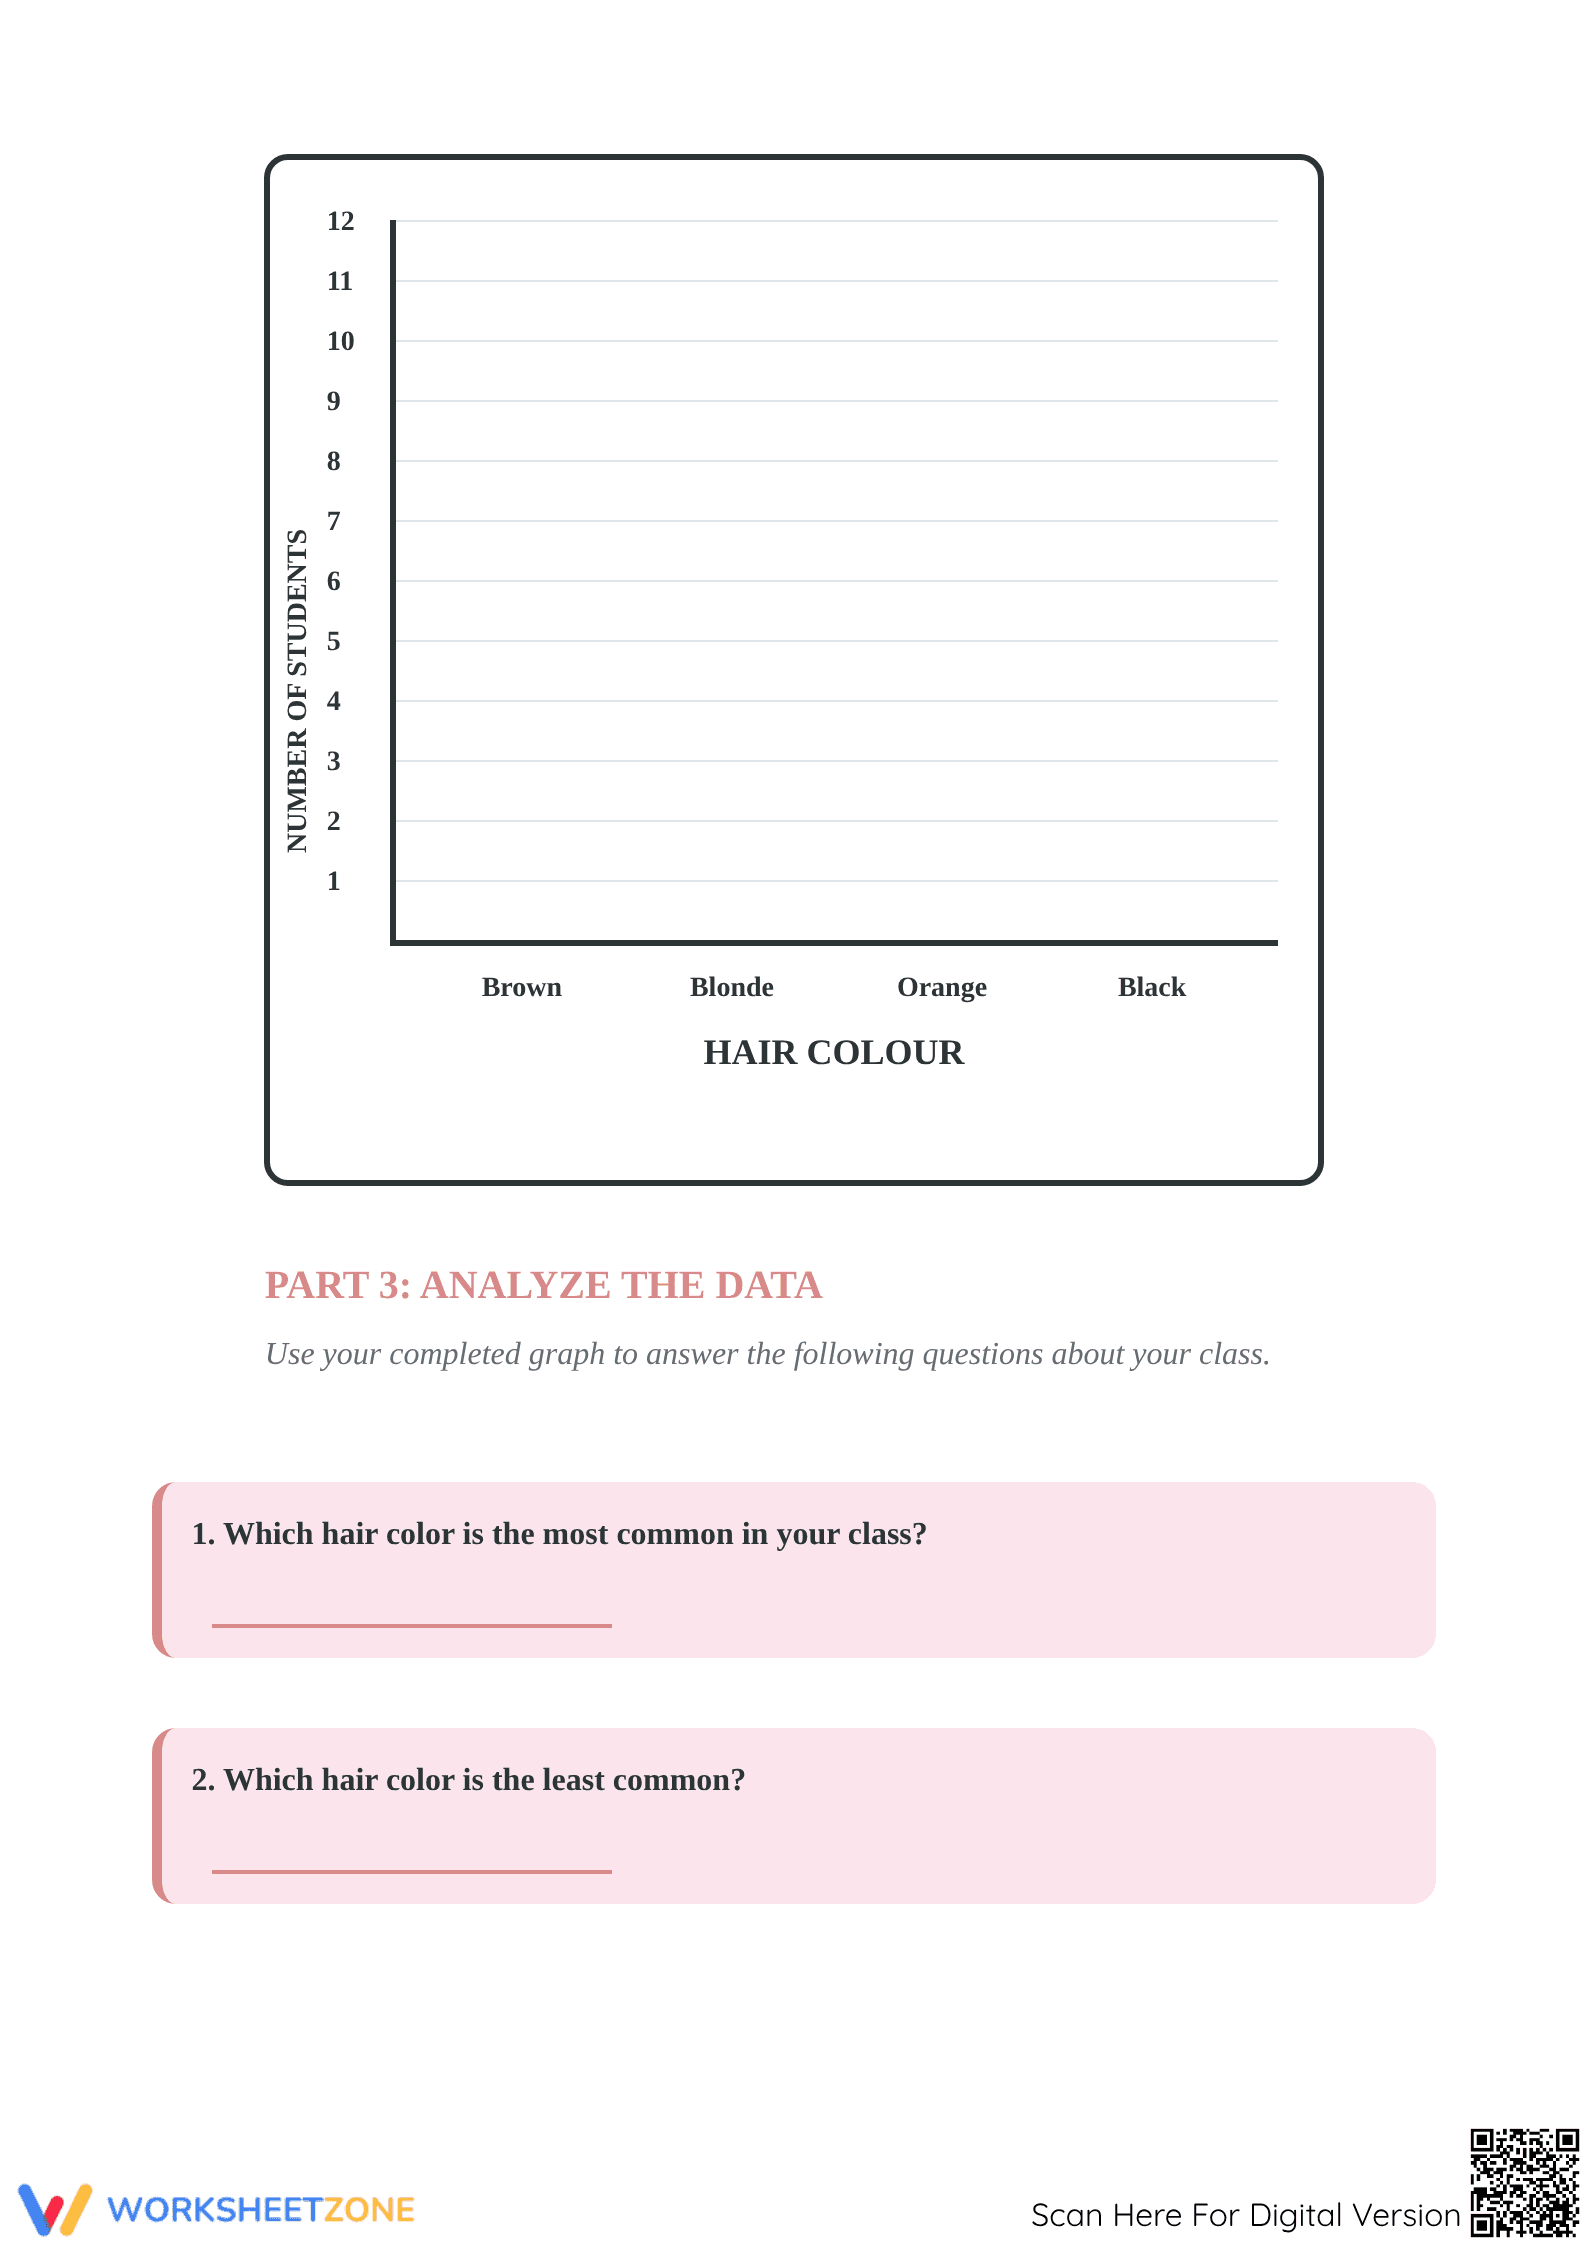
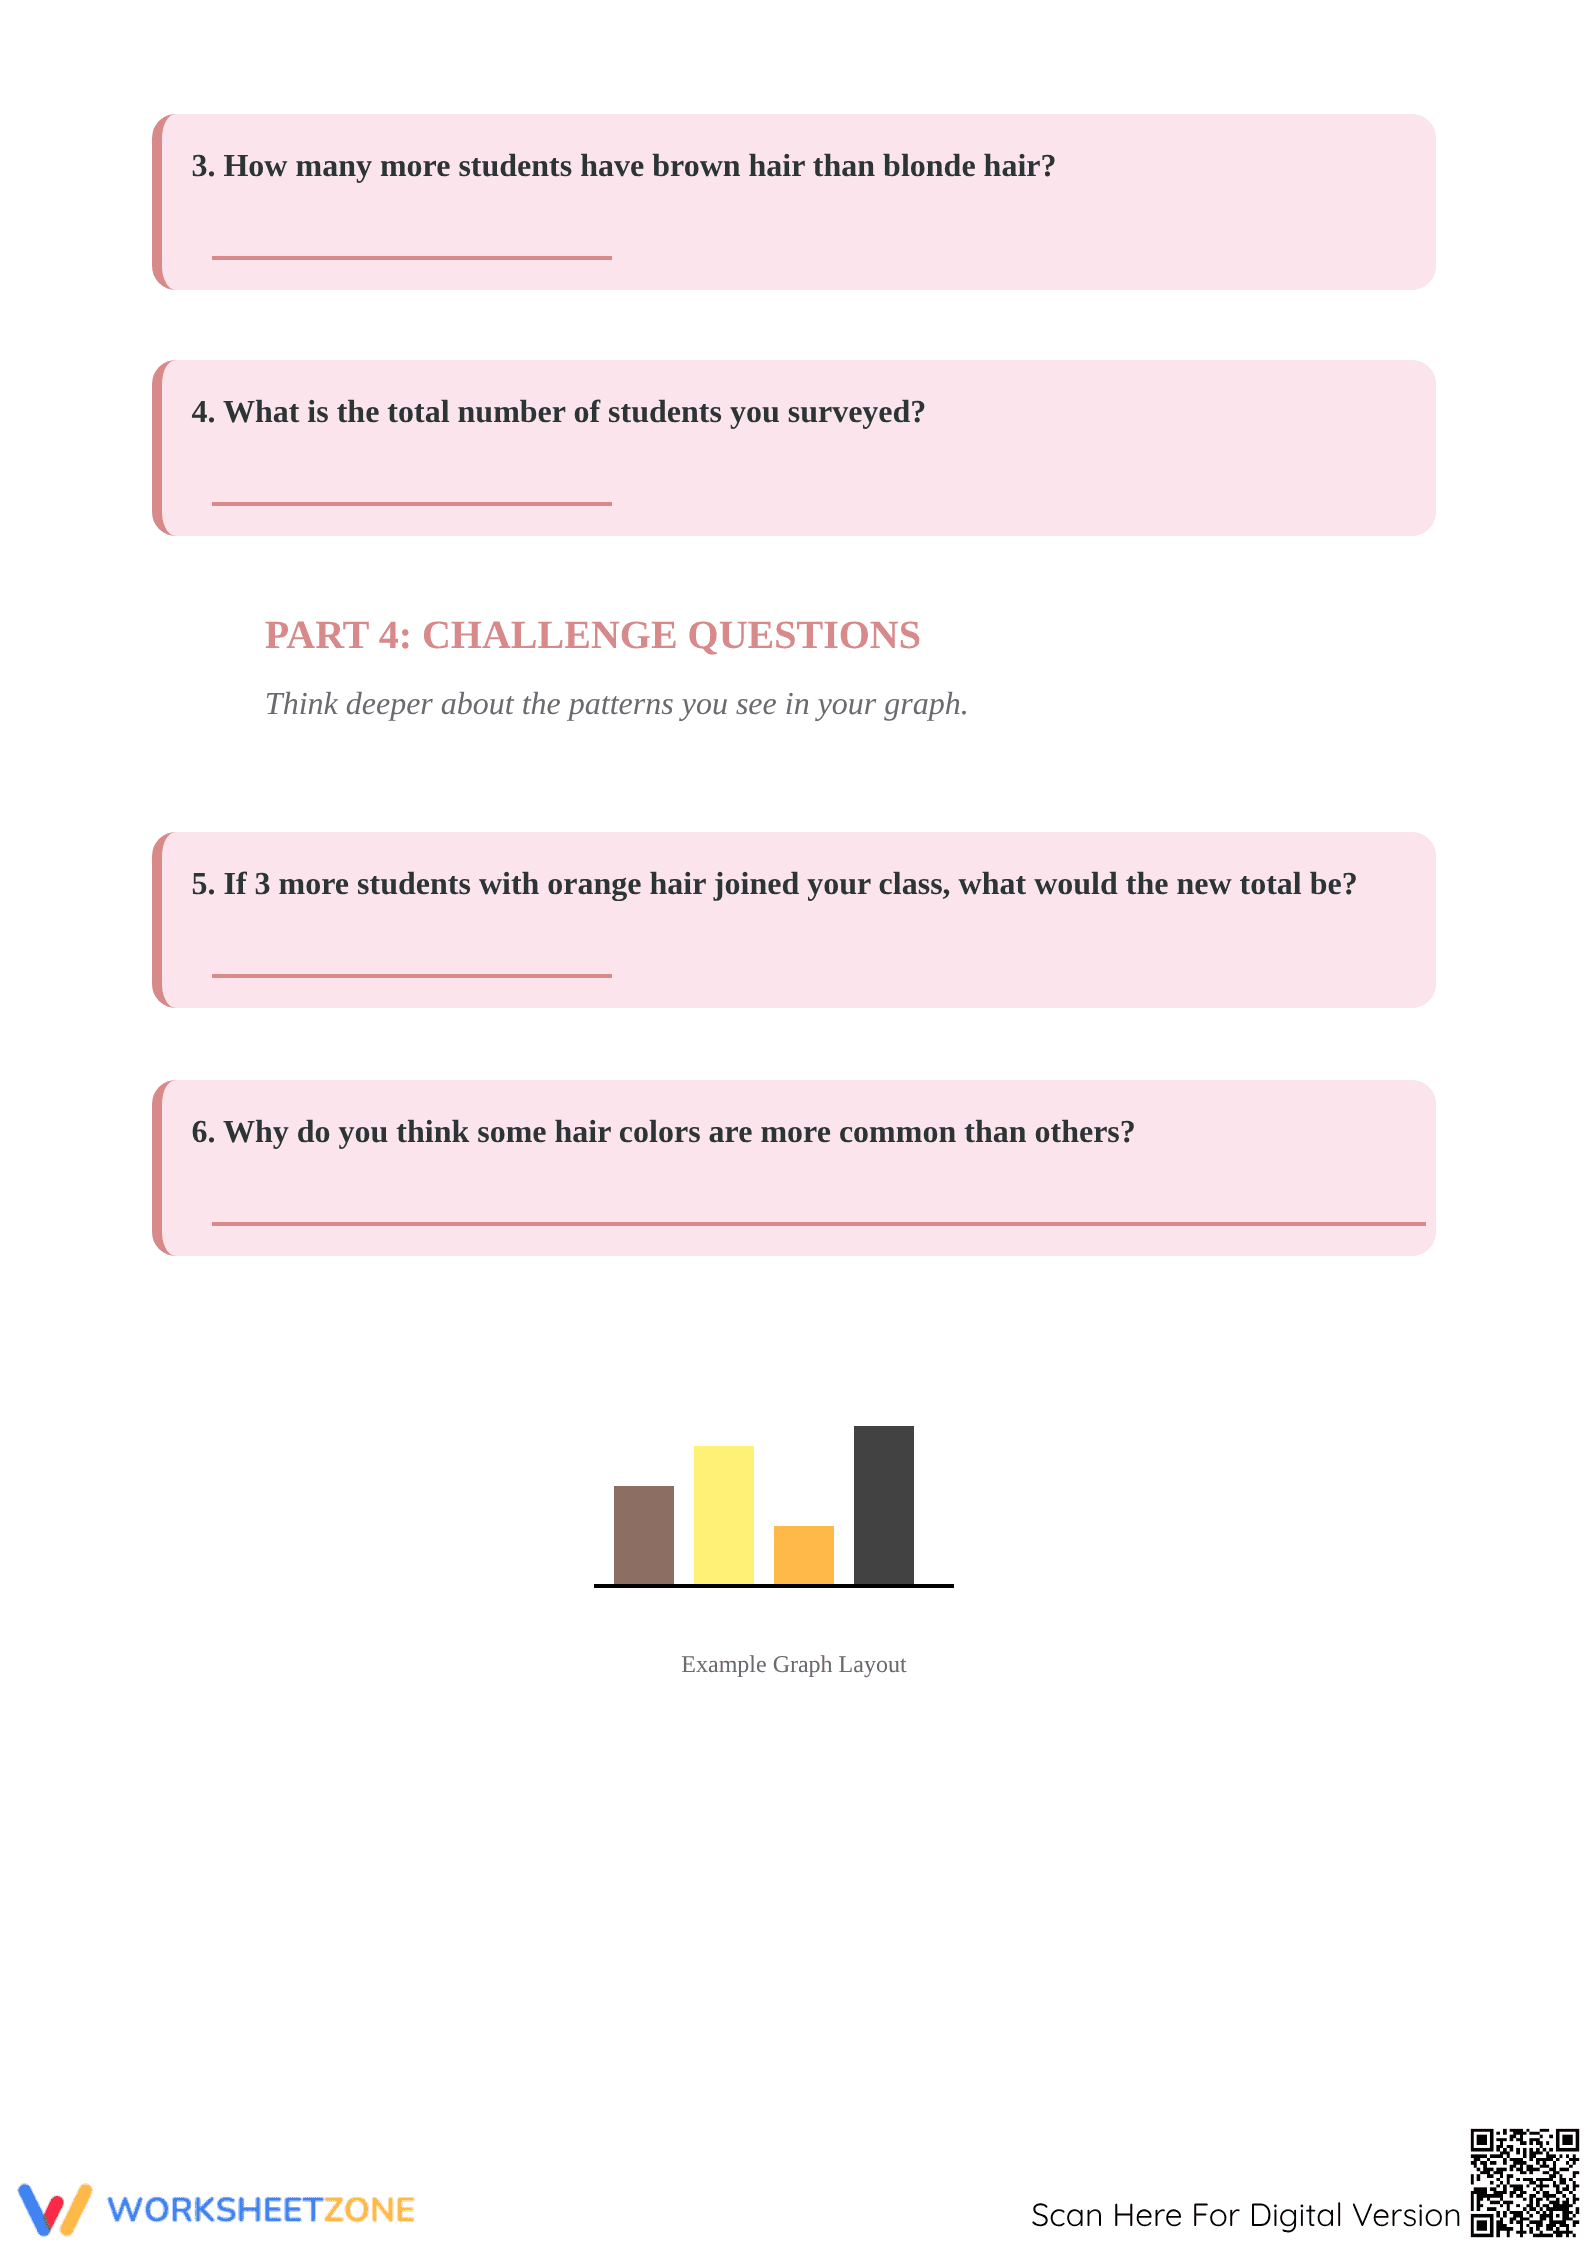
This 3-page PDF has four phases: survey and tally for four hair color categories (brown, blonde, orange, black); a large graphing grid (vertical axis 1-12); and six analysis questions, from basic identification to multi-step problems. A complete answer key is included for easy grading.
Zero-Prep Workflow
Designed for zero-prep, this worksheet allows quick transition from instruction to independent practice. Simply print the 3-page packet; self-contained instructions mean students can start surveying immediately. Efficient review is enabled by the clear grid layout, making it ideal for substitute folders or spontaneous data lessons.
Standards Alignment
This resource primarily focuses on `CCSS.MATH.CONTENT.2.MD.D.10`, requiring students to draw and interpret bar graphs for data sets with up to four categories. It also covers solving simple addition, subtraction, and comparison problems using graph information. The standard code can be directly used in lesson plans, IEP goals, or curriculum mapping.
How to Use It
Ideal for the 'We Do' or 'You Do' phase of data lessons, this worksheet functions as a formative assessment. Observing students as they graph provides intervention opportunities. It's also an excellent project to conclude a unit on measurement and data, showcasing practical skill utility.
Who It's For
Designed for second graders, this activity also suits third-grade review or first-grade enrichment. It supports ELLs with visual categories and a structured word bank. For differentiation, pair it with a physical anchor chart.
Integrating data collection and representation is crucial for quantitative literacy in early elementary math. This Grade 2 bar graph activity targets `CCSS.2.MD.D.10`, fostering foundational statistical reasoning through surveying, tallying, and visual synthesis. By interpreting their own data via six analytical questions, students reinforce the link between information and insights. This resource scaffolds students from simple counting to comparative analysis, enabling teachers to confidently assess standard mastery and meet national benchmarks for data proficiency.