


0
Views
0
Downloads
0.0
0
Save
0 Likes
Geological Time Scale Learning Chart
0 Views
0 Downloads
Paste this activity's link or code into your existing LMS (Google Classroom, Canvas, Teams, Schoology, Moodle, etc.).
Students can open and work on the activity right away, with no student login required.
You'll still be able to track student progress and results from your teacher account.
Information
Description
What It Is:
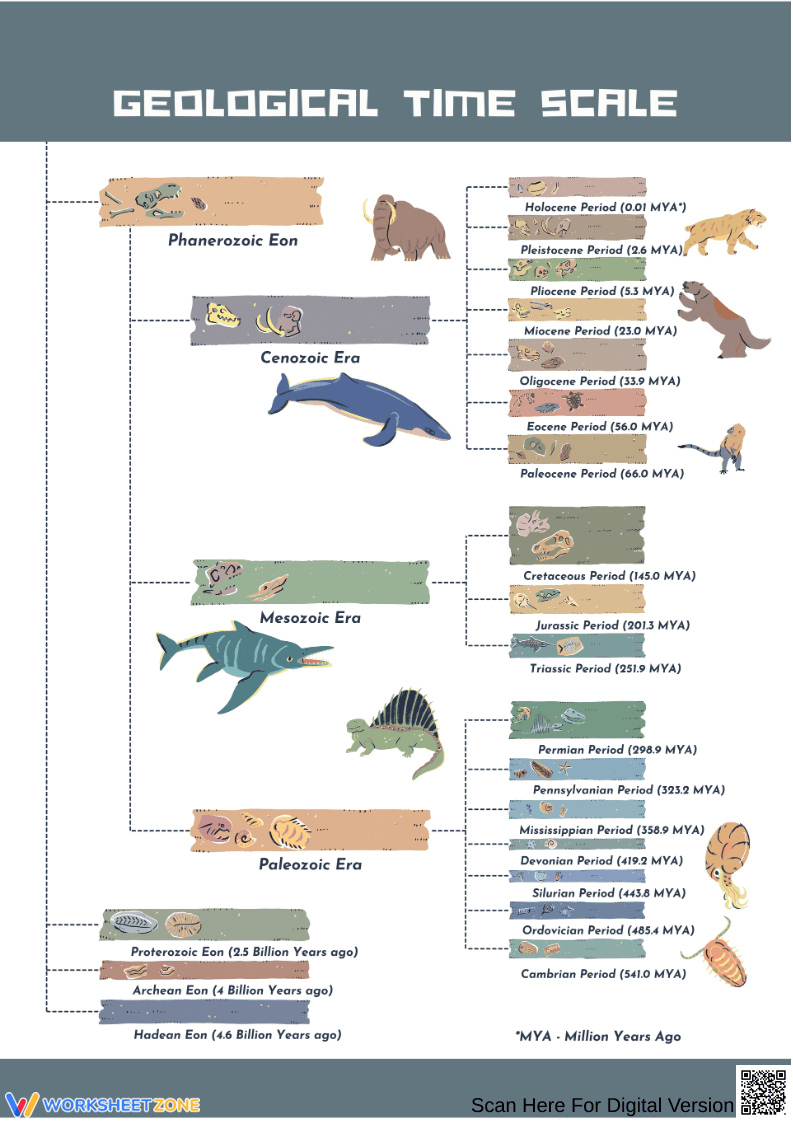
A visual geological time scale chart that illustrates the major eons, eras, and periods of Earth’s history, from the Hadean Eon to the present. The worksheet highlights key time divisions—such as the Paleozoic, Mesozoic, and Cenozoic eras—and includes representative fossils and animals to help students understand how life evolved over millions of years.
Why Use It:
This chart helps students grasp the vast timeline of Earth’s history and the major biological and geological events that define each era and period. It supports lessons in Earth science, evolution, paleontology, and historical geology while making abstract time scales easier to visualize.
How to Use It:
• Use as a reference guide during Earth science or evolution units.
• Pair with worksheets on fossils, extinction events, and adaptive radiation.
• Assign as a labeling, sorting, or coloring activity to reinforce sequencing skills.
• Display in classrooms or notebooks for ongoing study and review.
Grade Suitability:
Best suited for Grades 5–10.
• Accessible for upper elementary learning the basics of Earth’s timeline.
• Supports deeper middle-school and early high-school study of evolution and geologic processes.
Target Users:
Teachers, tutors, and homeschooling parents teaching Earth science, geology, evolution, or paleontology concepts.