


Views
Downloads
Essential Food Web Chart Worksheet | Grades 3-5 Science
Paste this activity's link or code into your existing LMS (Google Classroom, Canvas, Teams, Schoology, Moodle, etc.).
Students can open and work on the activity right away, with no student login required.
You'll still be able to track student progress and results from your teacher account.
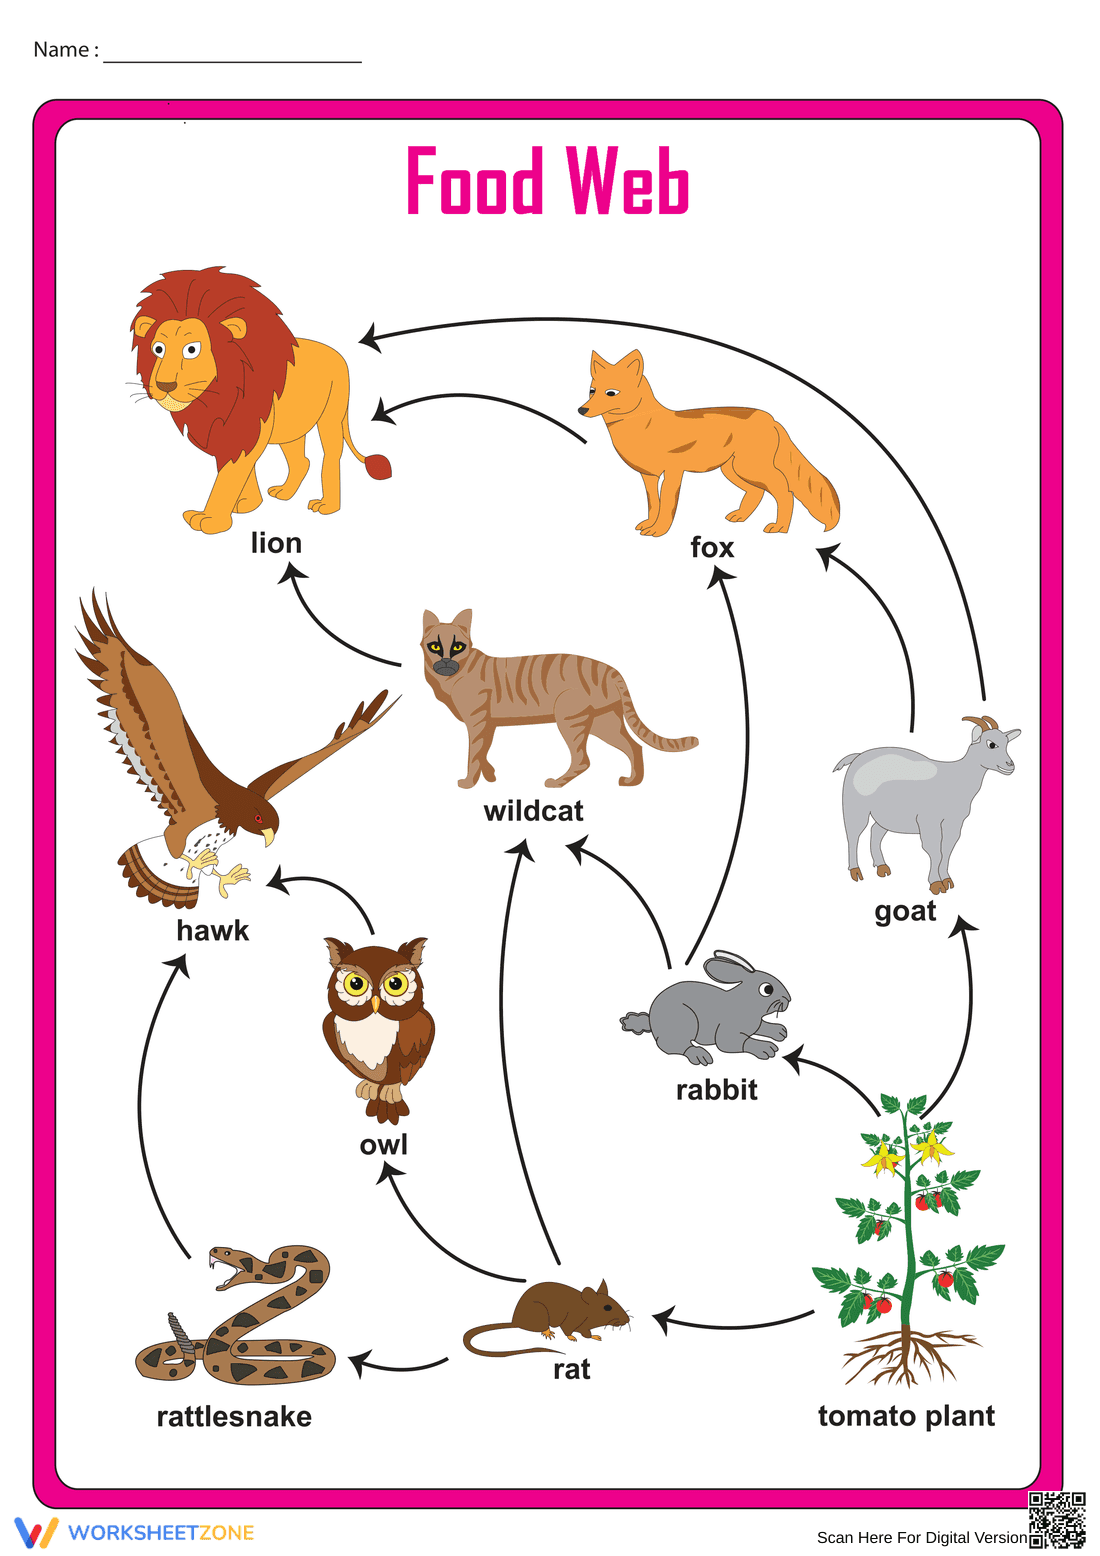
This Food Web Chart provides a clear visual model of energy flow and feeding relationships within a terrestrial ecosystem. Students will identify producers, consumers, and apex predators while observing how multiple food chains intersect. This essential reference tool helps learners grasp the complexity of biodiversity required to maintain healthy environmental cycles.
At a Glance
- Grade: 5 · Subject: Living Things
- Standard:
5-LS2-1— Develop a model to describe the movement of matter and energy- Skill Focus: Interdependent Relationships in Ecosystems
- Format: 1 page · 0 problems · Reference Chart · PDF
- Best For: Science journal inserts and classroom posters
- Time: 5–10 minutes
This single-page PDF features a high-resolution diagram illustrating 10 distinct organisms, including a primary producer (tomato plant), various herbivores, and carnivores like the lion and hawk. The arrows indicate the direction of energy flow. It serves as a perfect visual aid for students to transition from simple food chains to complex food webs without additional teacher setup. All labels use clear, readable fonts to support literacy across different grade levels.
Zero-Prep Workflow
- Print (1 minute): Select the color version and print enough copies for student journals or as a full-page classroom reference poster.
- Distribute (1 minute): Hand out the charts during your lecture on ecosystems to provide immediate visual support.
- Review (1 minute): Prompt students to trace energy paths from the producer to apex predators.
Total prep time is under 2 minutes, making this an ideal last-minute supplement for introductory science lessons.
Standards Alignment
Primary standard 5-LS2-1 involves developing a model to describe the movement of matter among plants, animals, and the environment. This chart provides the visual foundation for such models by mapping specific pathways matter and energy take through a terrestrial community. Both standard codes can be copied directly into lesson plans, IEP goals, or district curriculum mapping tools for efficient tracking of student mastery.
How to Use It
Use this chart as an anchor during direct instruction to demonstrate how energy begins with producers and moves through various trophic levels. It also works as a formative assessment tool; ask students to identify a specific food chain within the larger web and explain the consequences of removing one organism. Expect students to spend 10 minutes analyzing the connections. This visualization simplifies the transition between identifying individual species and understanding broad ecological systems.
Who It's For
This resource is designed for Grade 3, 4, and 5 students studying life science and biology. It is particularly helpful for visual learners and English Language Learners who benefit from labeled diagrams and clear directional cues. Pair this with a reading passage about biomes or an interactive notebook activity where students create their own food web based on this terrestrial model to reinforce learning.
The Food Web Chart is a critical instructional resource for teaching standard 5-LS2-1, focusing on the interdependent relationships that define terrestrial ecosystems. By visualizing the transfer of energy from producers to apex predators, students develop a sophisticated understanding of ecological stability and the consequences of environmental changes. According to the RAND AIRS 2024 report, high-quality visual models are essential for bridging the gap between abstract scientific concepts and concrete student comprehension in elementary science education. This chart provides the necessary scaffolding to help learners distinguish between linear food chains and the reality of complex food webs. Its inclusion of familiar species like the rabbit and owl makes the data accessible while maintaining the rigor required for NGSS alignment. Educators can rely on this tool to support evidence-based inquiry into how matter cycles through organisms, ensuring students meet mastery benchmarks for Grade 5 life science standards.