


Views
Downloads
Grade 2 Weather Graphing — Printable No-Prep Worksheet
Paste this activity's link or code into your existing LMS (Google Classroom, Canvas, Teams, Schoology, Moodle, etc.).
Students can open and work on the activity right away, with no student login required.
You'll still be able to track student progress and results from your teacher account.
This Grade 2 worksheet builds a crucial bridge between reading comprehension and data visualization. Students practice interpreting descriptive sentences about weather patterns and accurately representing that information on a bar graph. The engaging, self-contained activity reinforces data literacy skills in a clear, accessible format for young learners.
At a Glance
- Grade: 2 · Subject: Science, Math
- Standard:
CCSS.MATH.CONTENT.2.MD.D.10— Draw a bar graph to represent a data set with up to four categories.- Skill Focus: Data Graphing, Reading for Detail
- Format: 2 pages · 5 problems · Answer key included · PDF
- Best For: Independent Practice, Math Centers, Sub Plans
- Time: 10–15 minutes
What's Inside
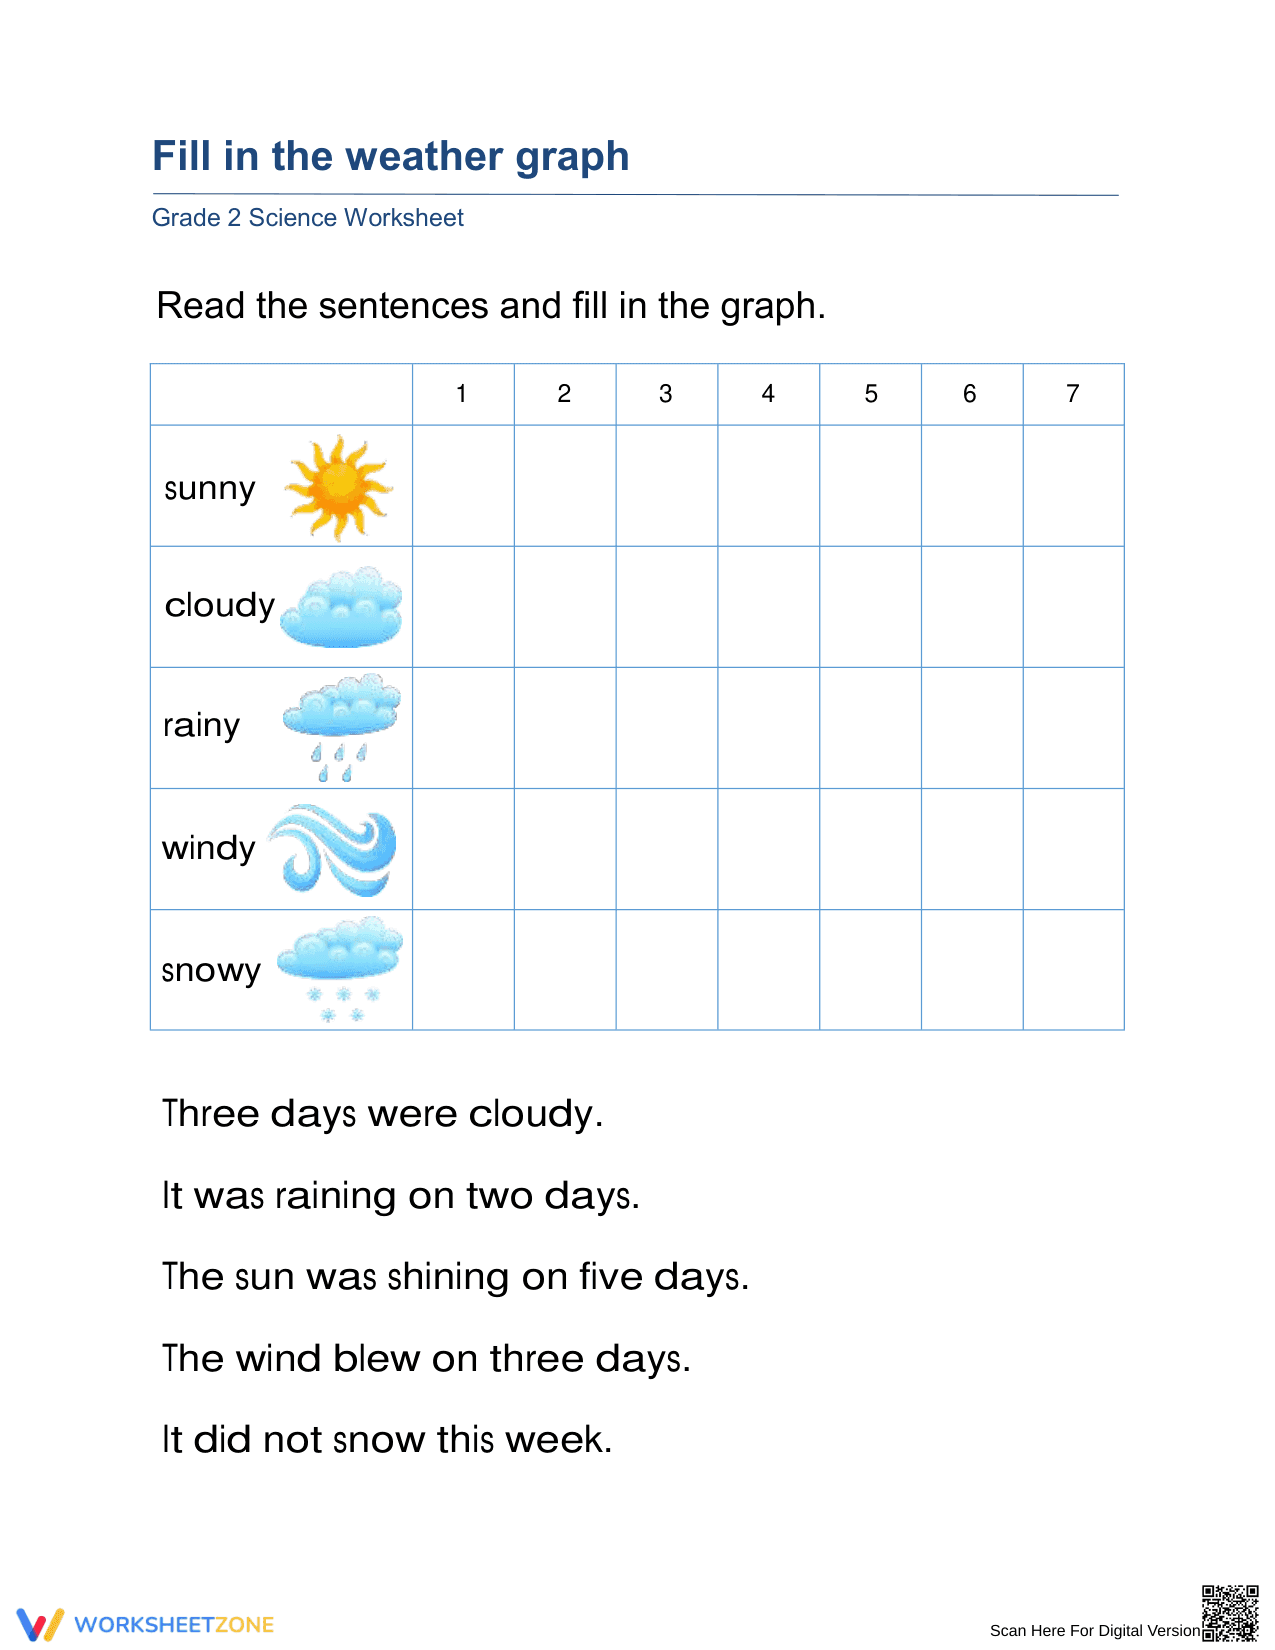
This two-page PDF contains a student worksheet and its answer key. The worksheet provides five text-based prompts about a week's weather. Students use these to fill in a horizontal bar graph, which includes helpful icons for the five weather categories (sunny, cloudy, rainy, windy, snowy).
Zero-Prep Workflow
This print-and-go activity needs less than two minutes of prep. 1. Print the single worksheet page for each student. 2. Distribute during your math block or as morning work. 3. Review using the answer key for a quick class check. Its self-contained design makes it a perfect, reliable resource for any substitute teacher plans.
Standards Alignment
This worksheet directly aligns with CCSS.MATH.CONTENT.2.MD.D.10, where students must draw a bar graph to represent a data set. It also supports science standards for recording weather observations (e.g., NGSS K-ESS2-1). Copy these codes directly into lesson plans or curriculum maps.
How to Use It
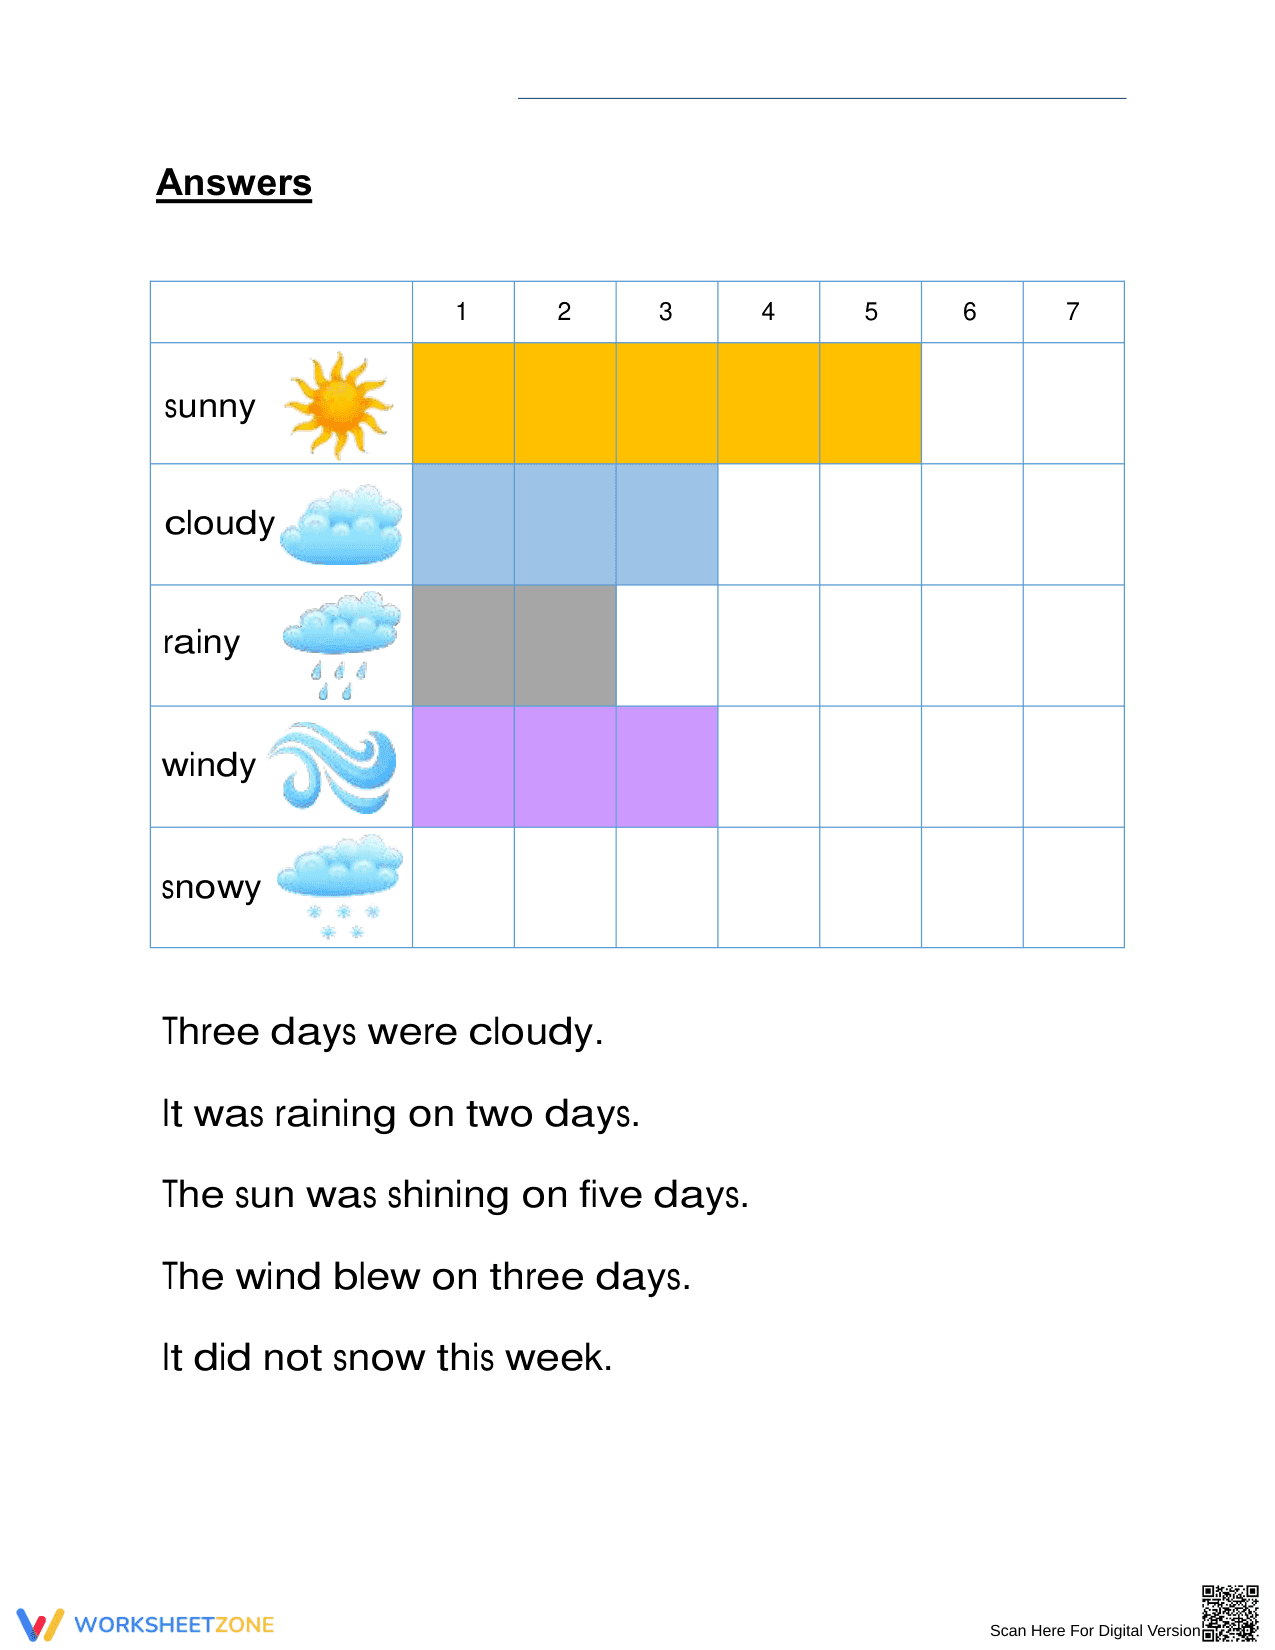
Use this as a formative assessment after an initial lesson on bar graphs. It also works perfectly as a partner activity in a math or science center. A key observation is whether students leave the 'snowy' row blank based on the text, demonstrating careful reading for detail.
Who It's For
Primarily for Grade 2, this also suits advanced Grade 1 students or Grade 3 students needing review. The clear icons provide scaffolding for English Language Learners. It pairs well with a classroom weather journal or an anchor chart defining different graph types.
This worksheet provides targeted practice for CCSS.MATH.CONTENT.2.MD.D.10, requiring second graders to represent and interpret data by drawing a bar graph. Students translate qualitative text-based descriptions of weather into quantitative visual data, a foundational skill for STEM readiness. According to Fisher & Frey (2014), the use of gradual release of responsibility, where students move from guided to independent practice, strengthens skill acquisition. The activity's structure, which moves from reading distinct data points to synthesizing them in a graph, supports this cognitive processing. This cross-curricular approach provides an effective, evidence-based method for building essential data interpretation skills that are critical for success in later grades and aligned with national educational benchmarks.