


Views
Downloads
Interpreting Dot Plots Worksheet | Grade 6 Essential
Paste this activity's link or code into your existing LMS (Google Classroom, Canvas, Teams, Schoology, Moodle, etc.).
Students can open and work on the activity right away, with no student login required.
You'll still be able to track student progress and results from your teacher account.
This Interpreting Dot Plots worksheet provides comprehensive practice for middle schoolers to master data visualization. By working through real-world scenarios, learners develop the ability to extract insights from numerical data sets. This resource ensures students can identify central tendencies and variability in any plot format.
At a Glance
- Grade: 6 · Subject: Math
- Standard:
CCSS.MATH.CONTENT.6.SP.B.5— Summarize numerical data sets in relation to their context by reporting observations- Skill Focus: Interpreting and analyzing dot plots
- Format: 5 pages · 20 problems · Answer key included · PDF
- Best For: Independent practice and formative data assessment
- Time: 30–45 minutes
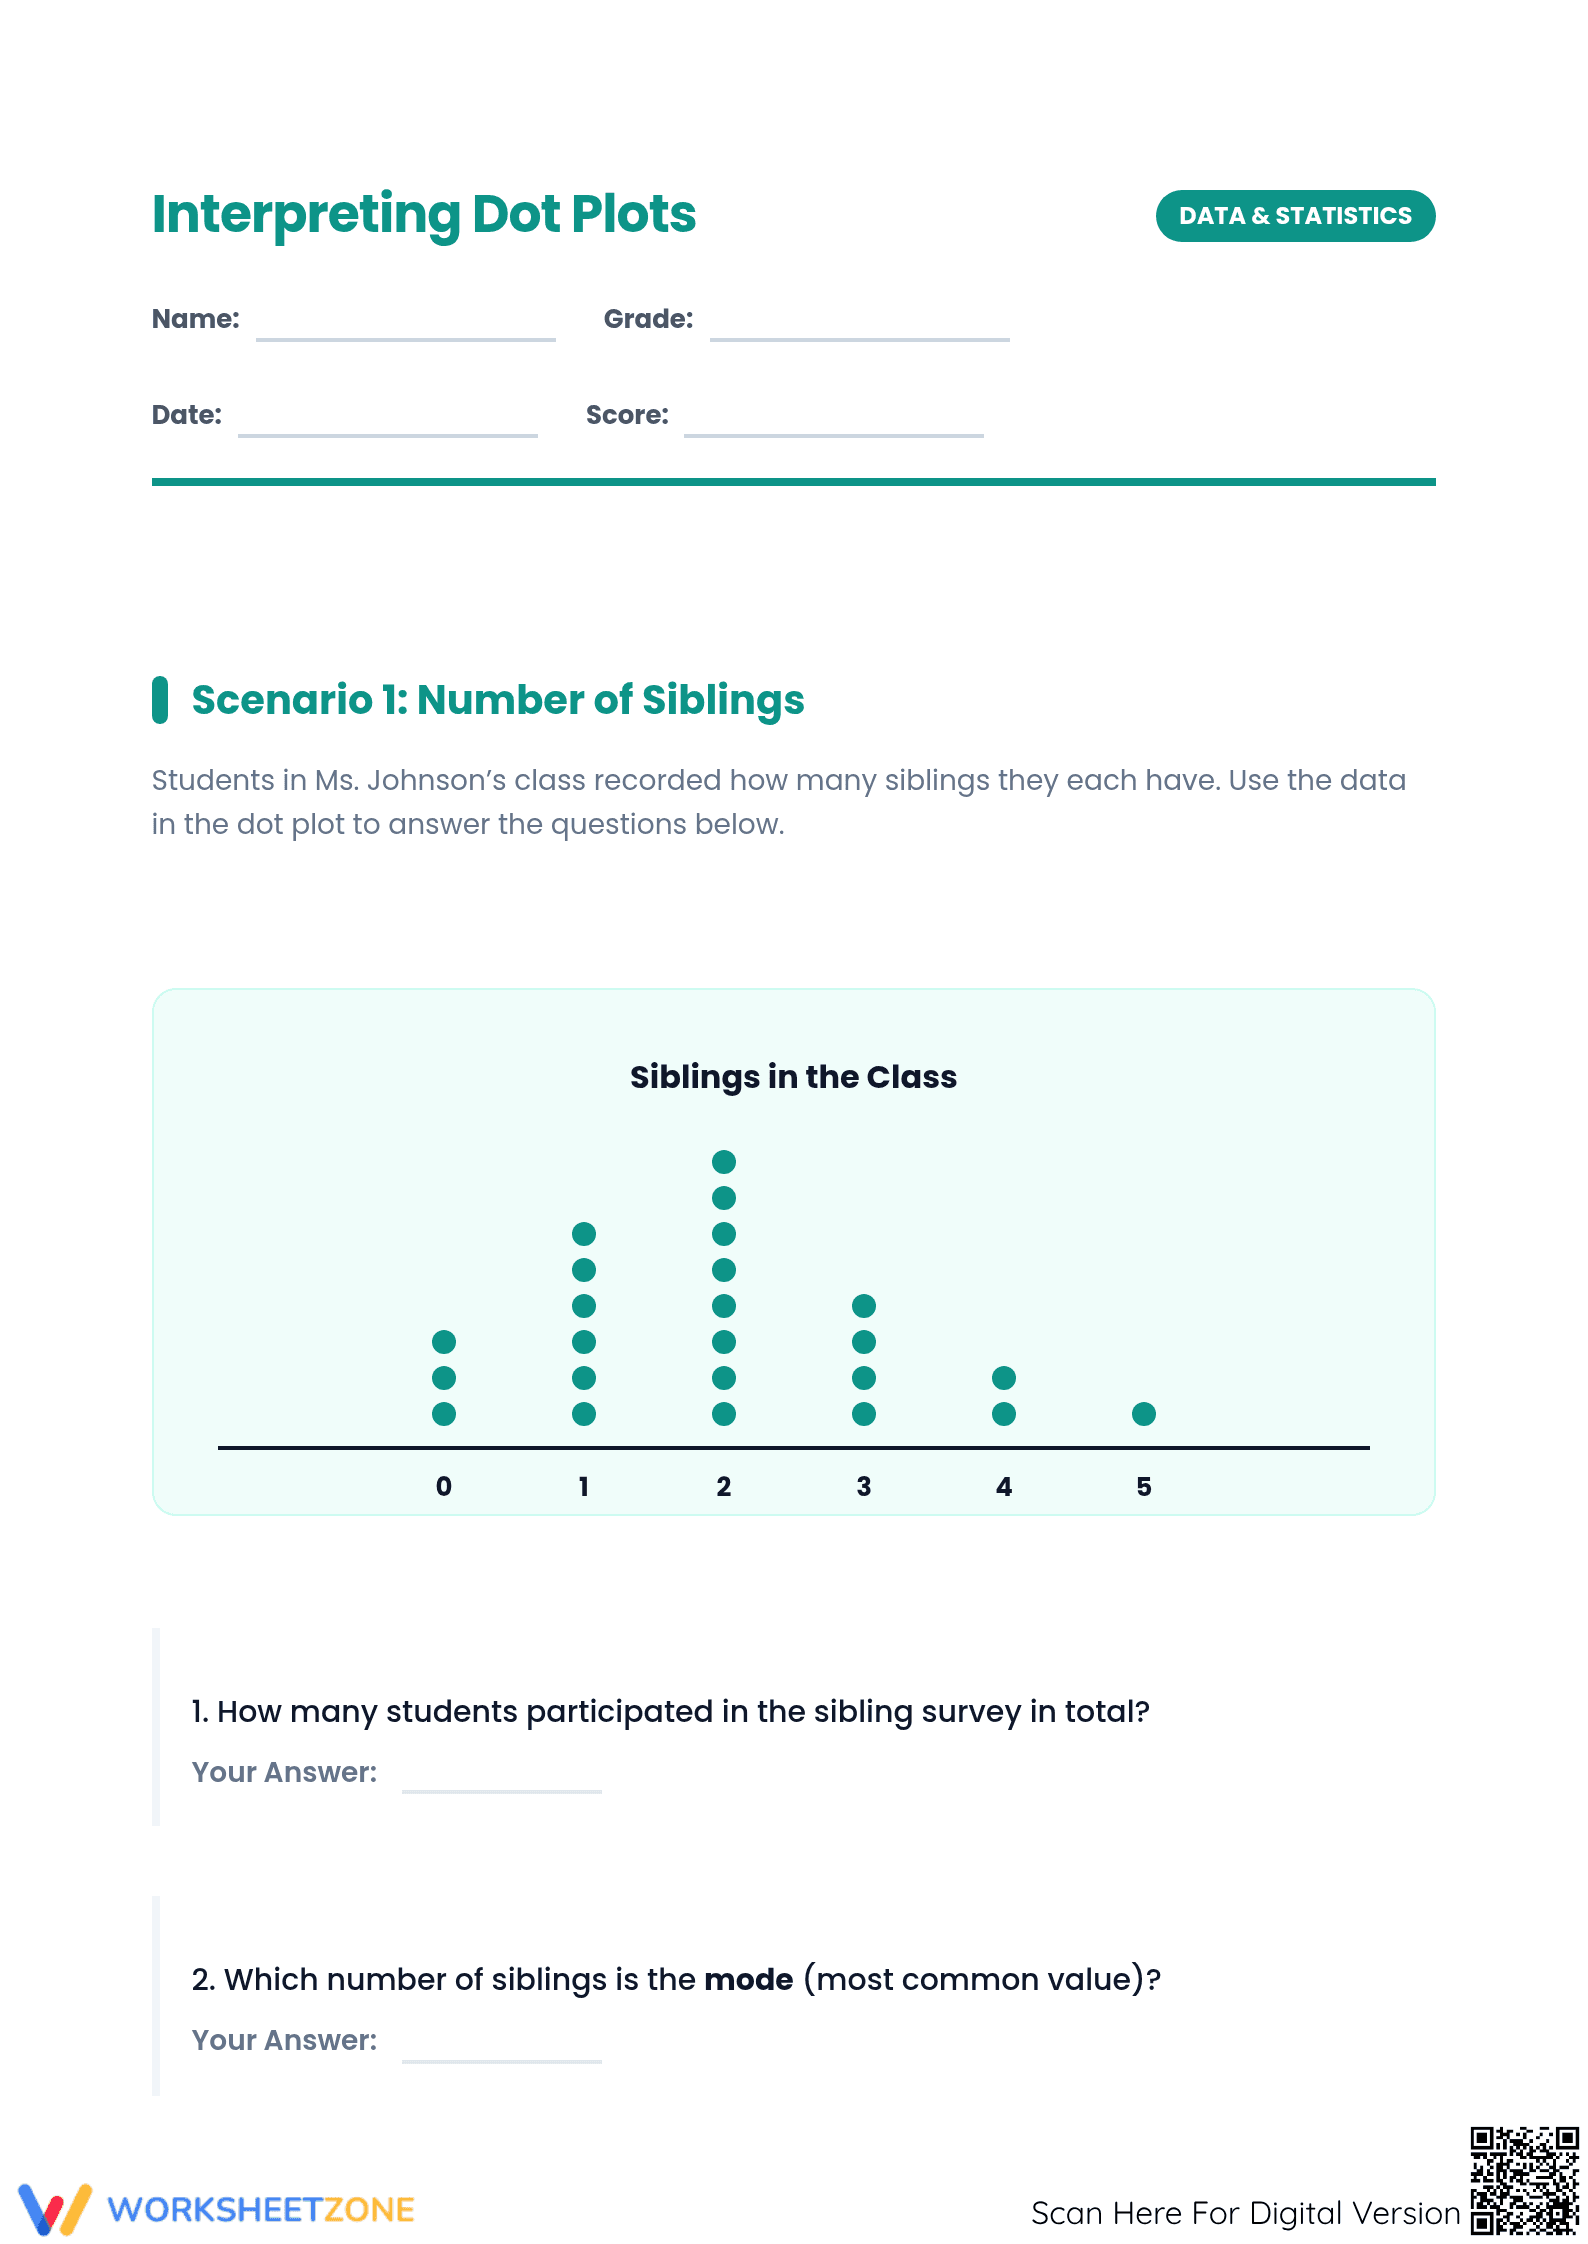
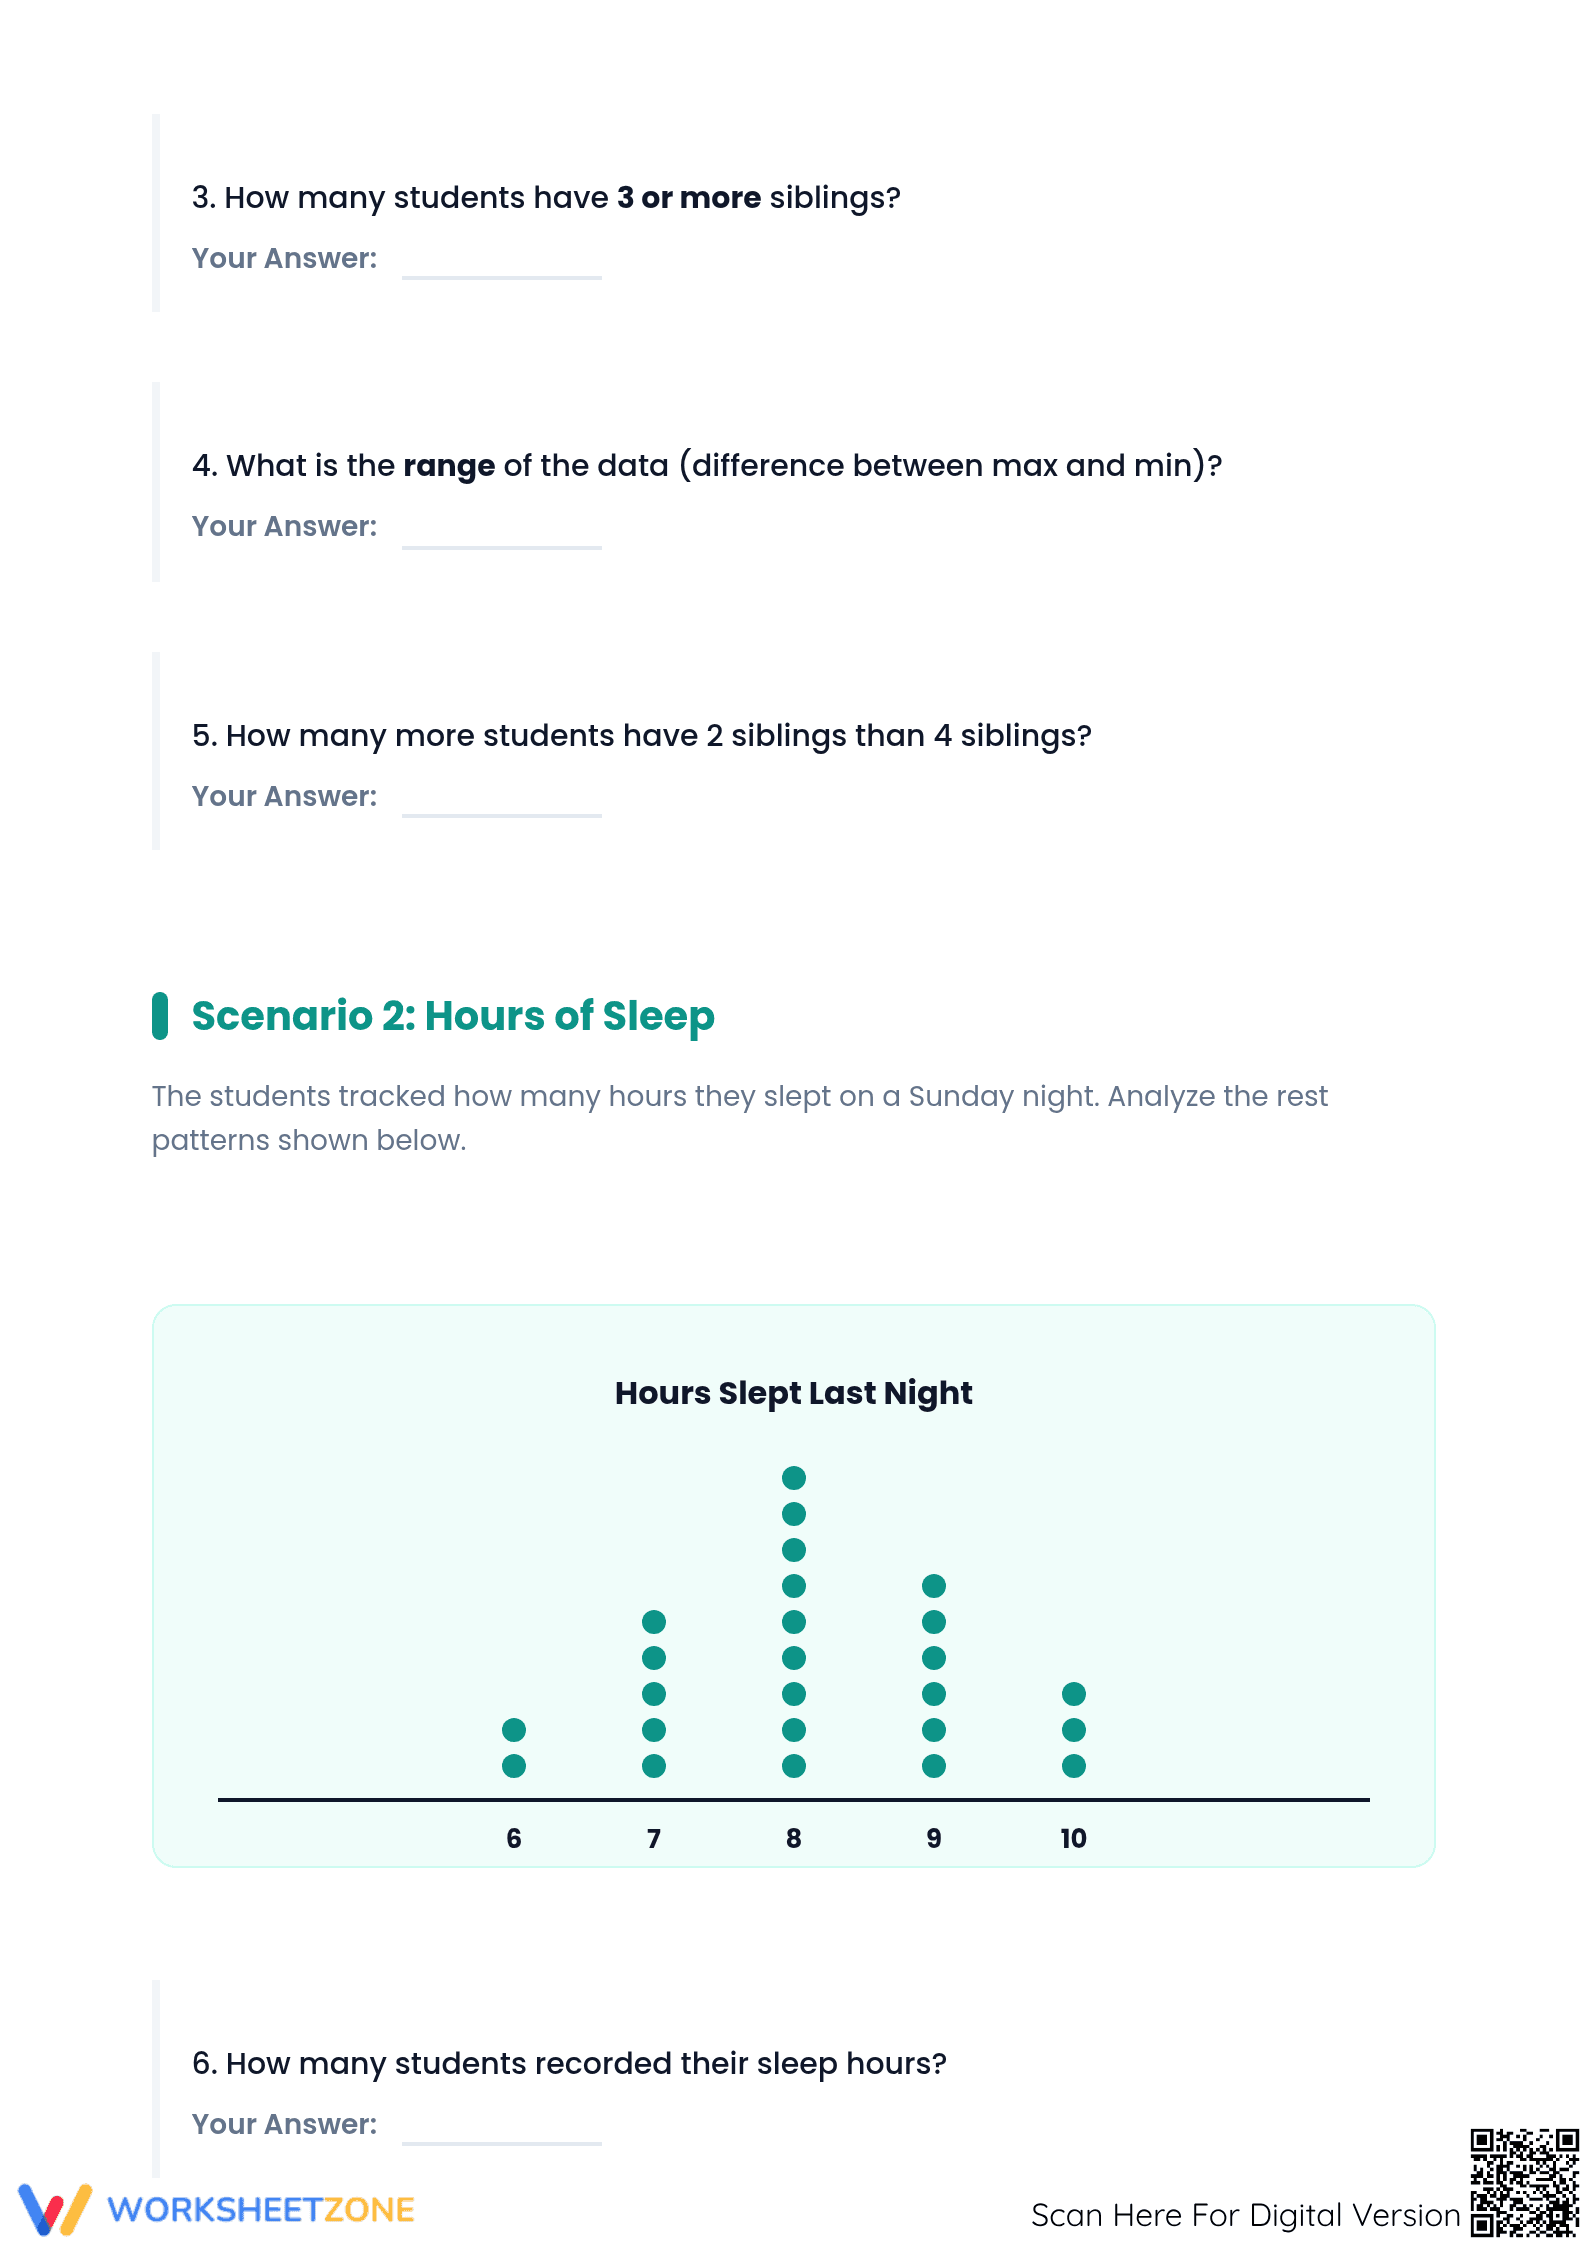
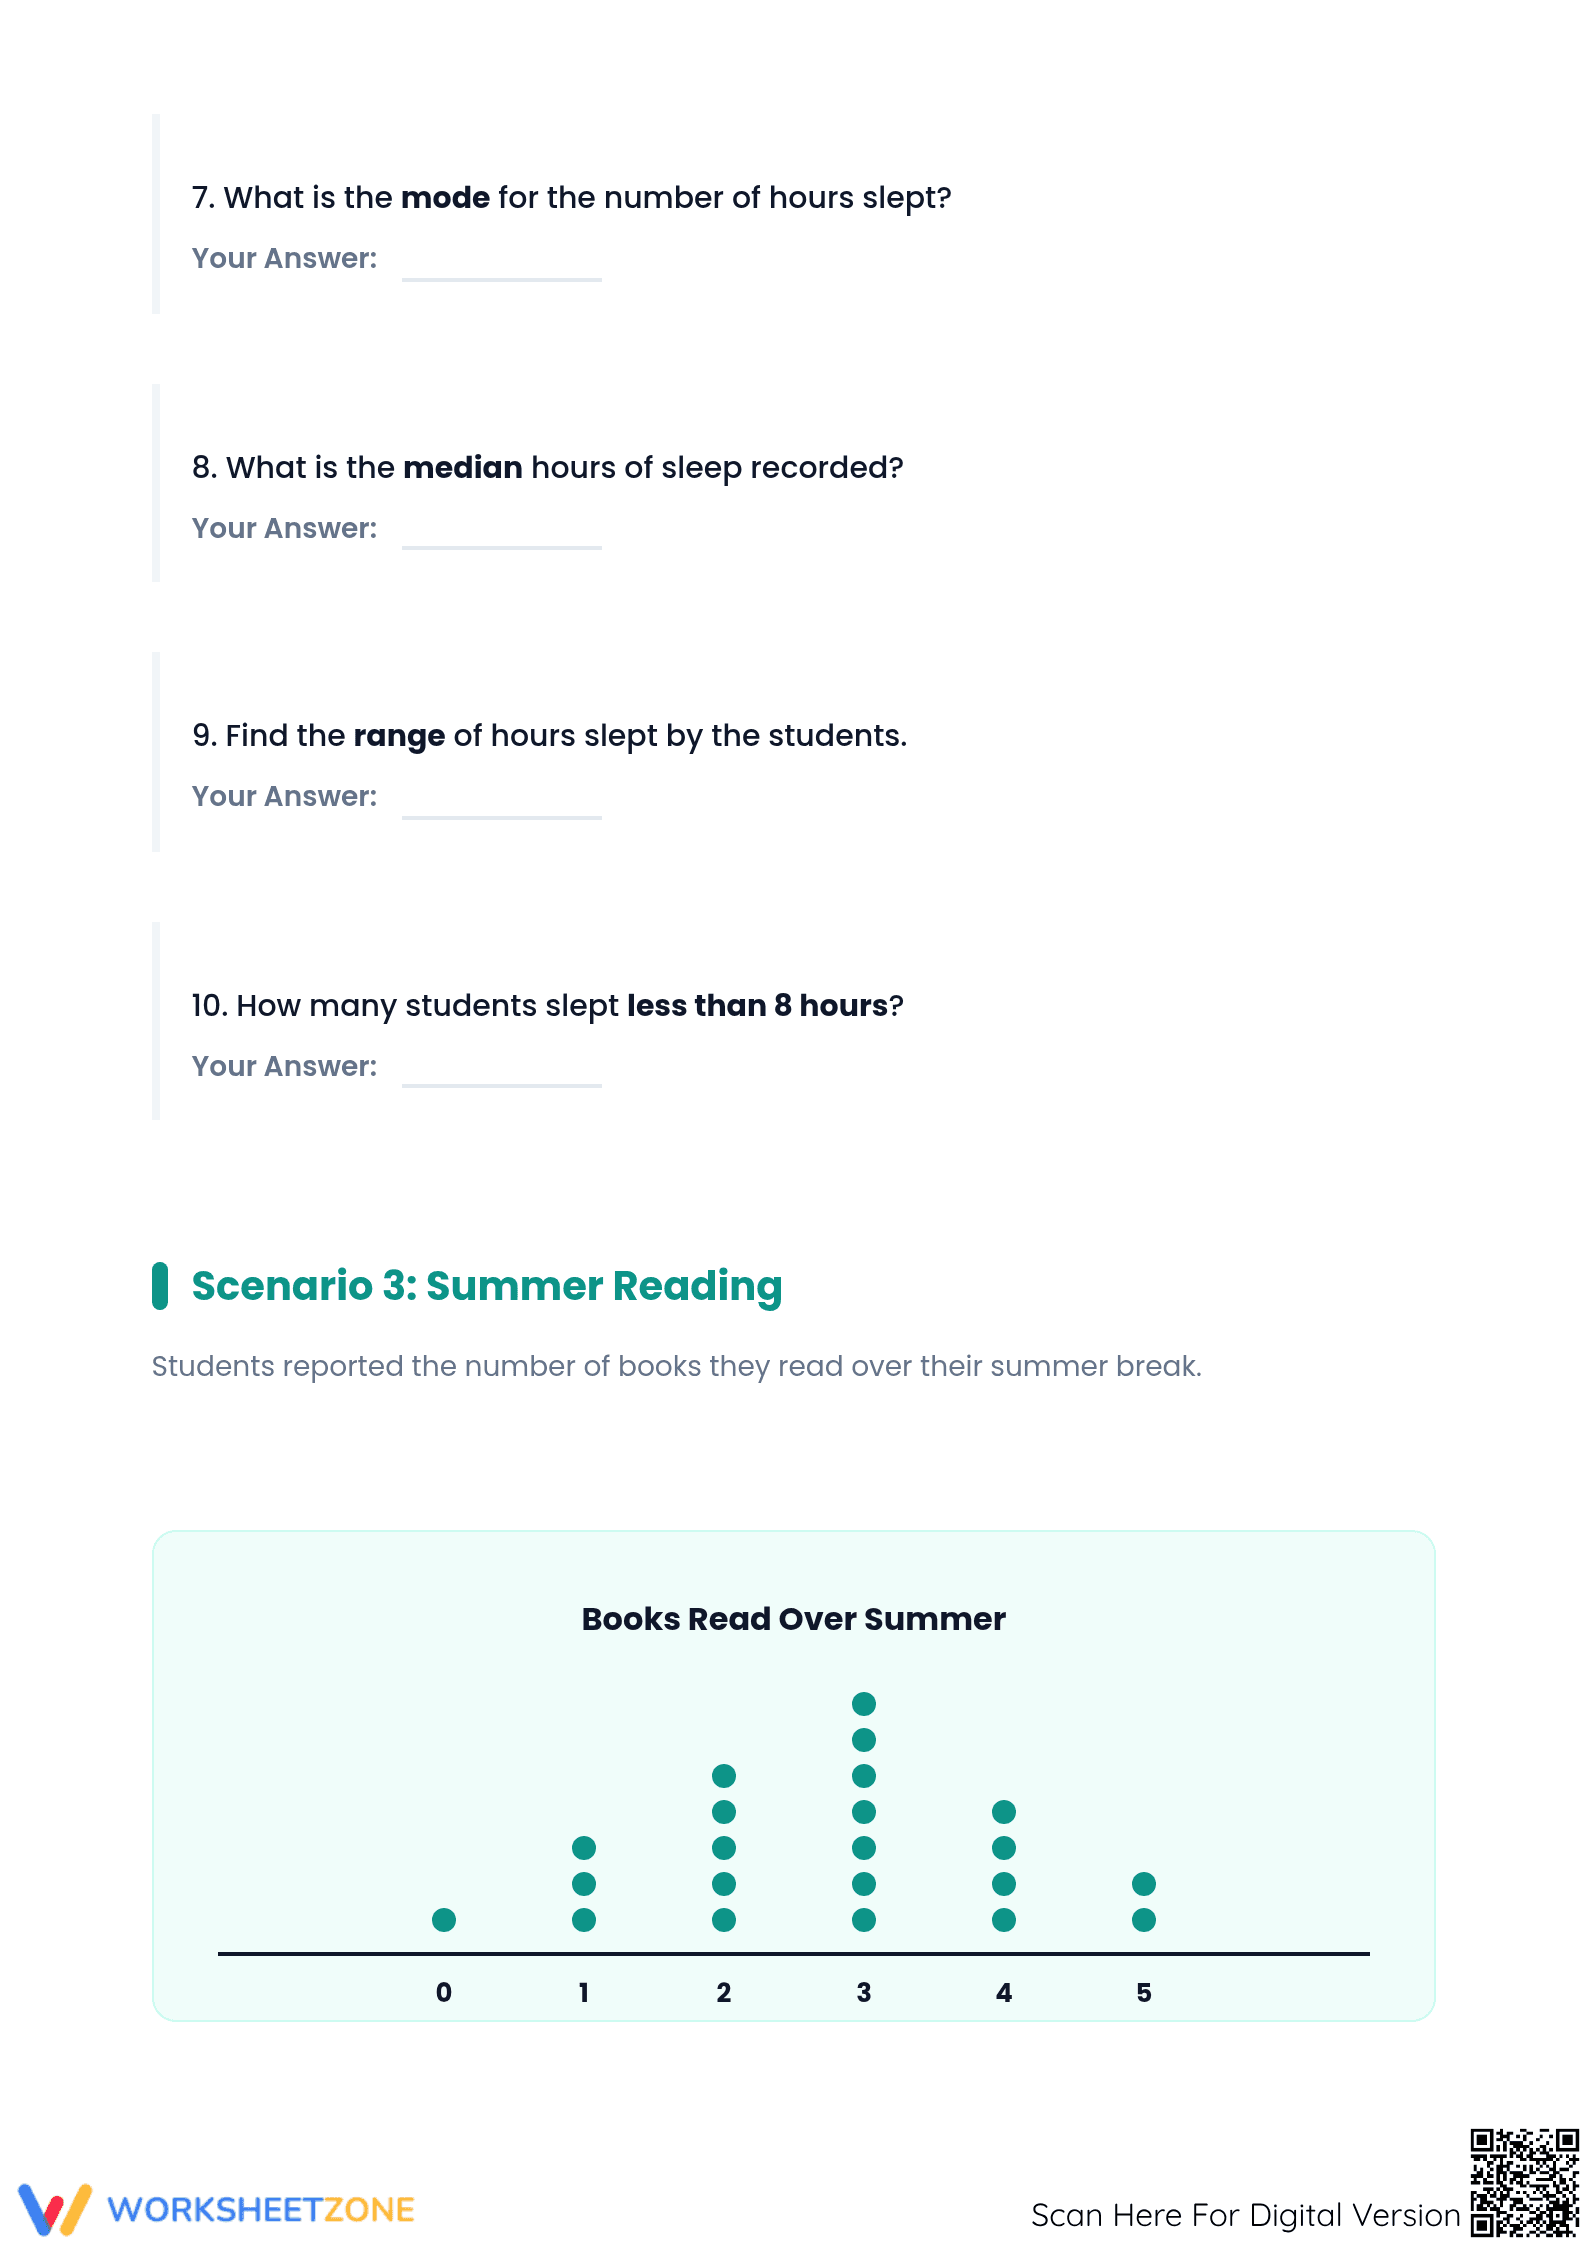
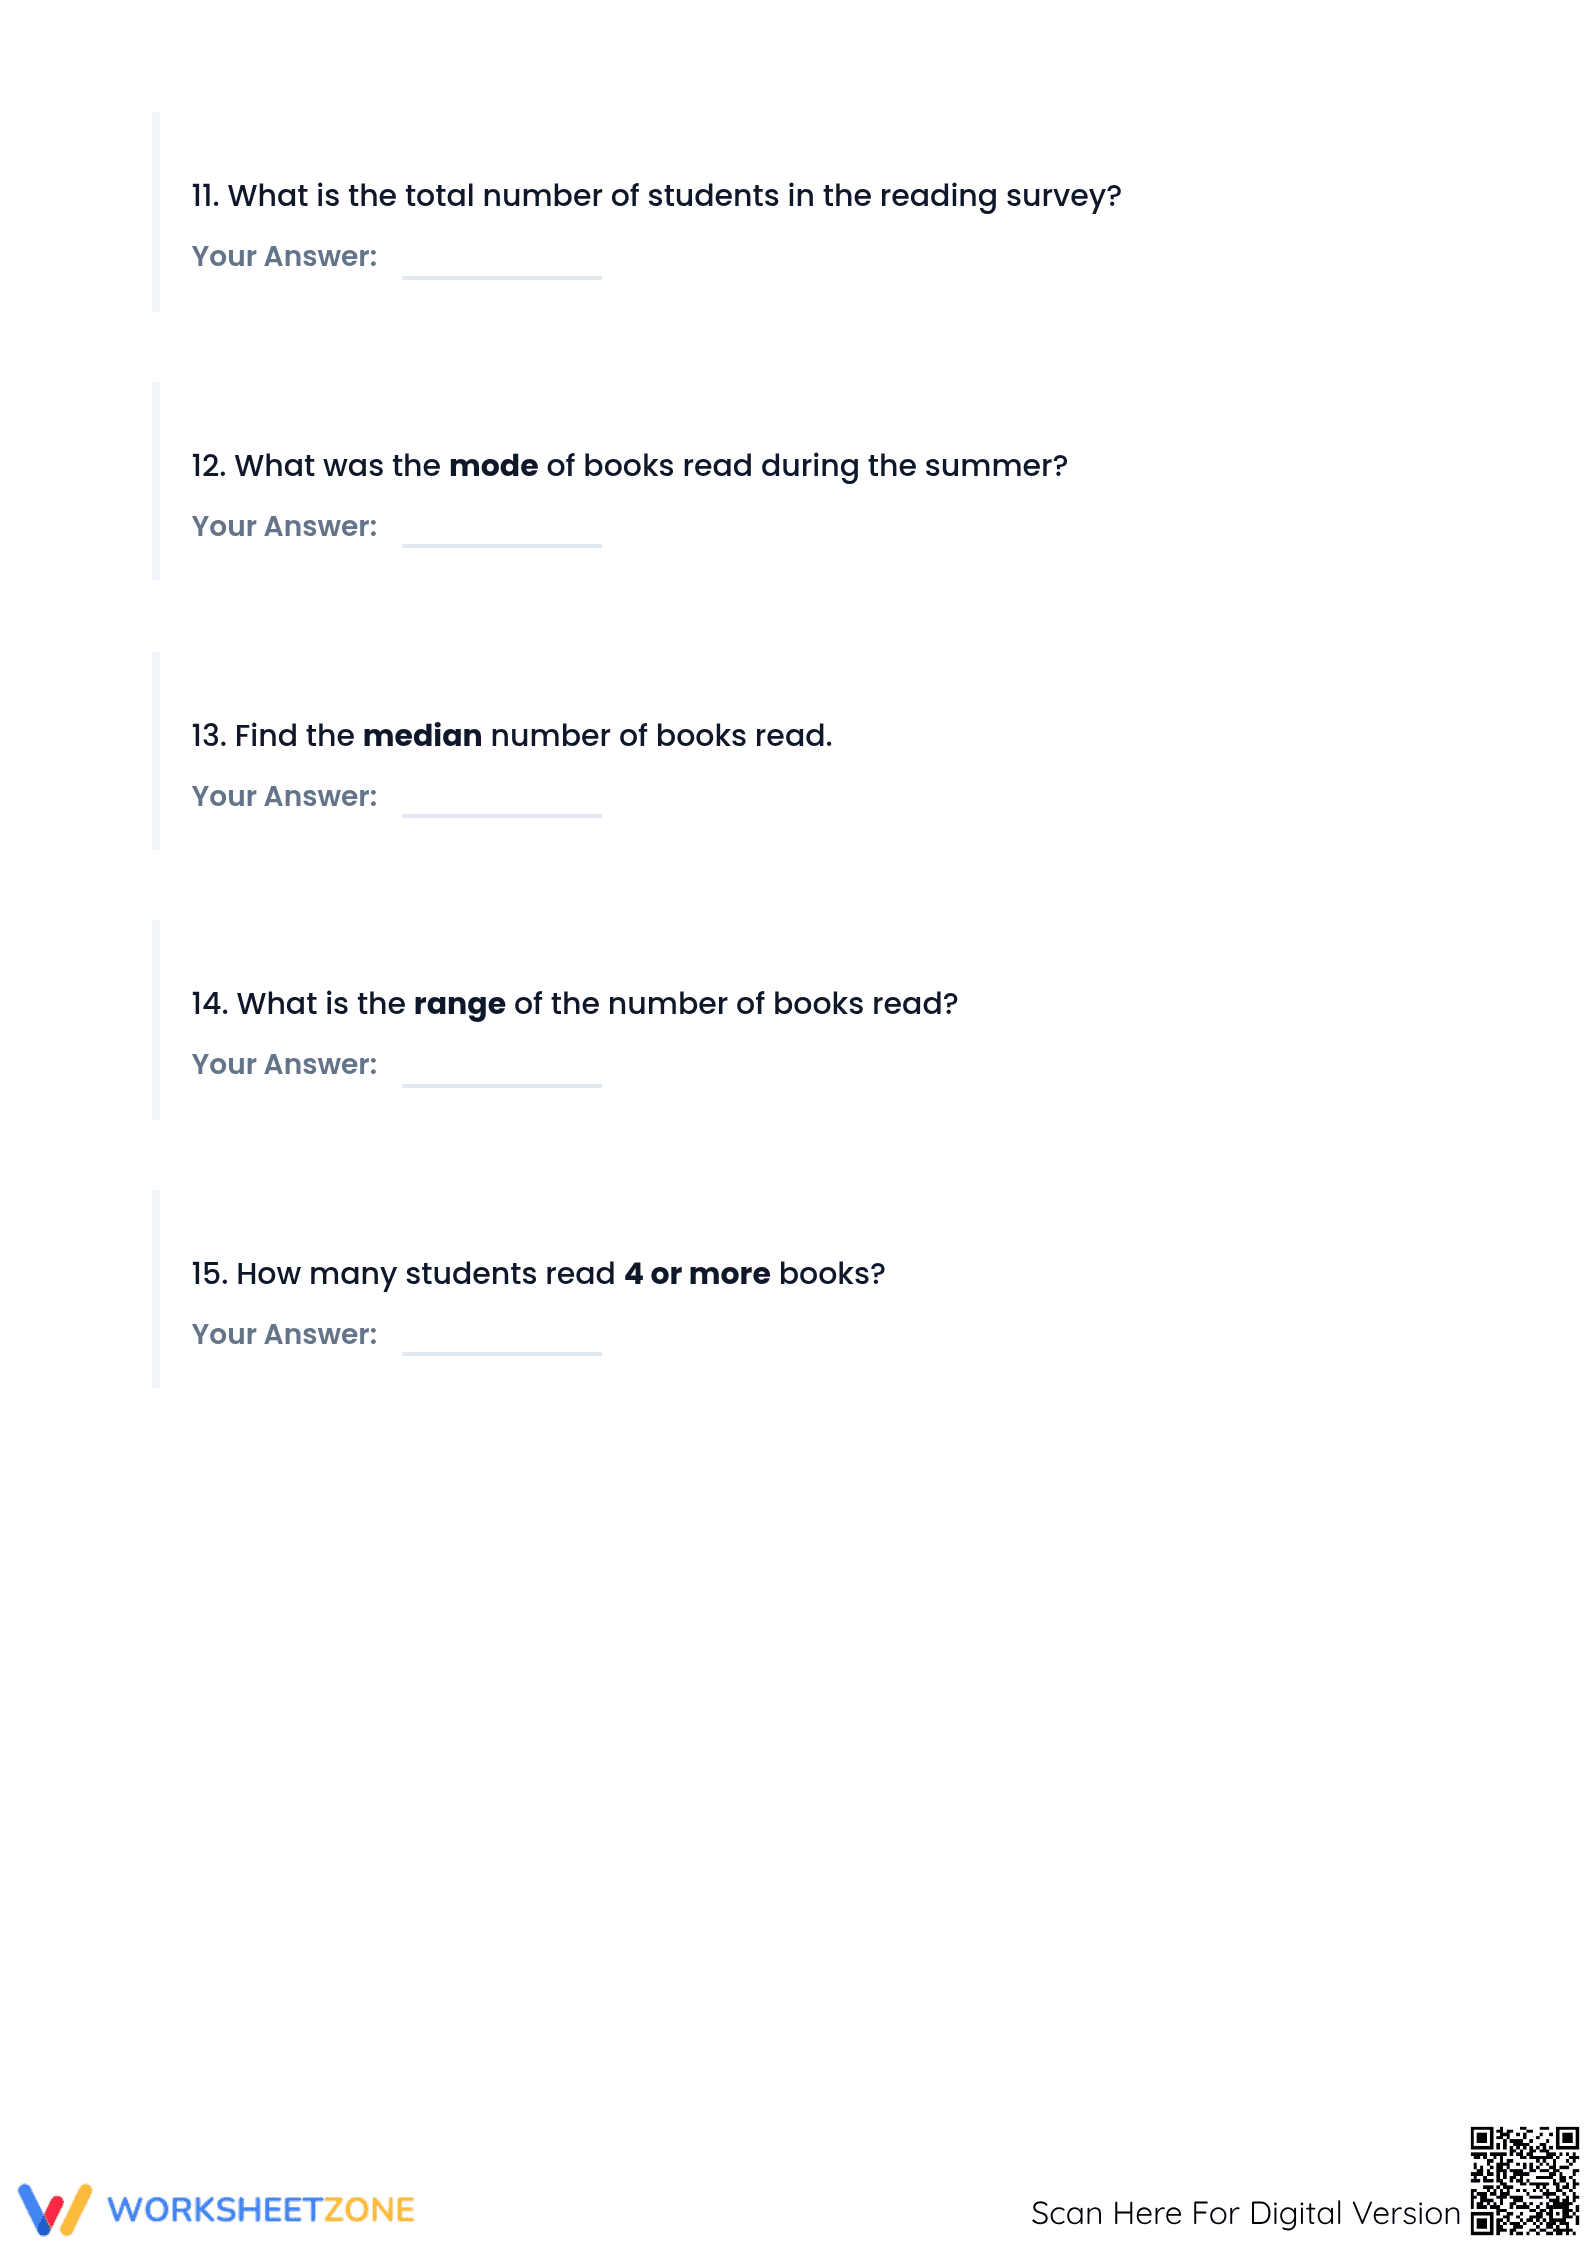
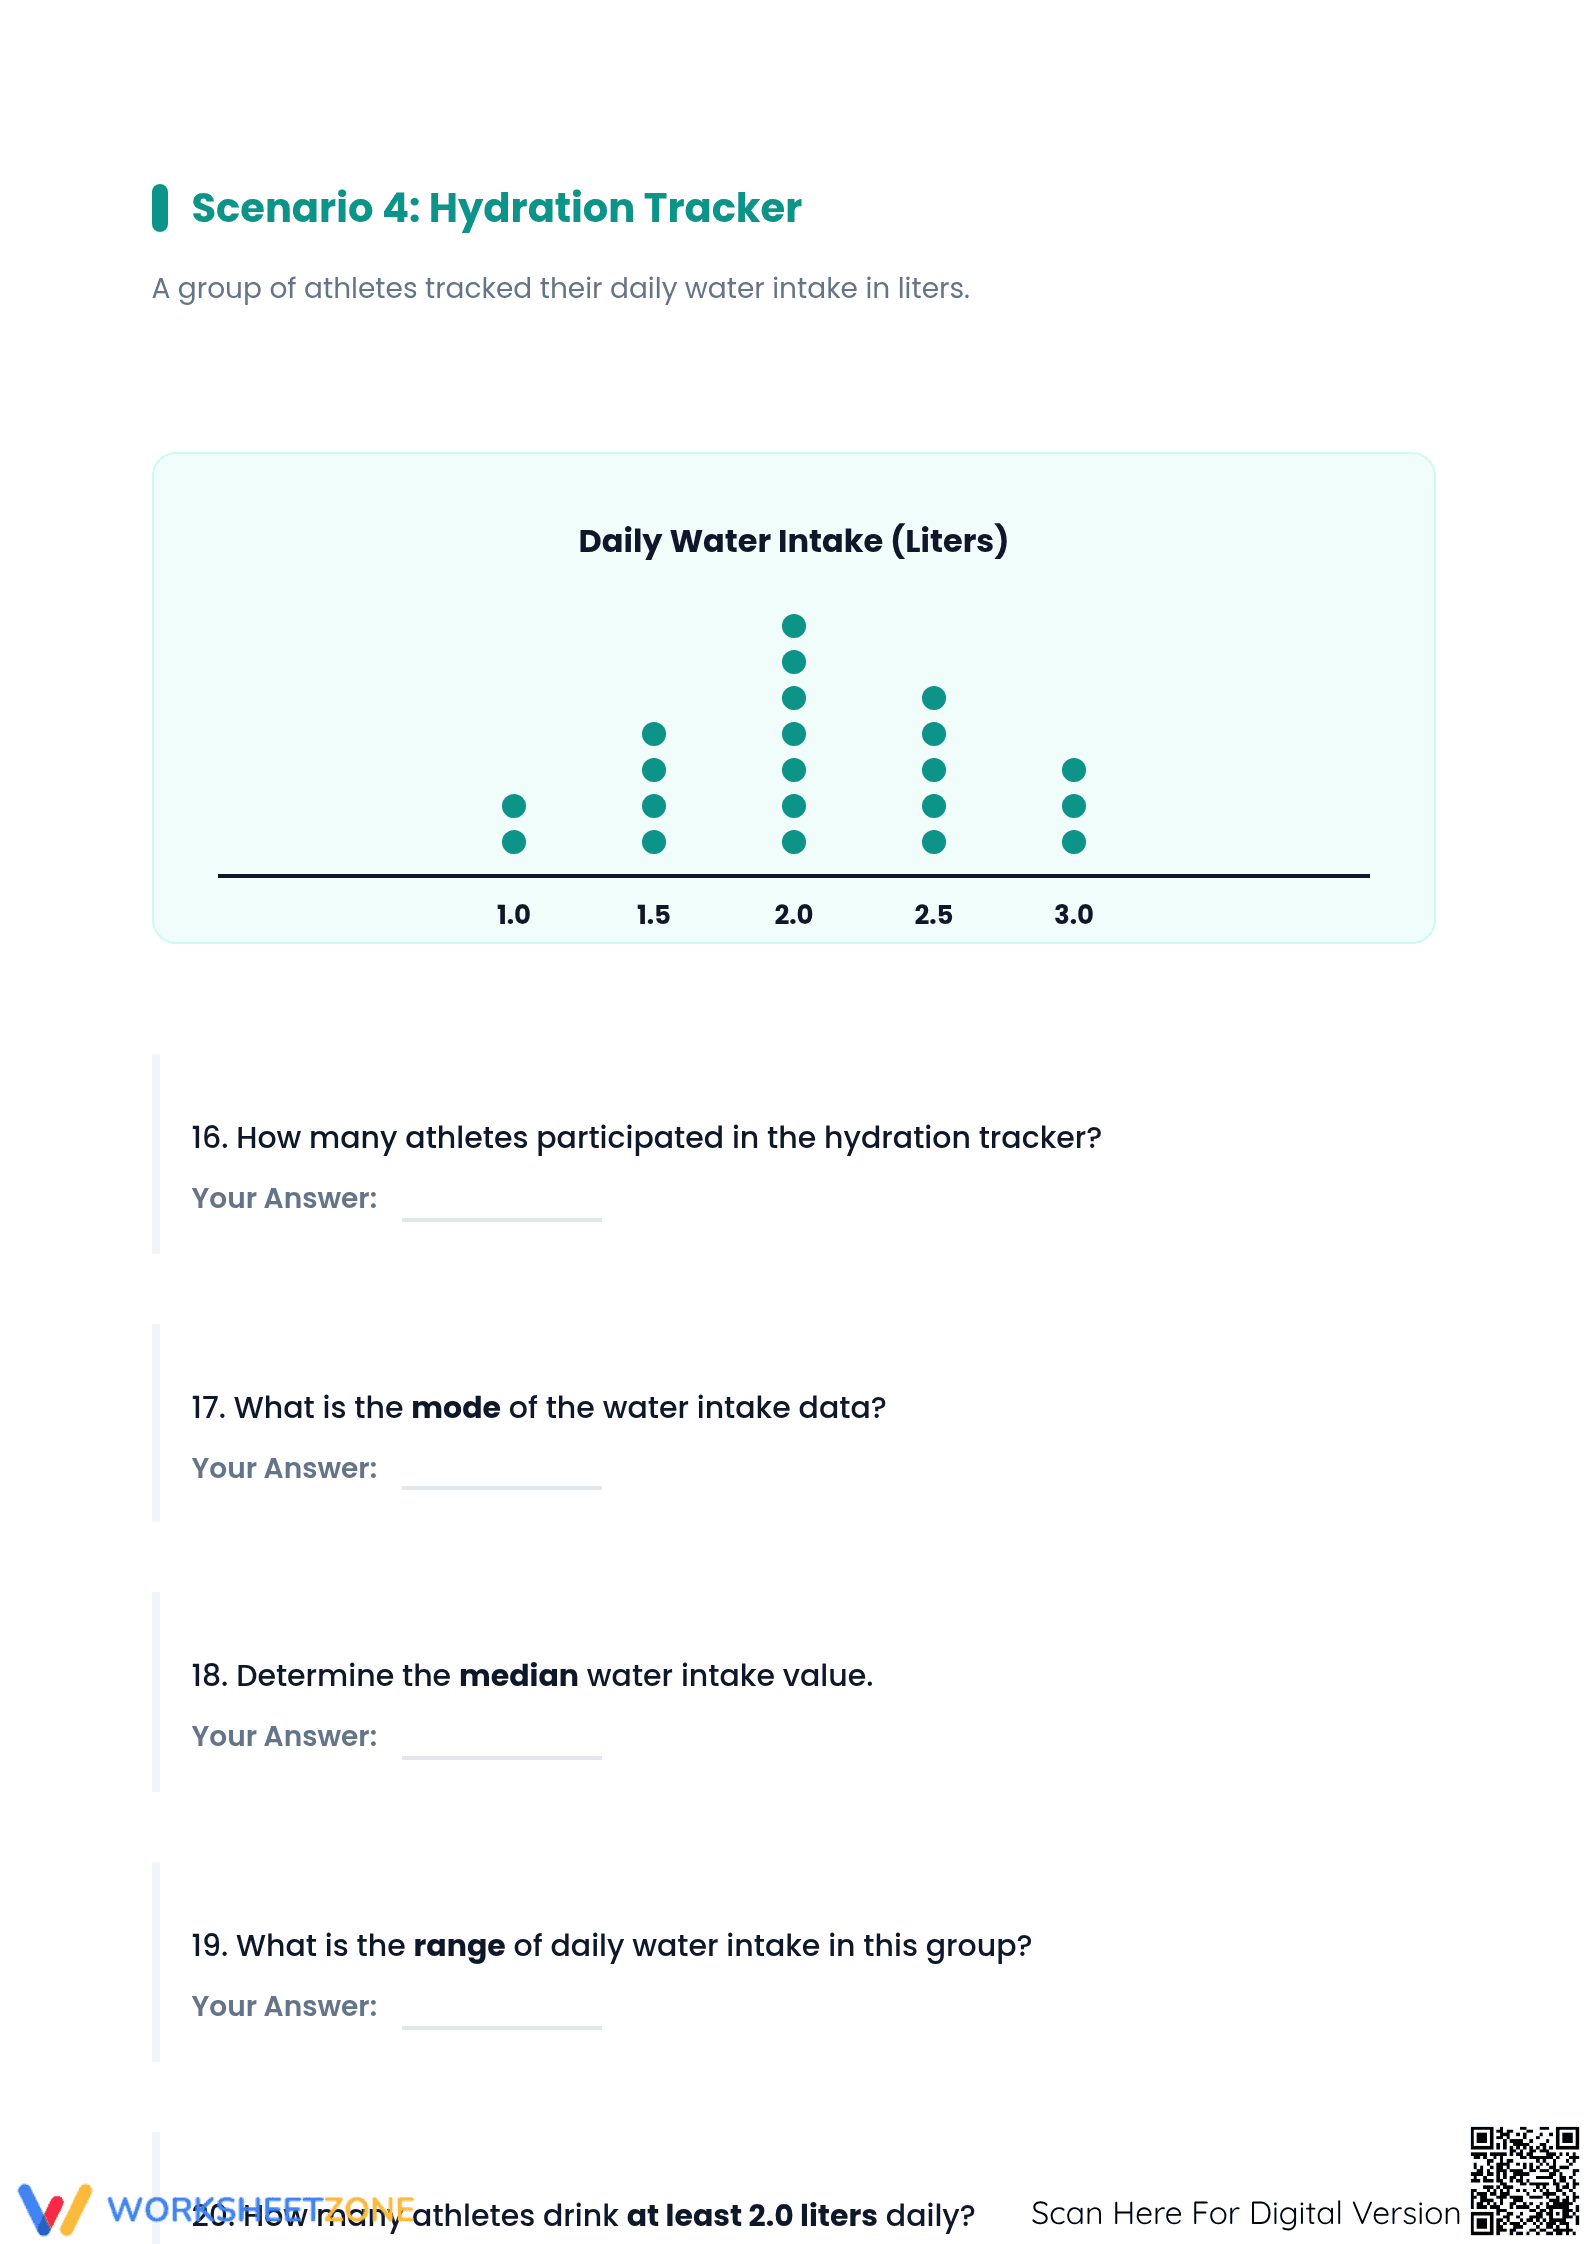
The PDF contains five pages featuring four data scenarios: Number of Siblings, Hours of Sleep, Summer Reading, and a Hydration Tracker. Each scenario presents a dot plot followed by five targeted questions. Students calculate the mode, median, and range, and interpret specific points. A complete answer key is provided for immediate feedback and grading efficiency.
- Guided practice: Scenario 1 (5 tasks) uses small whole numbers to build confidence in reading plot frequency and identifying the mode.
- Supported practice: Scenarios 2 and 3 (10 tasks total) introduce larger sets, requiring a systematic approach to ordering values for calculating the median.
- Independent practice: The final Hydration Tracker (5 tasks) uses decimals, challenging students to apply statistical knowledge to complex numerical data.
This progression follows a gradual-release model, moving from basic recognition to higher-order statistical summary. Total problems include 20 unique items across the set.
Standards Alignment
CCSS.MATH.CONTENT.6.SP.B.5 states students should summarize numerical data sets in relation to their context by reporting observations. This worksheet focuses on critical Grade 6 skills: determining mode, median, and range within contextualized scenarios. Teachers can use these tasks to verify mastery of data variability. This standard code can be copied directly into lesson plans, IEP goals, or district curriculum mapping tools.
How to Use It
Deploy this worksheet during the independent practice phase of a statistics lesson to gauge mastery. It serves as an excellent formative assessment; teachers can scan answers for median questions to identify misconceptions about middle-value calculation. Students should finish the 20-question set within 45 minutes, though it works well as four separate 10-minute sessions.
Who It's For
This resource is designed for Grade 6, but works for Grade 5 enrichment or Grade 7-8 review. It is effective for students who benefit from visual data. Pair this with a hands-on activity where students collect class data to create their own plots before completing these printed interpretations for a blended learning approach.
Statistical literacy is a foundational requirement for secondary mathematics, and dot plots serve as the gateway for students to understand frequency distribution. According to the NAEP framework, the ability to summarize data using measures of center and spread is a key indicator of mathematical proficiency in the middle grades. This worksheet specifically addresses the cognitive demands of identifying patterns, which are essential for success in algebra. By focusing on the CCSS.MATH.CONTENT.6.SP.B.5 standard, educators provide students with the high-quality practice needed to internalize the relationship between data points and visual representation. Research from ScienceDirect TpT Analysis indicates that contextualized data sets significantly improve student engagement and retention of statistical concepts compared to abstract number lists. This resource bridges that gap by offering four relatable scenarios that ground math in reality.