


Views
Downloads
Printable Dot Plots Worksheet | Grade 6 Math Essential
Paste this activity's link or code into your existing LMS (Google Classroom, Canvas, Teams, Schoology, Moodle, etc.).
Students can open and work on the activity right away, with no student login required.
You'll still be able to track student progress and results from your teacher account.
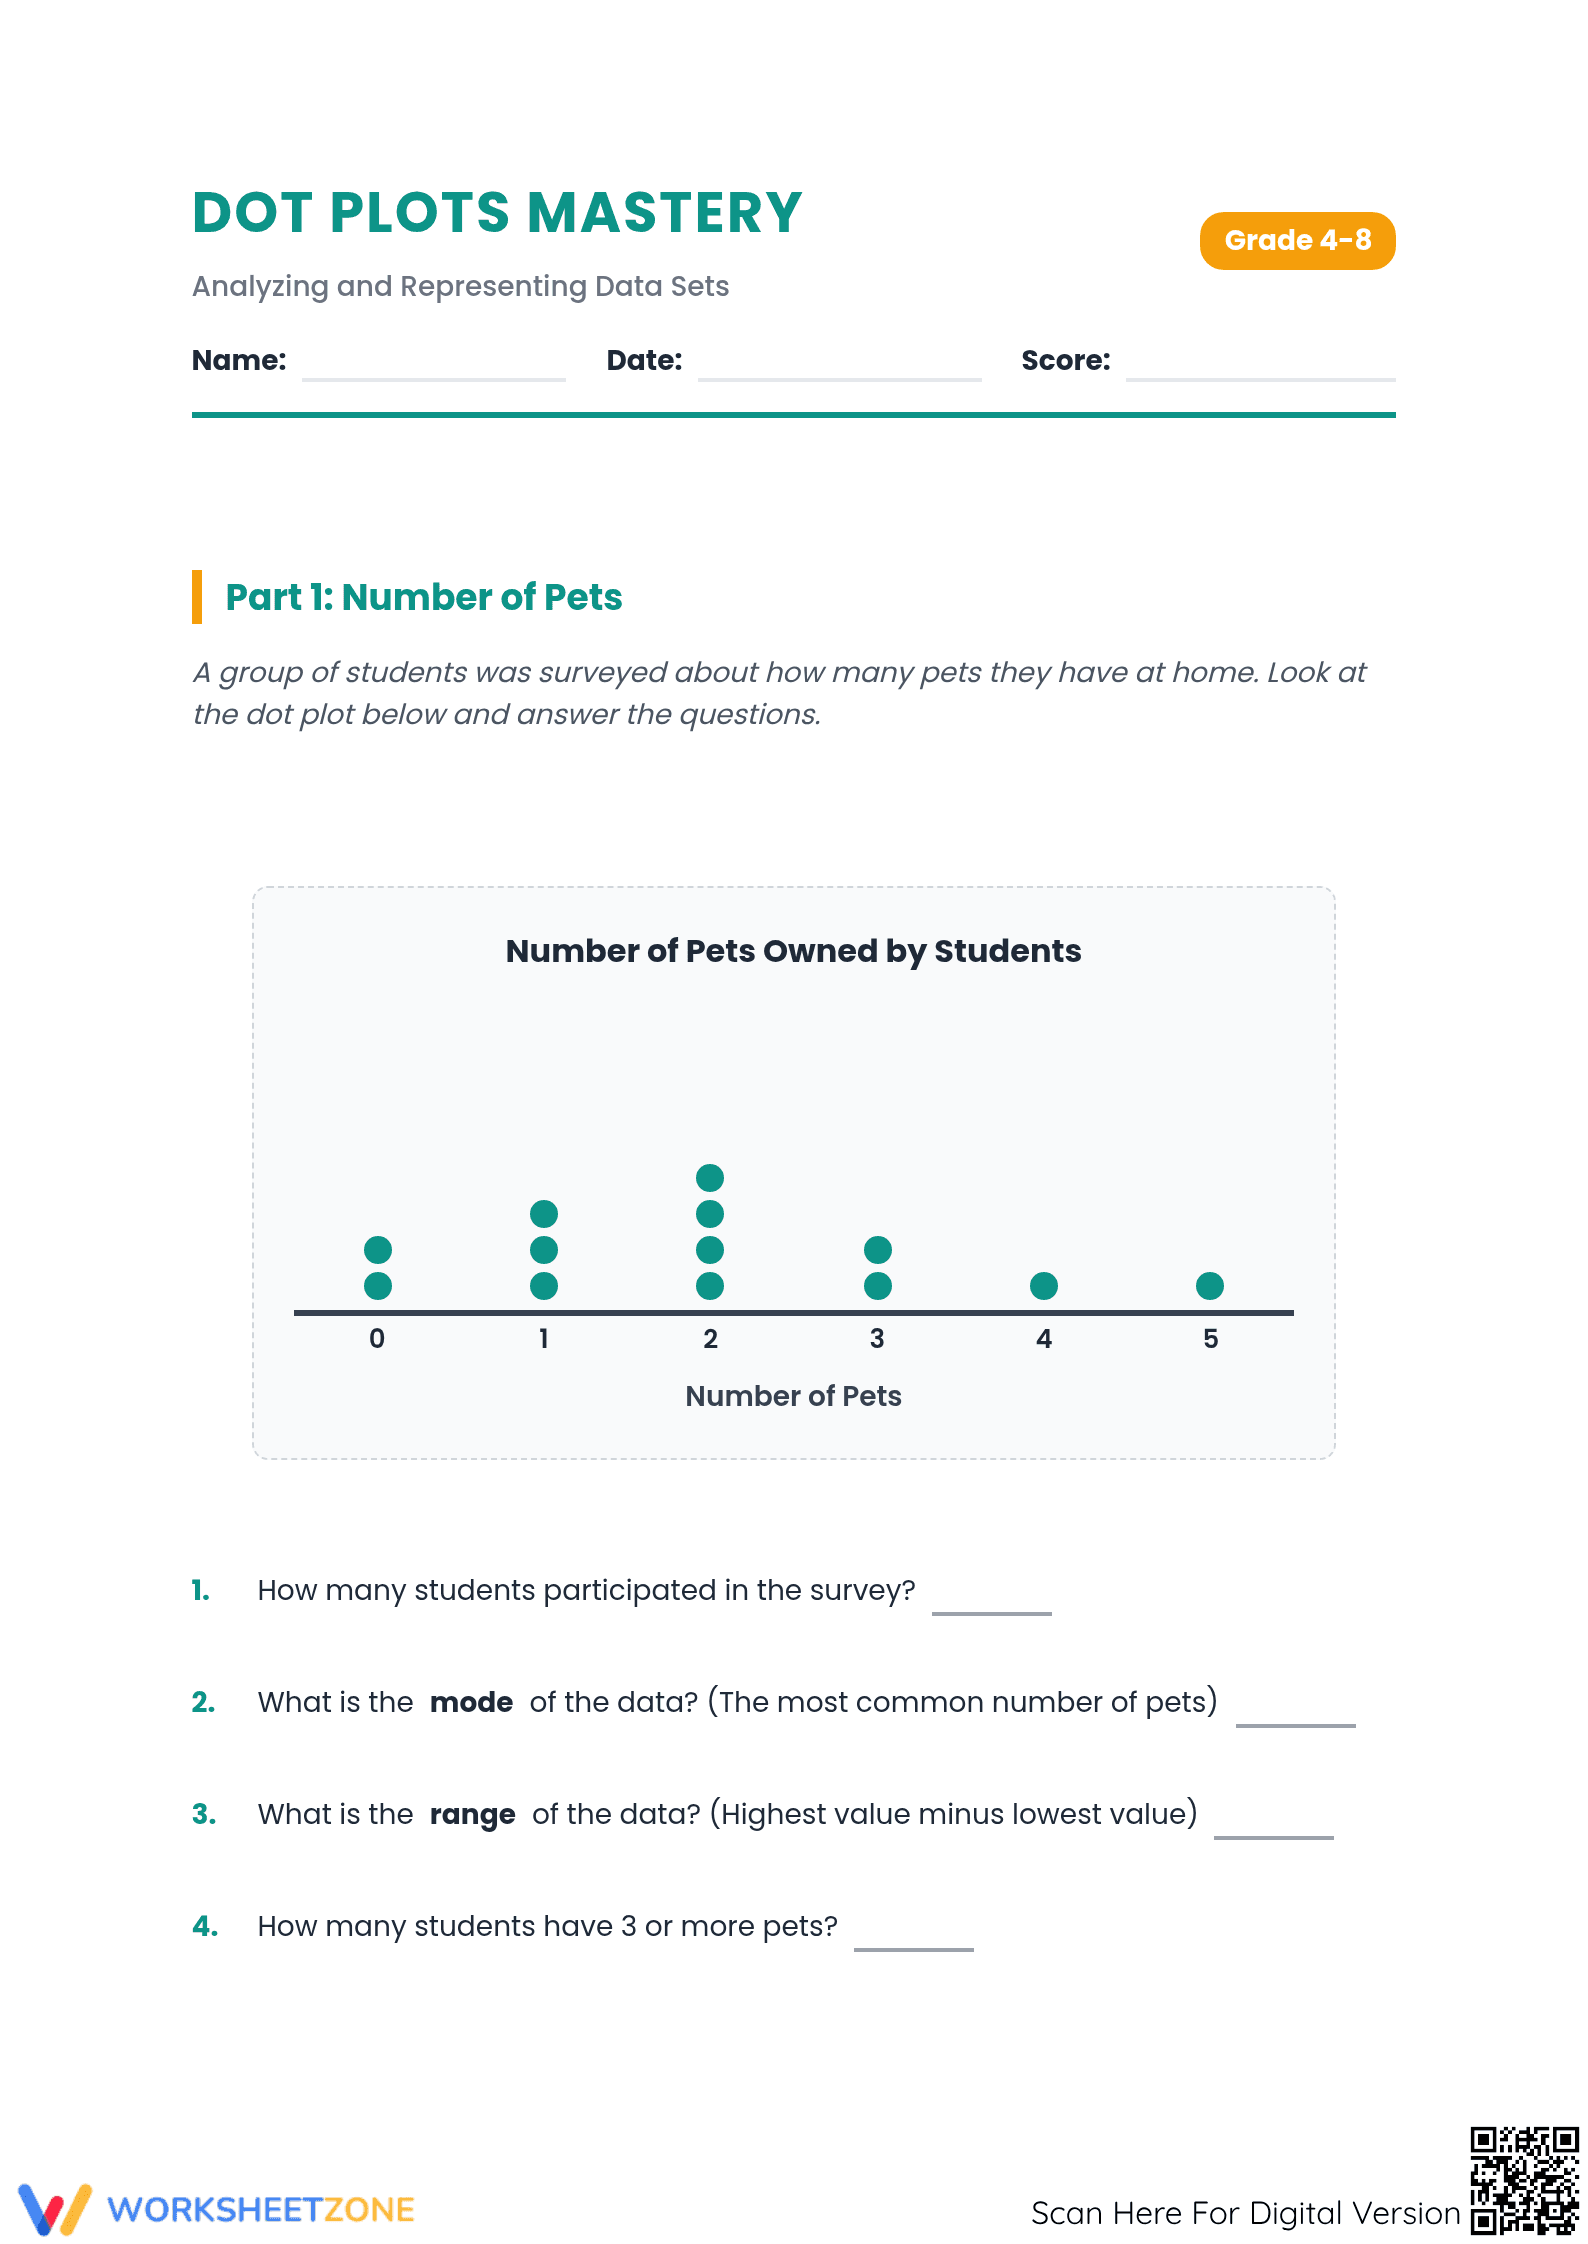
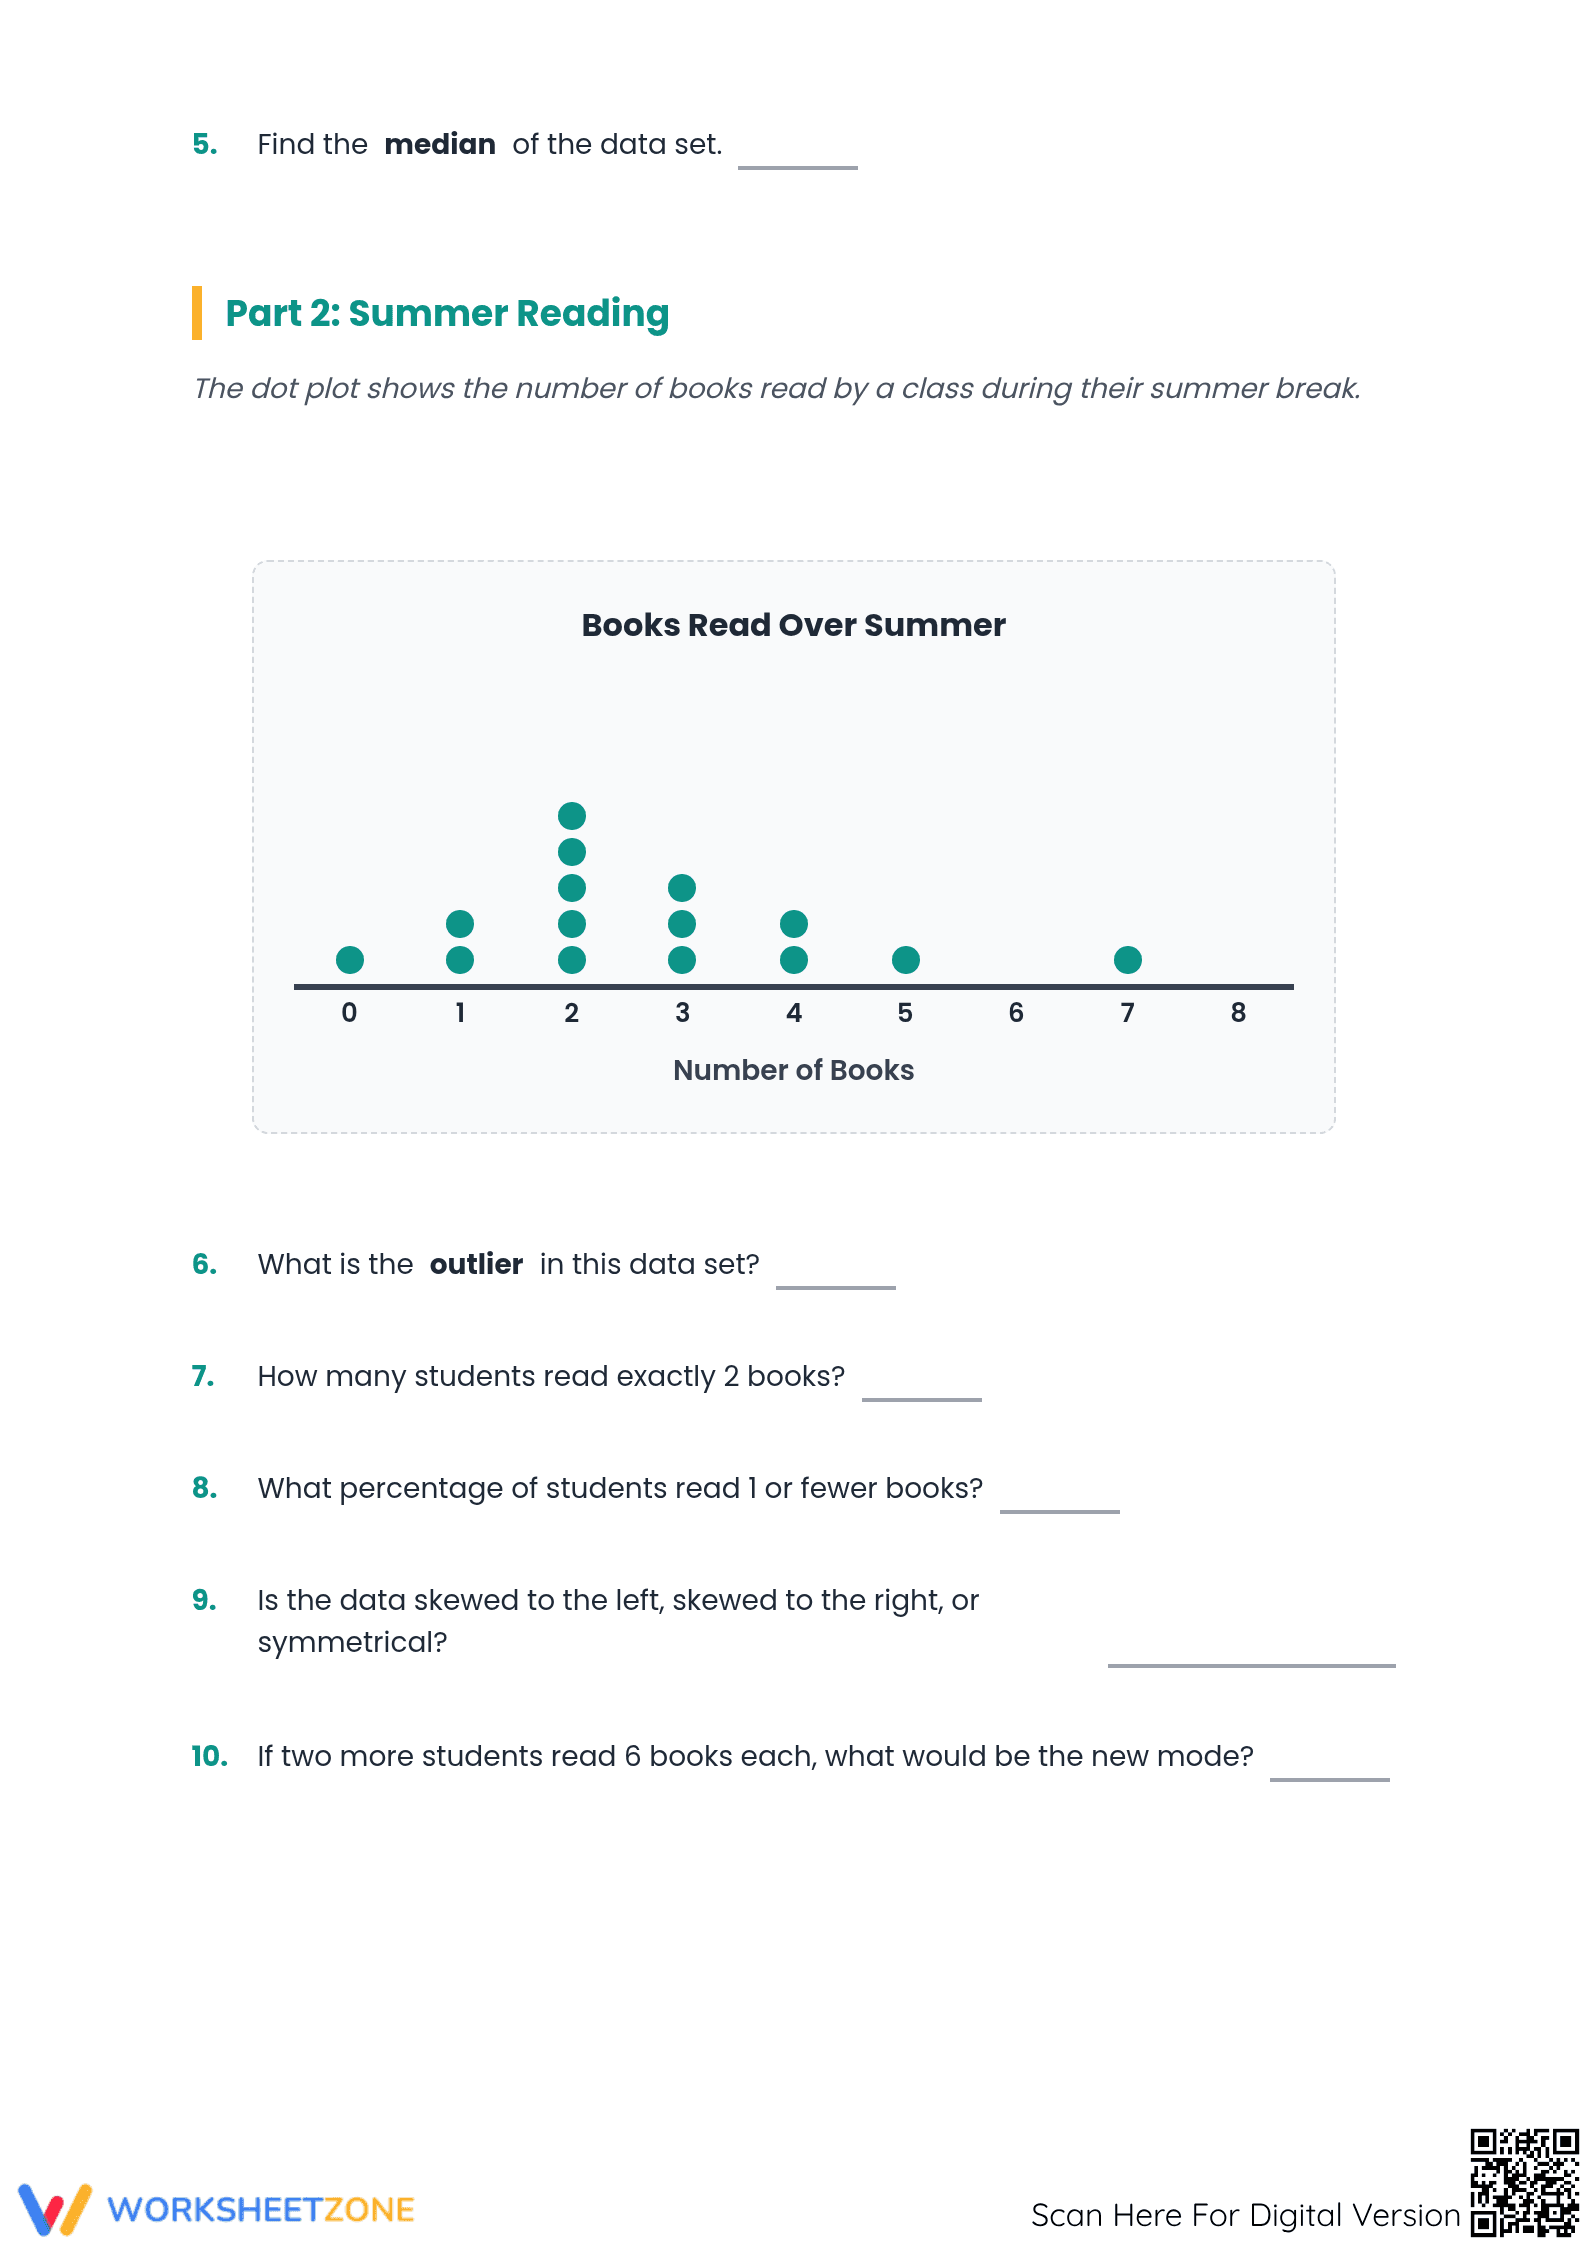
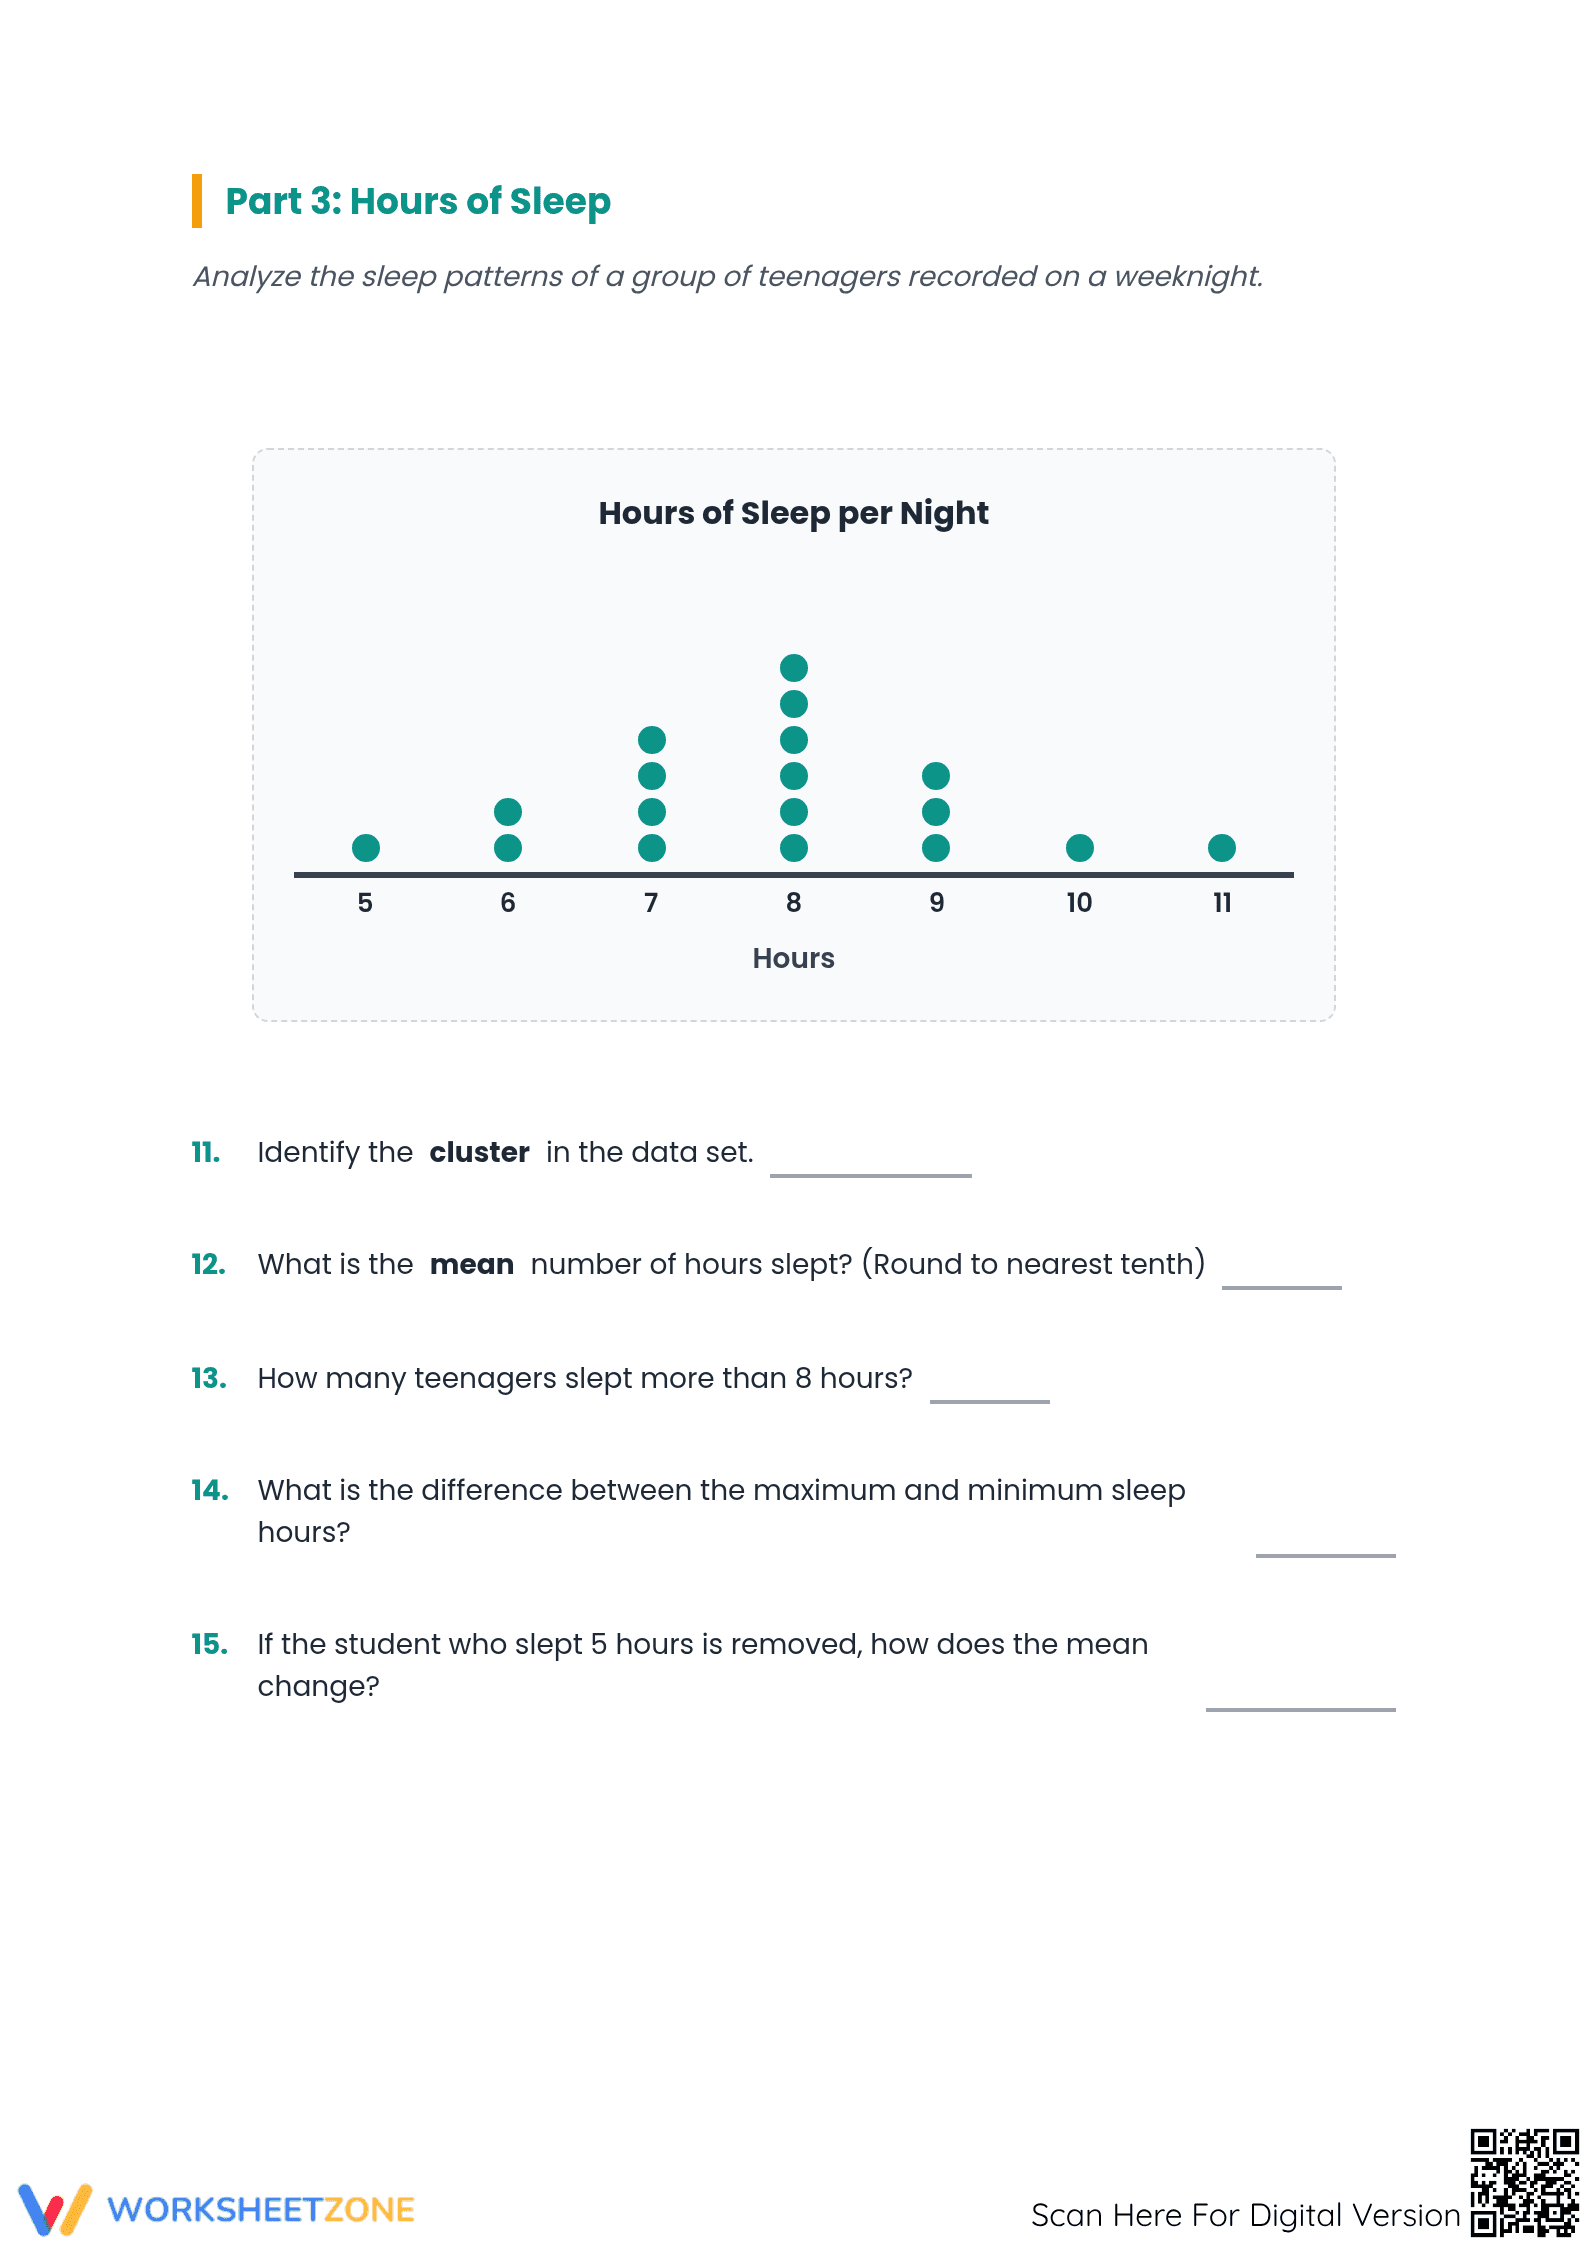
This comprehensive Dot Plots Mastery worksheet provides students with a rigorous framework for analyzing and representing numerical data sets. By engaging with real-world scenarios including pet ownership, summer reading, and sleep patterns, learners develop the critical ability to extract statistical insights from visual distributions while building technical proficiency in data construction.
At a Glance
- Grade: 6 · Subject: Math
- Standard:
CCSS.MATH.CONTENT.6.SP.B.4— Display numerical data in plots on a number line, including dot plots- Skill Focus: Data Analysis and Visualization
- Format: 4 pages · 20 problems · Answer key included · PDF
- Best For: Independent practice or formative assessment
- Time: 30–45 minutes
What's Inside: This four-page resource features three distinct sections of data interpretation followed by a hands-on creation task. Students work through 20 structured problems that require identifying clusters, outliers, and gaps, calculating measures of center, and describing distribution shapes. A complete answer key is provided to facilitate rapid feedback and student self-correction.
Skill Progression
- Guided Analysis: Initial tasks provide pre-constructed dot plots with direct questions to build confidence in reading frequency values and identifying basic modes.
- Supported Interpretation: Middle sections introduce complex statistical concepts such as skewed distributions, outliers, and the impact of data removal on the mean.
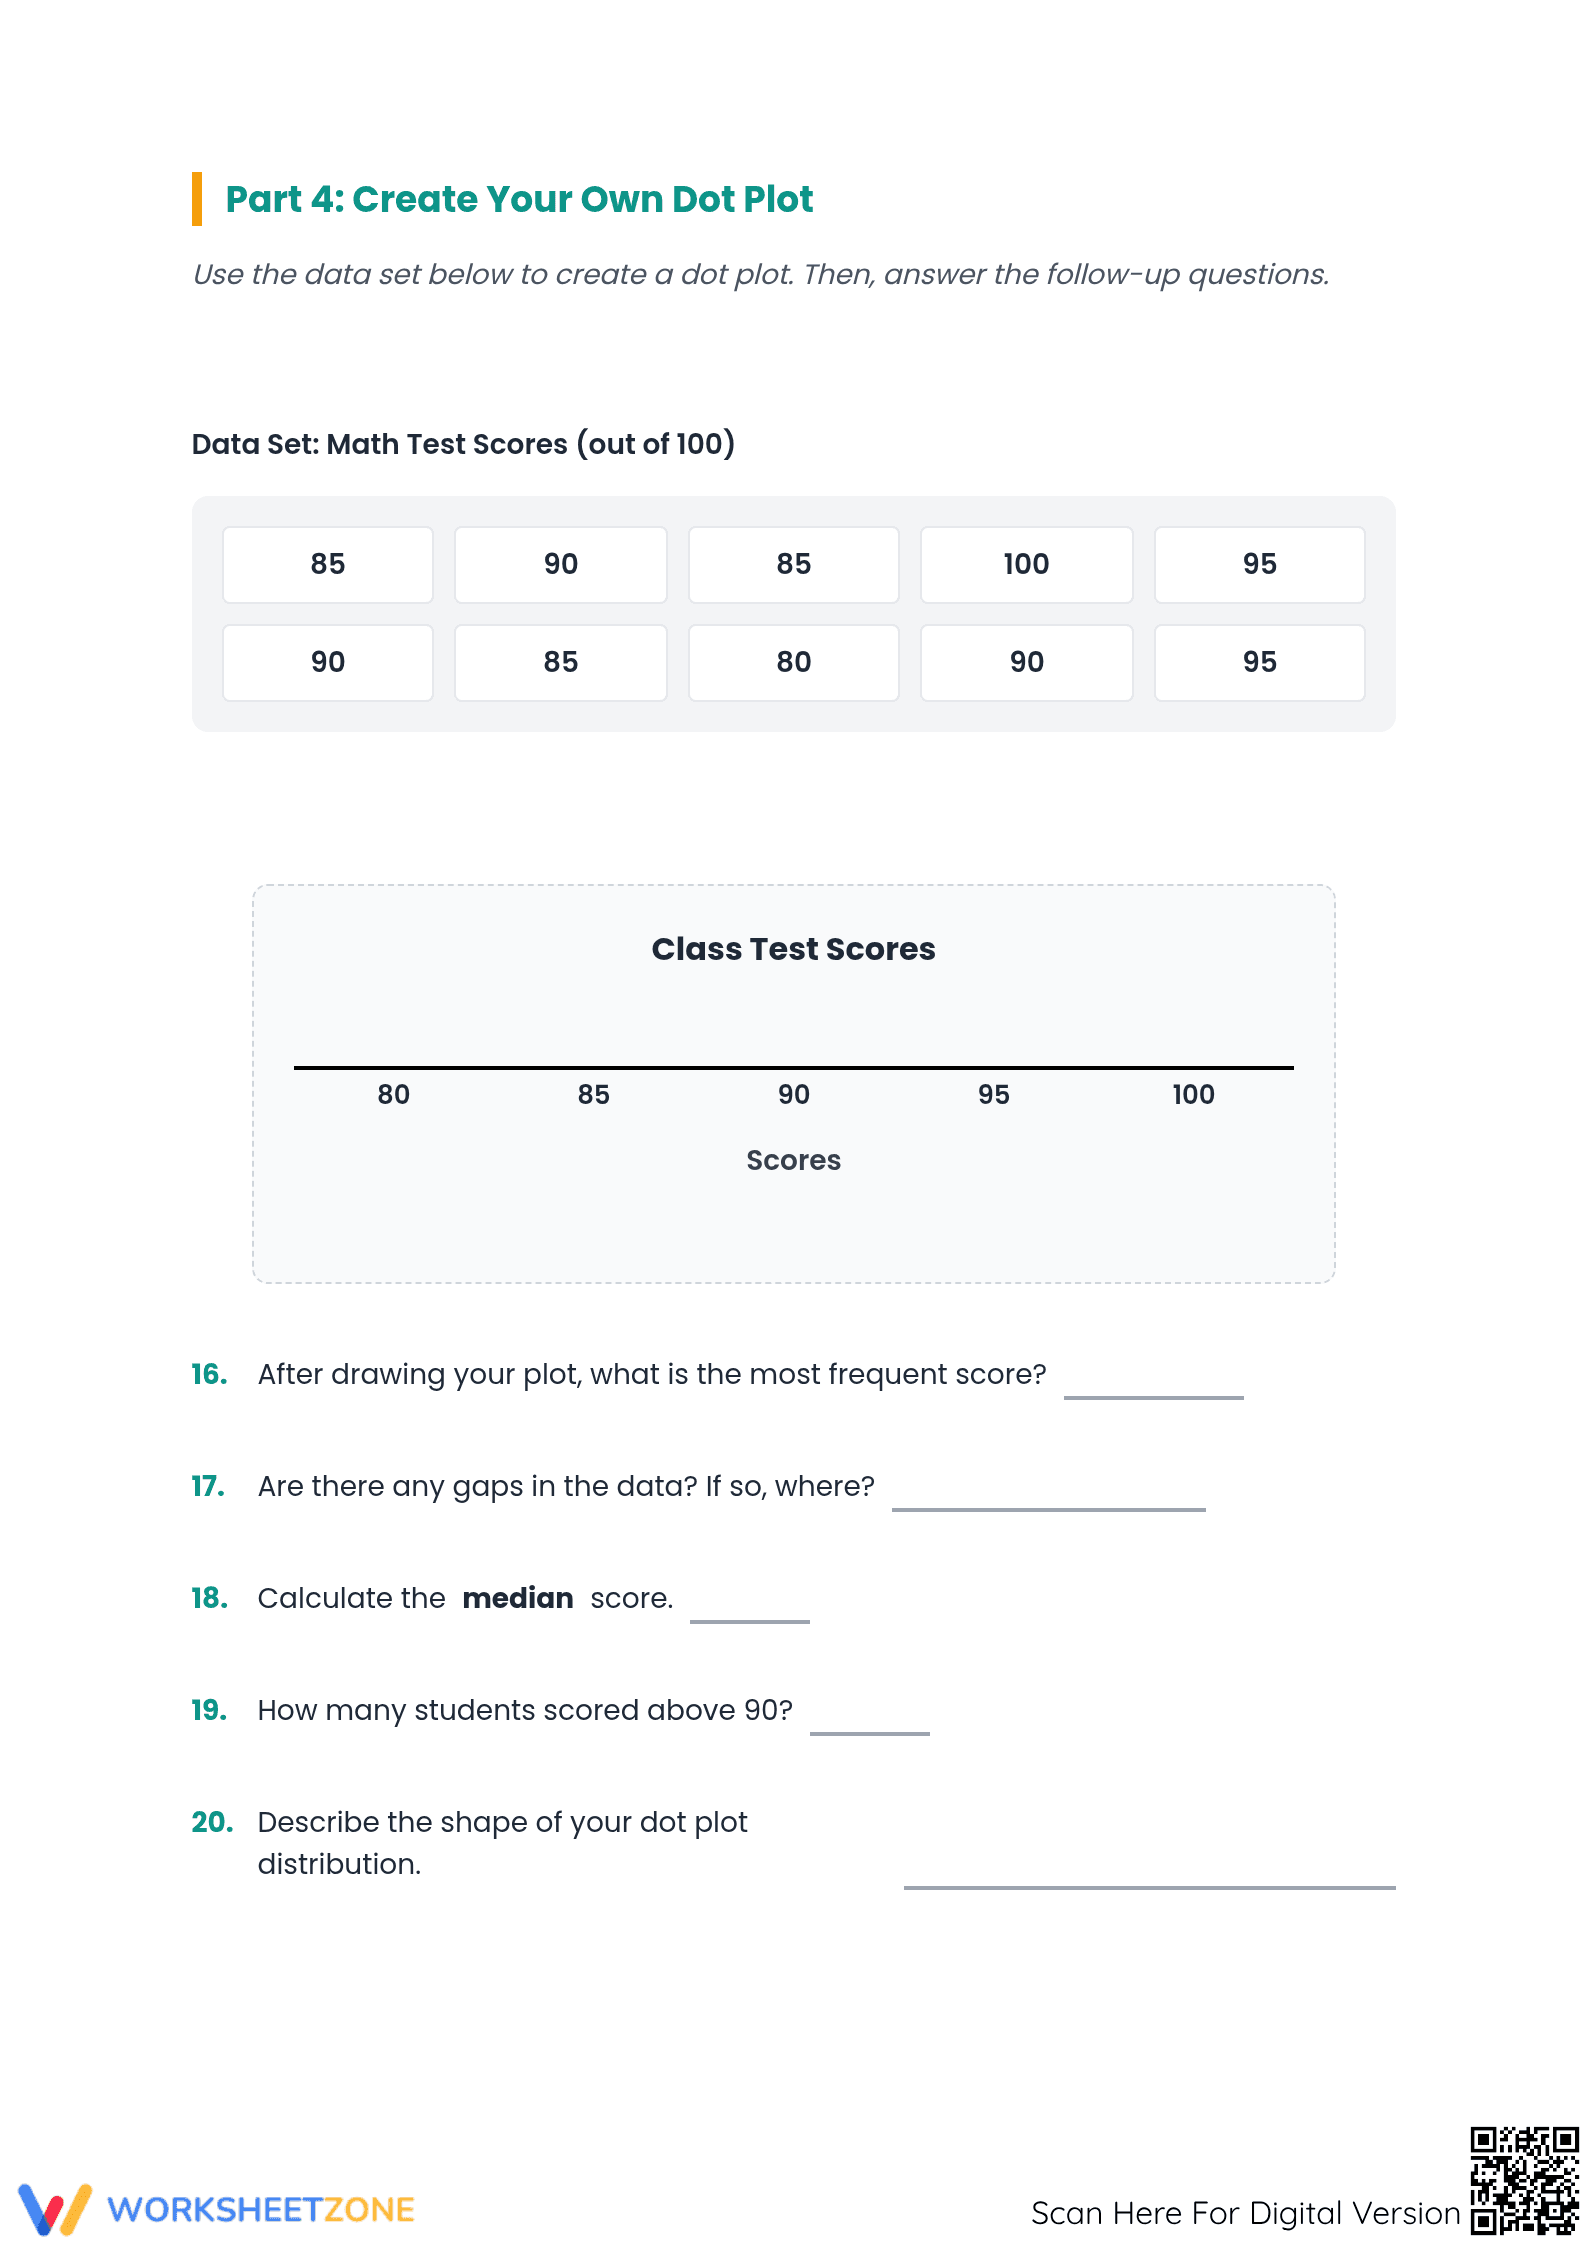
- Independent Construction: The final section requires students to translate a raw data set of test scores into a scaled dot plot and perform a multi-step analysis of the resulting shape.
This sequence follows a gradual-release model, moving from observation to evaluation and finally to synthesis.
Standards Alignment
The primary alignment for this resource is `CCSS.MATH.CONTENT.6.SP.B.4`, which requires students to display numerical data in plots on a number line, specifically dot plots. It also supports `CCSS.MATH.CONTENT.6.SP.B.5.C` by asking students to describe the nature of the attribute under investigation and summarize numerical data sets in relation to their context. Both standard codes can be copied directly into lesson plans, IEP goals, or district curriculum mapping tools.
How to Use It
Use this worksheet as a summative assessment following direct instruction on measures of center and variability. It is also highly effective as a collaborative station activity where students can discuss the "shape" of the data in Part 4. Teachers should observe students during the construction phase to ensure they are maintaining consistent spacing between dots, which is a common point of error. Expect completion within 45 minutes for most Grade 6 students.
Who It's For
This resource is designed for Grade 6 general education classrooms, but it is also appropriate for Grade 4 and 5 acceleration or Grade 7 and 8 review and intervention. It pairs naturally with an introductory lesson on histograms or an anchor chart detailing the difference between mean, median, and mode.
According to the RAND AIRS (2024) report on mathematical literacy, the ability to visualize frequency through dot plots is a foundational prerequisite for understanding more complex statistical distributions in high school. This worksheet addresses this need by providing 20 targeted opportunities for students to bridge the gap between abstract numbers and visual representation. By mastering CCSS.MATH.CONTENT.6.SP.B.4, students gain the competency to identify data clusters and outliers, which are essential skills for evidence-based reasoning. This structured approach ensures that students do not just calculate values but actually comprehend the story that data tells about a population. The inclusion of a construction task further solidifies the student's grasp of scale and interval, making this an essential tool for any curriculum focused on data-driven mastery and statistical fluency.