


























Views
Downloads


Essential Dot Plots & Data Distribution Worksheet | Grade 7
Paste this activity's link or code into your existing LMS (Google Classroom, Canvas, Teams, Schoology, Moodle, etc.).
Students can open and work on the activity right away, with no student login required.
You'll still be able to track student progress and results from your teacher account.
Data Distribution Mastery
Students master the fundamentals of statistical visualization with this comprehensive Dot Plots and Data Distribution Handout. This resource empowers learners to accurately identify critical data features such as peaks, clusters, gaps, and outliers. By the end of these exercises, students will confidently describe distribution shapes and compare multiple data sets using evidence-based reasoning.
At a Glance
- Grade: 7 · Subject: Math
- Standard:
6.SP.B.4— Display numerical data in plots on a number line, including dot plots- Skill Focus: Dot Plots and Data Distribution
- Format: 5 pages · 12 problems · Answer key included · PDF
- Best For: Introductory lessons and formative assessment
- Time: 30–45 minutes
Comprehensive Instructional Content
This 5-page instructional packet includes a detailed reference guide for distribution shapes, including symmetric and skewed variations. It contains 12 structured tasks ranging from basic identification to complex comparative analysis. A complete answer key is provided to facilitate rapid grading or student self-correction, making it an ideal choice for multi-day data units.
Scaffolded Skill Progression
The worksheet follows a scaffolded instructional design to ensure student success:
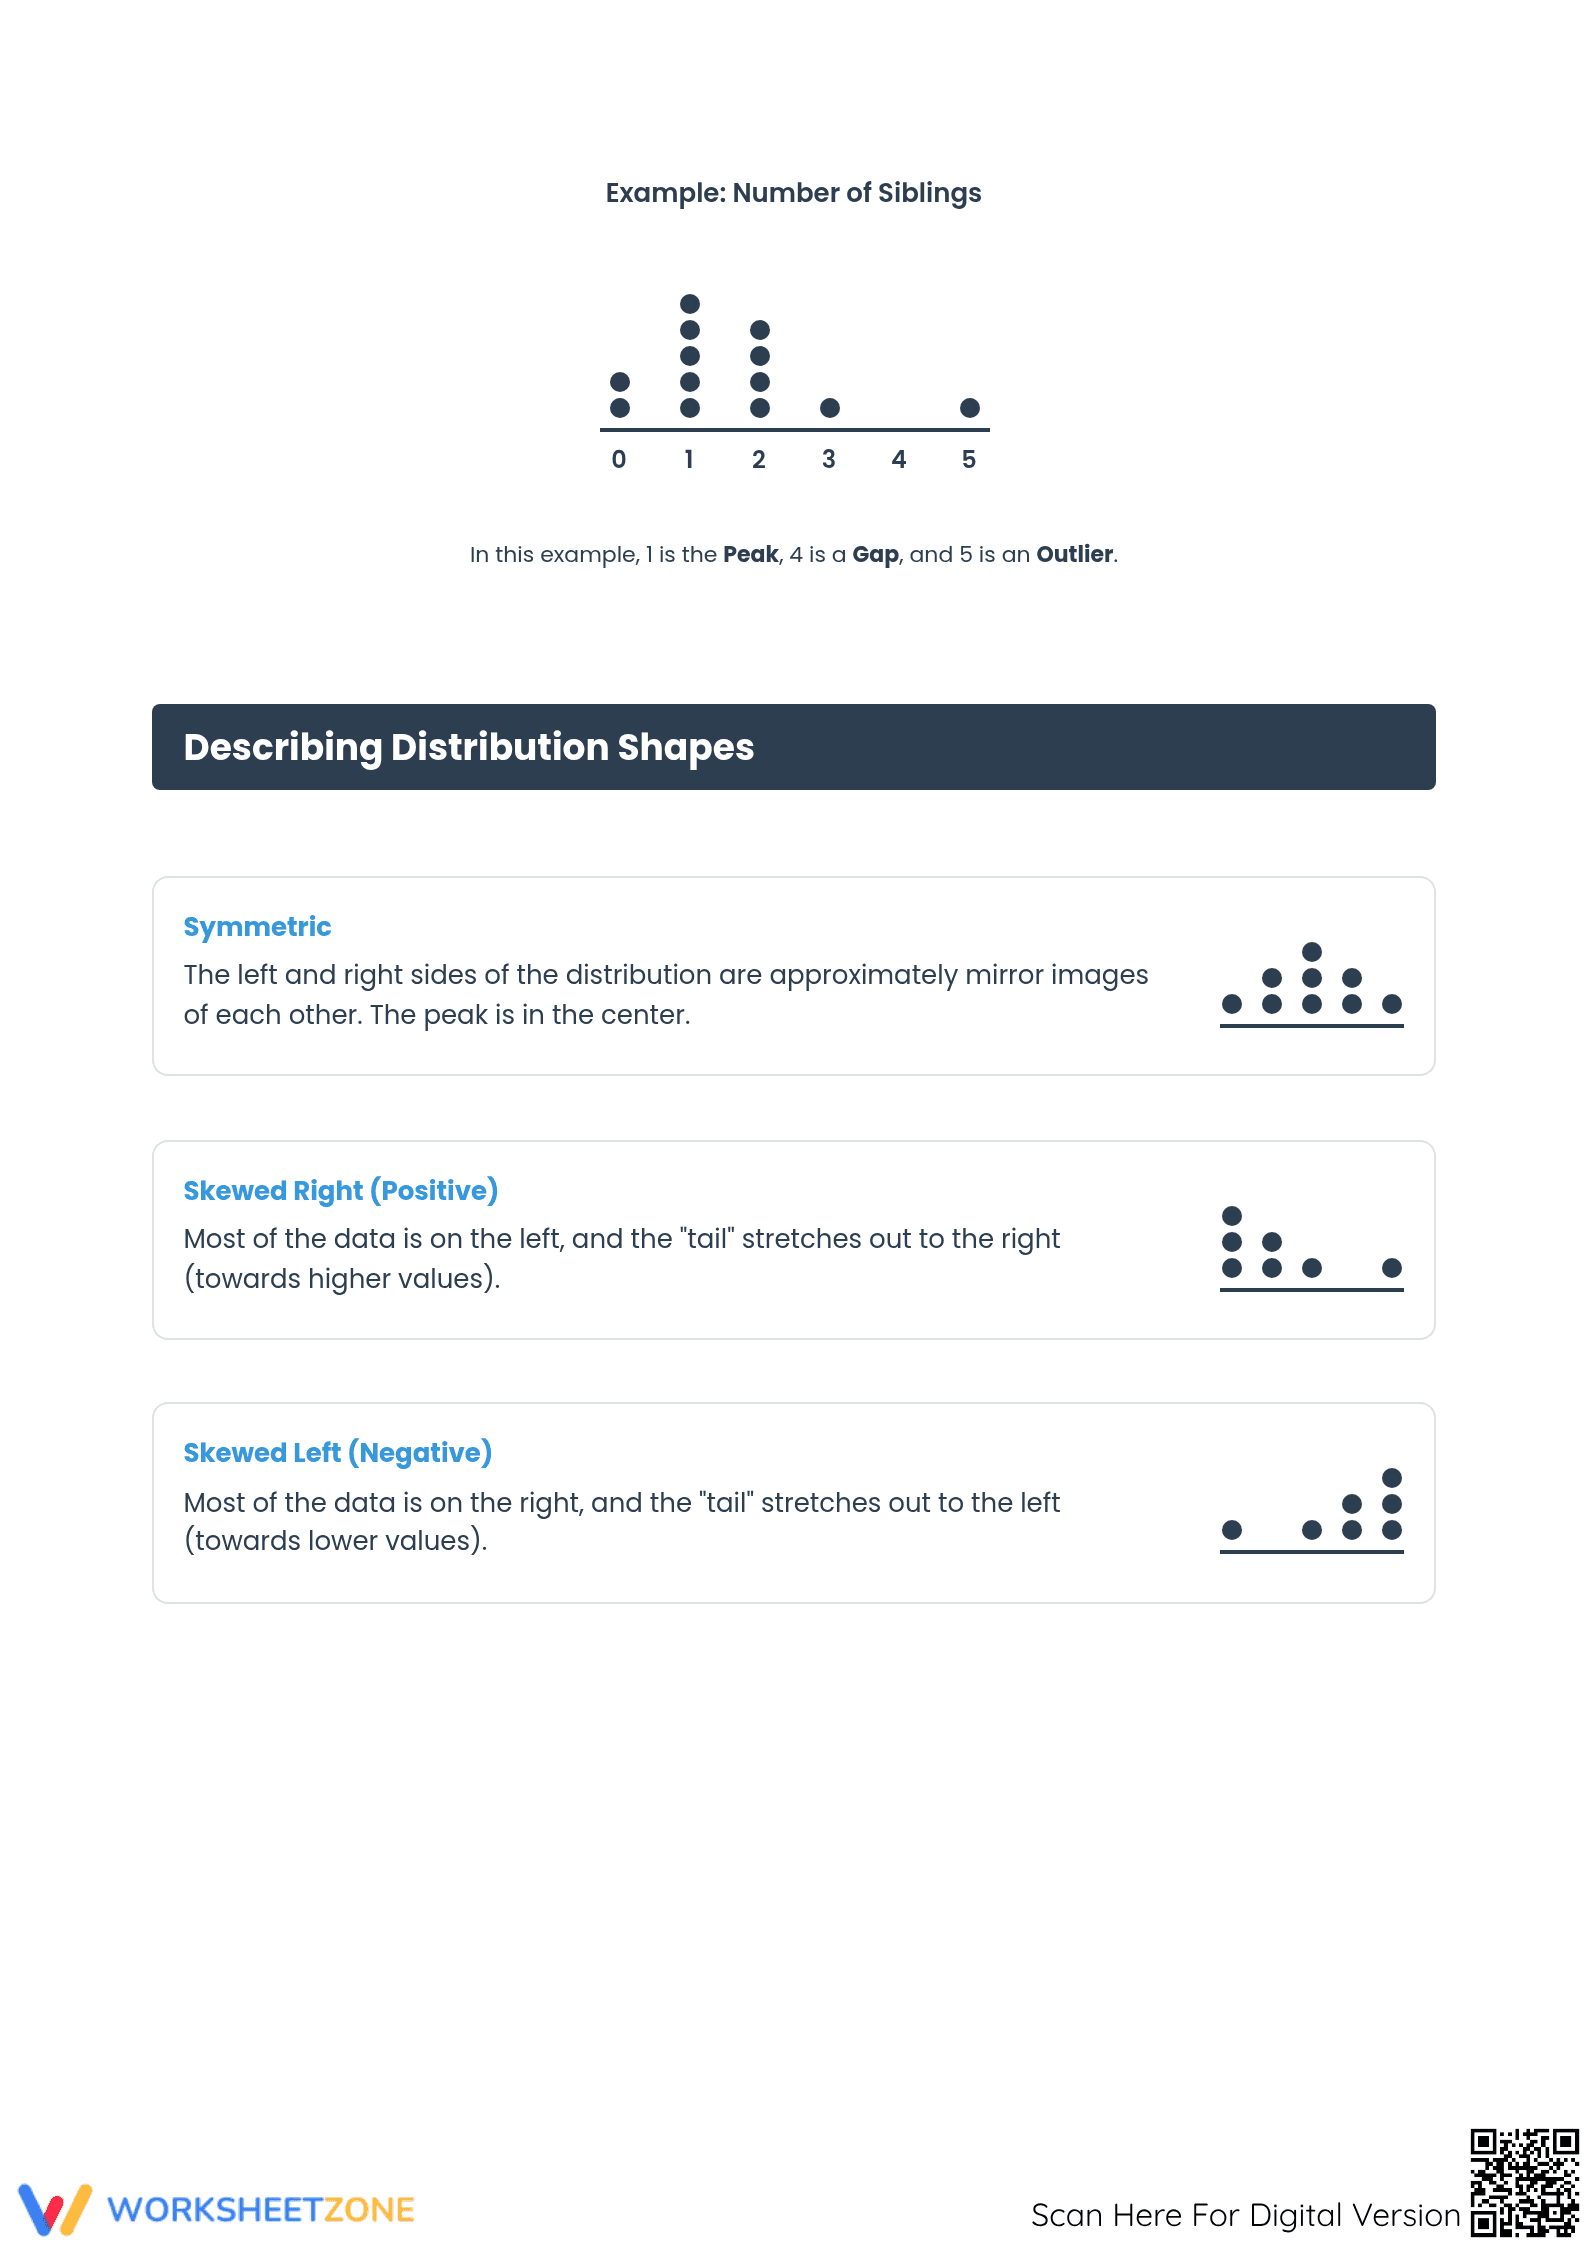
- Guided Practice: Provides a comprehensive definition key and an annotated sibling data example to establish a conceptual baseline for 5 essential terms.
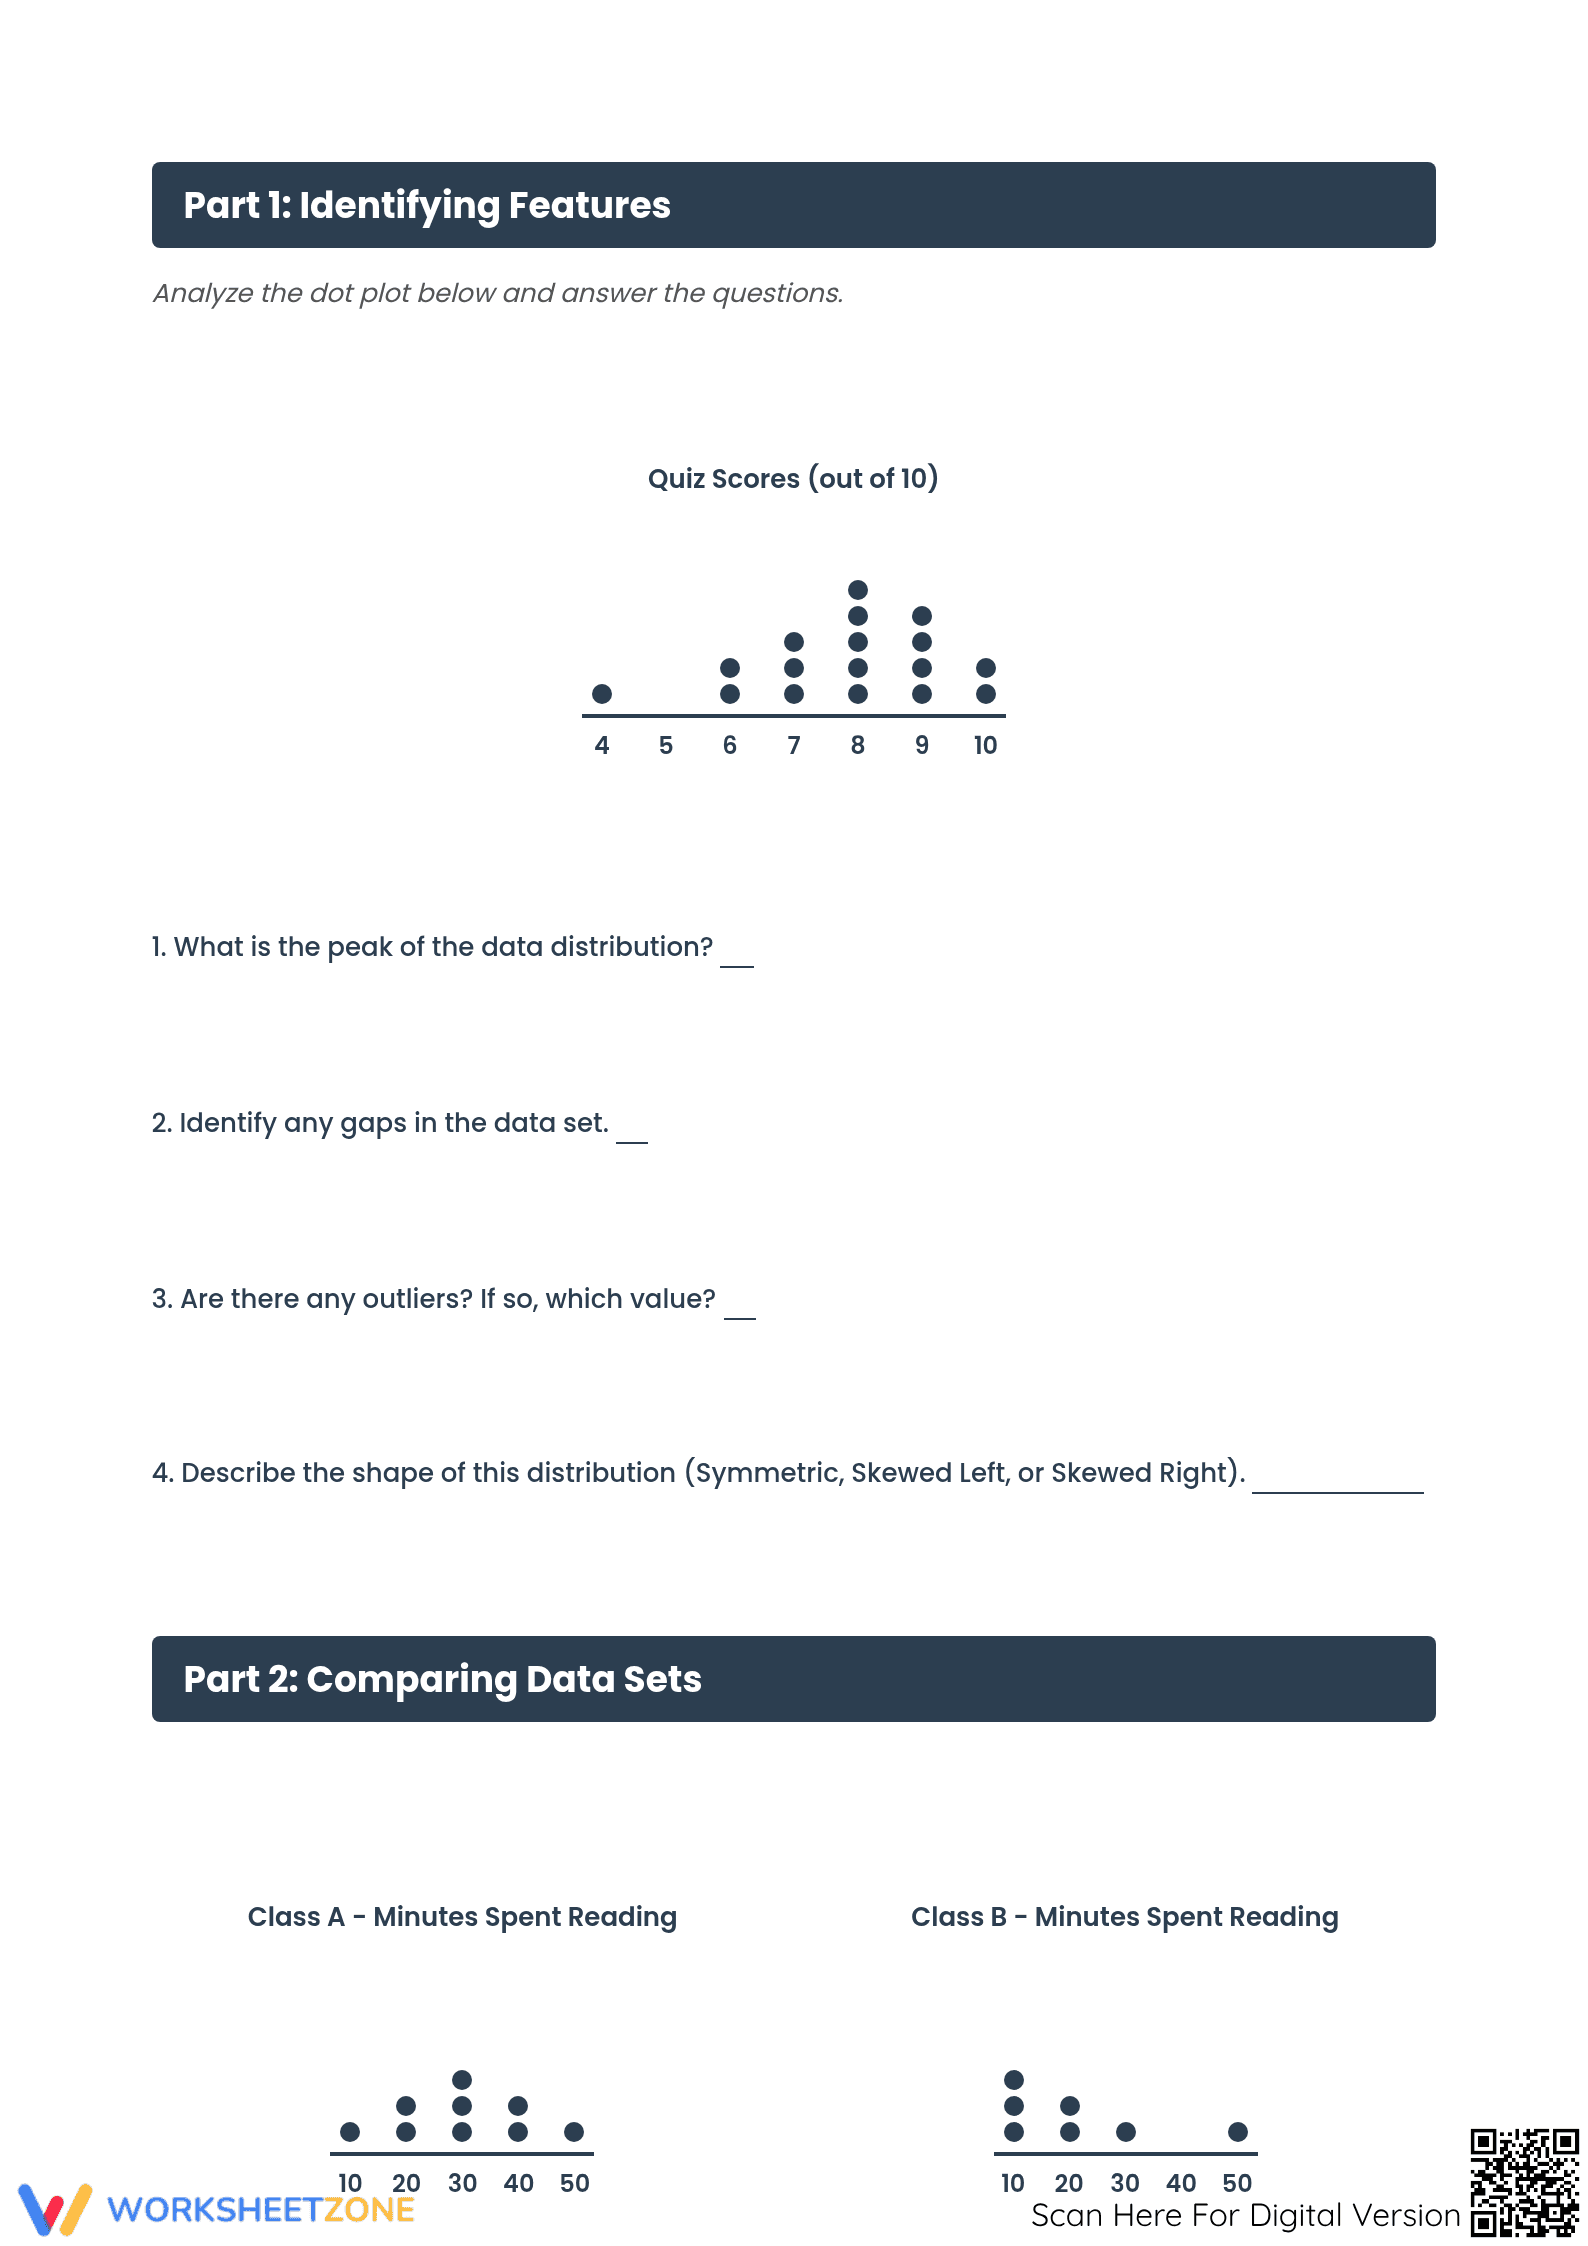
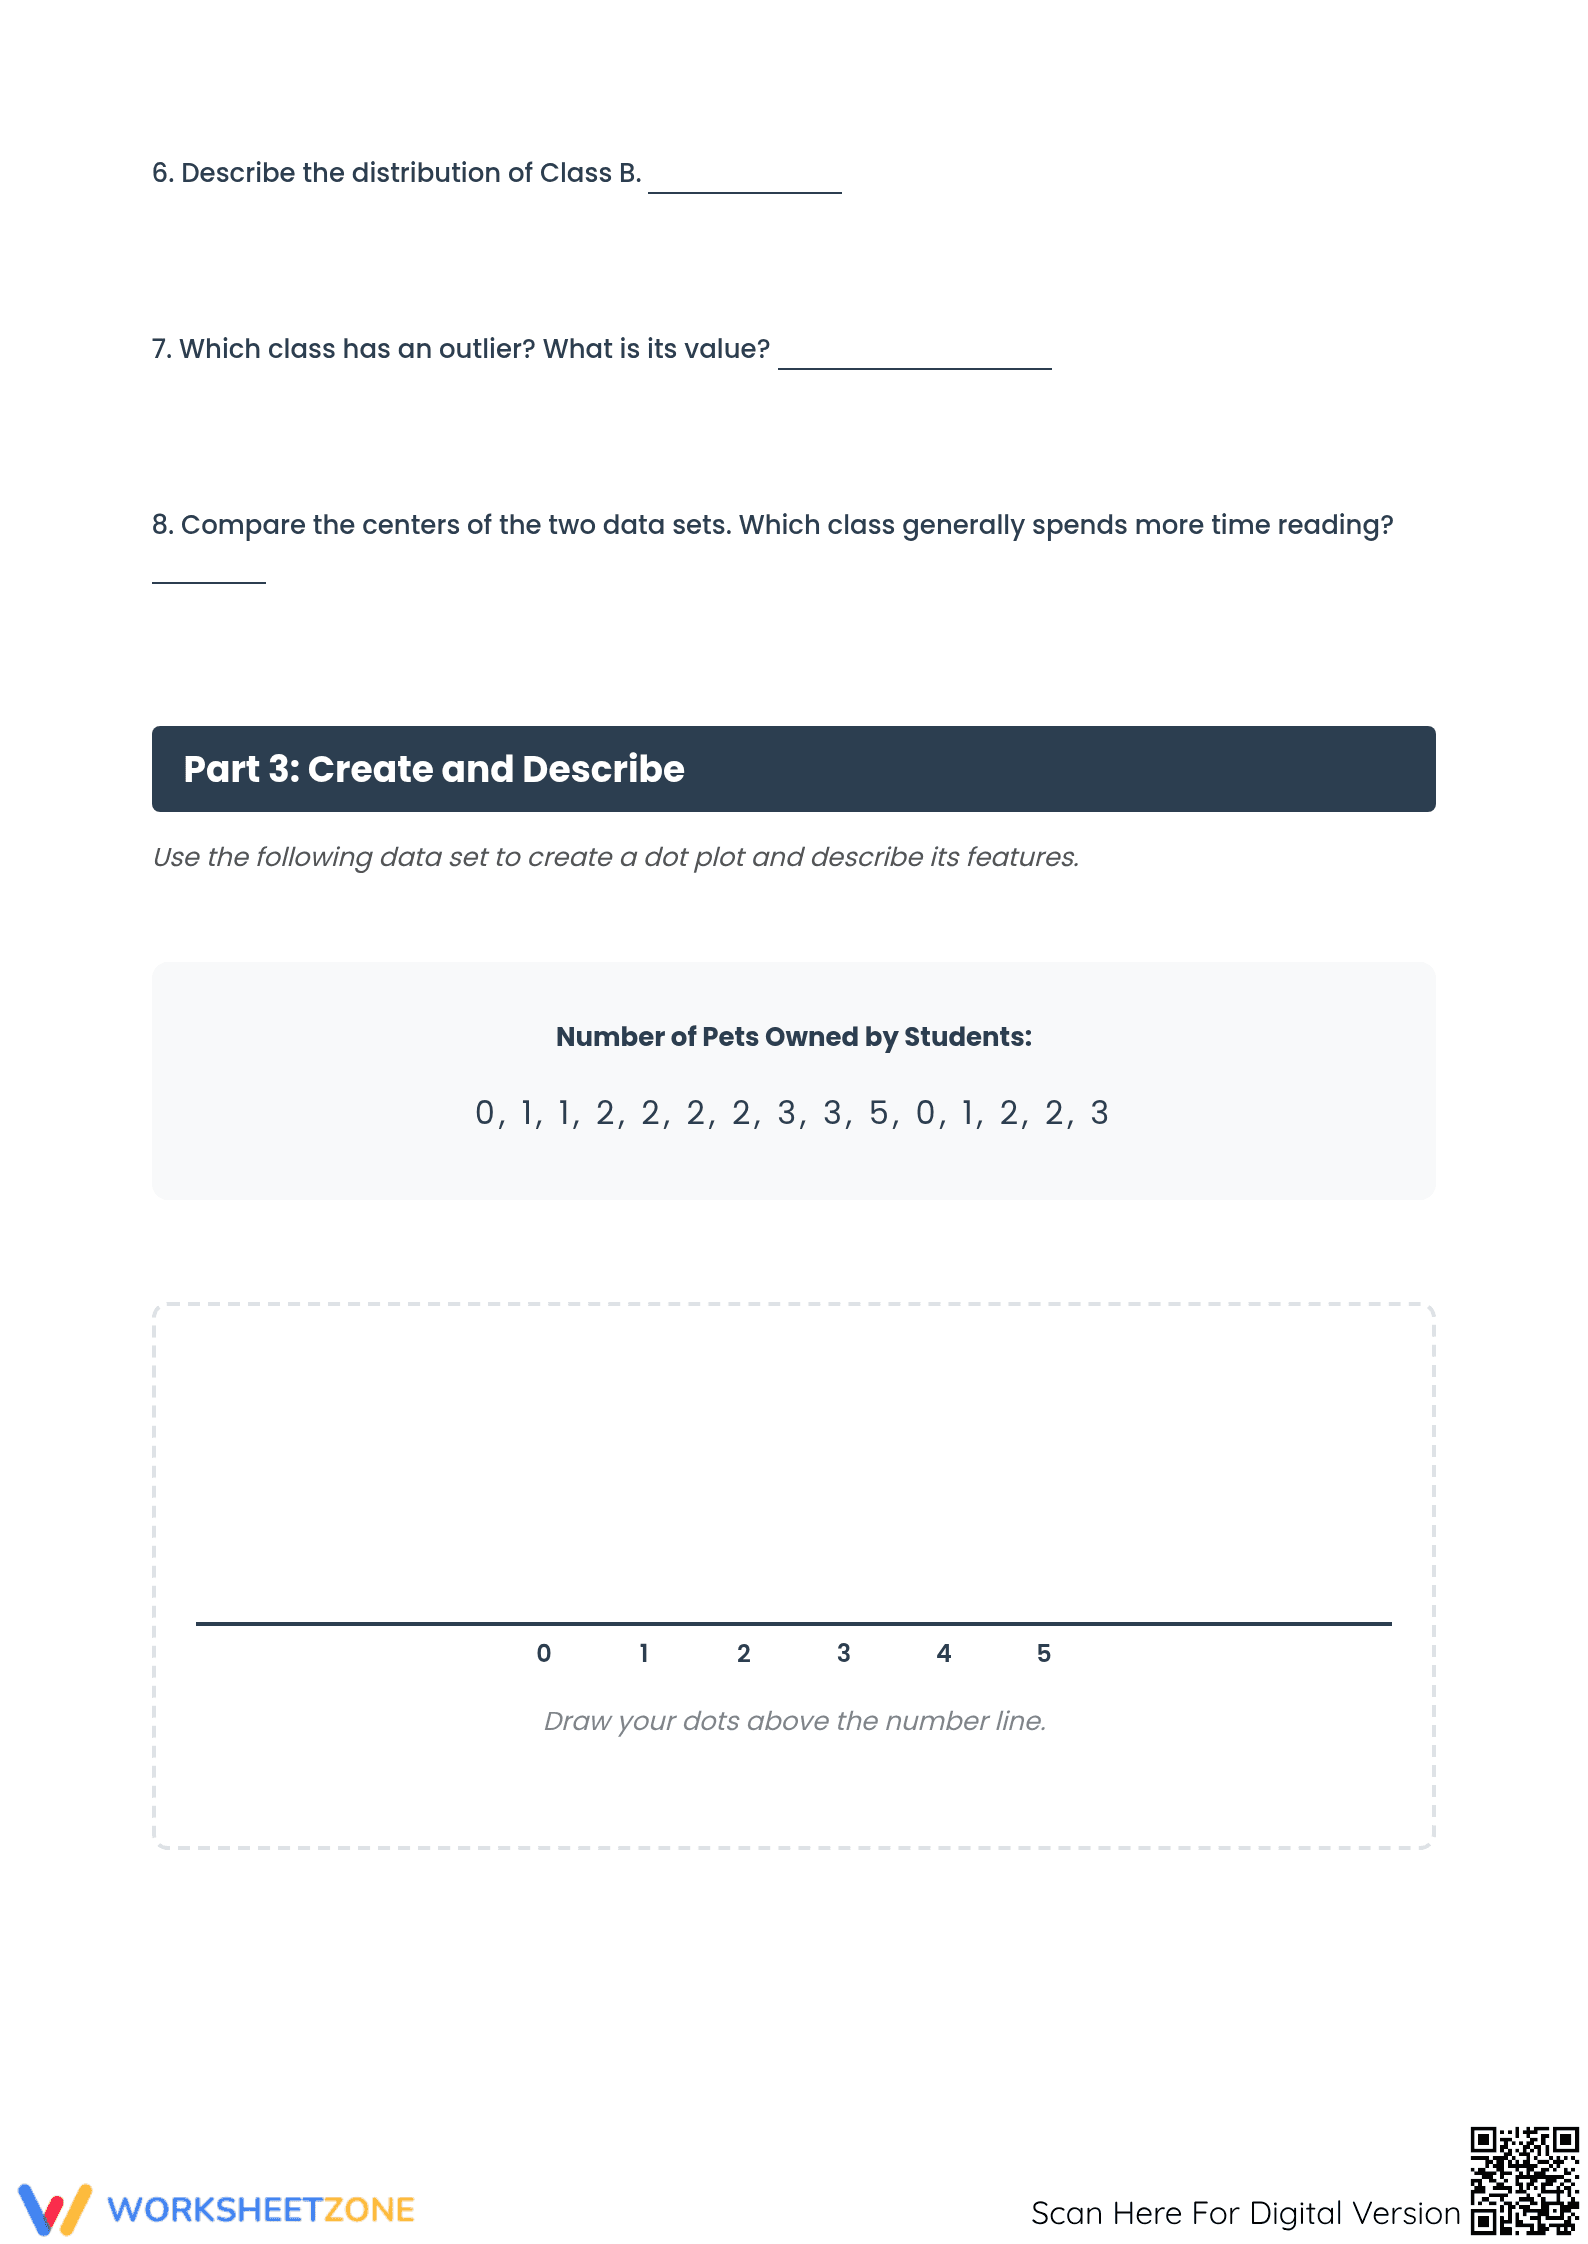
- Supported Practice: Features 8 analytical questions where students identify features and compare two distinct distributions for reading minutes across different classes.
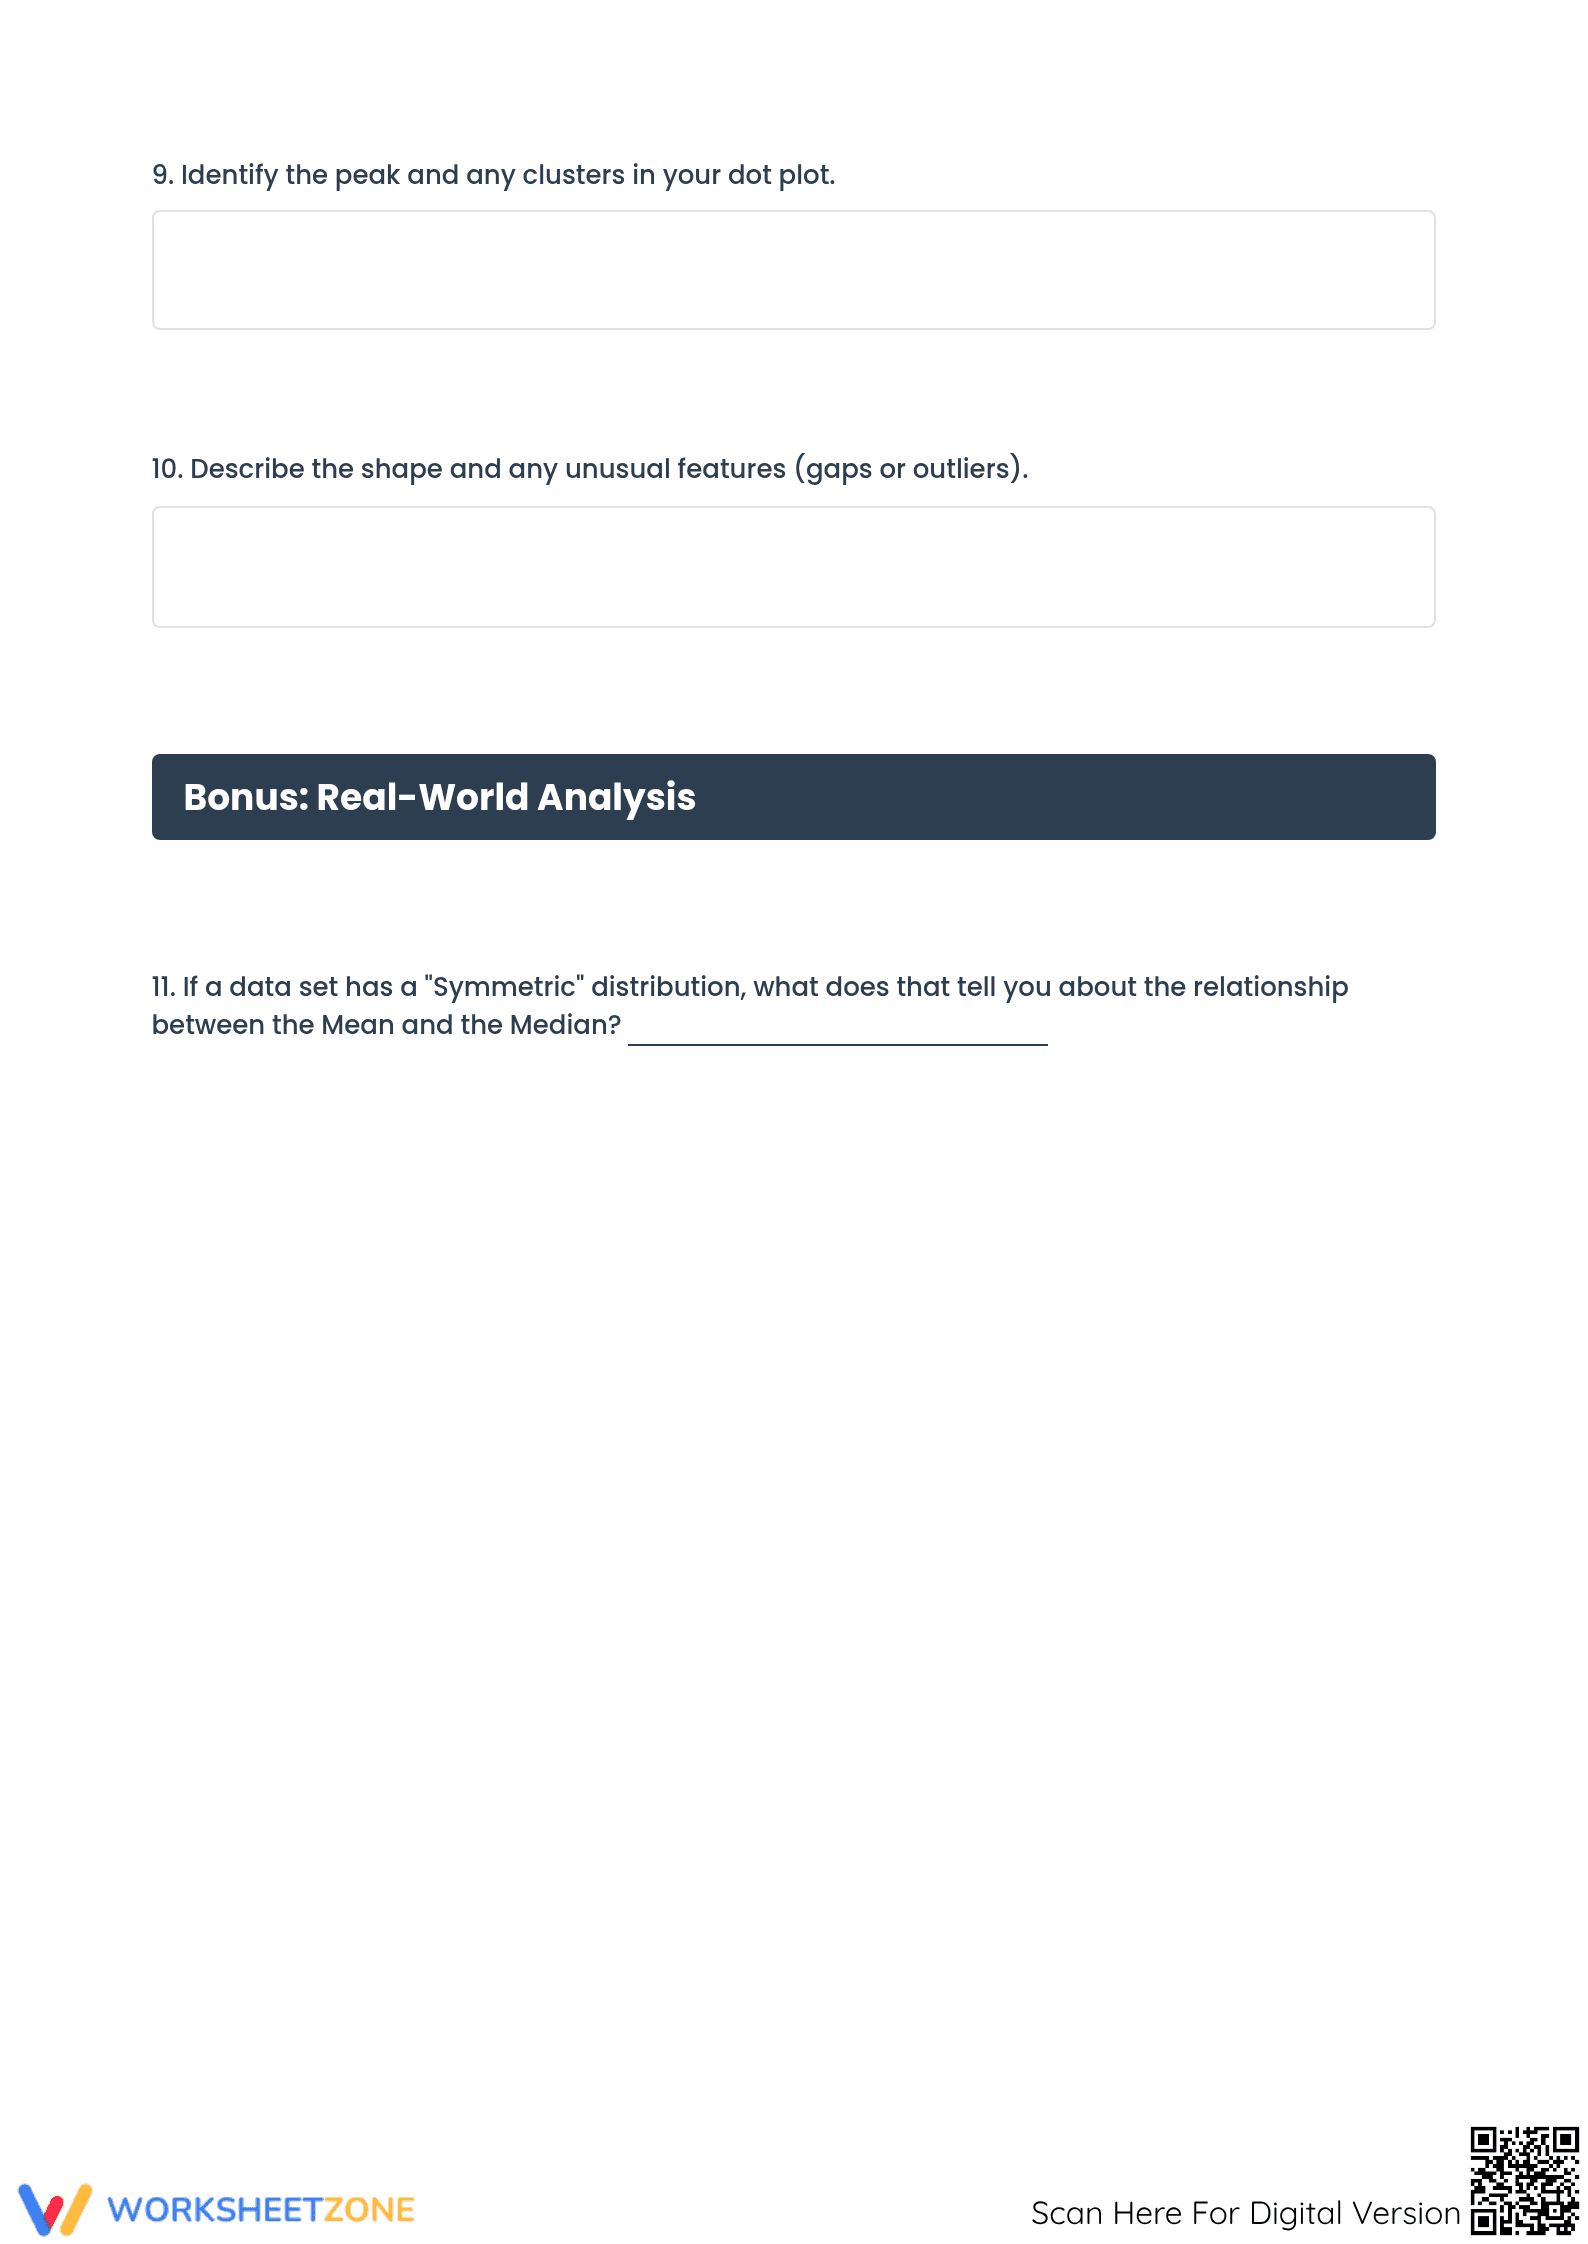
- Independent Practice: Challenges students to create an original dot plot from a raw data set of pets owned, demonstrating full application of learned skills.
This progression supports a gradual-release model that moves students from observation to independent creation.
Standards Alignment and Mastery
This resource is explicitly aligned to 6.SP.B.4, focusing on displaying numerical data in plots on a number line. It also supports 6.SP.B.5.c by requiring students to describe the nature of the attribute under investigation. Both standard codes can be copied directly into lesson plans, IEP goals, or district curriculum mapping tools.
Instructional Implementation Strategies
Use this handout as a primary teaching tool during the introduction of a statistics unit. It works exceptionally well when paired with a "think-aloud" strategy where the teacher models the identification of an outlier before students work through the comparison section. Additionally, the final creation task serves as a reliable formative assessment to gauge student readiness for histograms.
Student Population and Differentiation
This worksheet is designed for Grade 7 and Grade 8 students who are developing their statistical literacy. It is particularly effective for learners who benefit from visual scaffolds and clear definitions. For further enrichment, pair this activity with a real-world data collection project where students survey their classmates to generate their own original data sets.
According to the Fisher & Frey (2014) model of gradual release of responsibility, structured data analysis tools like this dot plot handout are vital for bridging the gap between abstract statistical concepts and concrete visual representations. This Grade 7 worksheet focuses on CCSS.MATH.CONTENT.6.SP.B.4, which requires students to display numerical data in plots on a number line. By identifying peaks, clusters, gaps, and outliers, learners develop the foundational skills necessary for higher-order statistical inference. Research indicates that visual data displays allow students to recognize patterns in distribution shapes more effectively than through raw data tables alone. This instructional resource provides twelve targeted tasks that transition from identifying features to comparing data sets and eventually creating original plots. Teachers can utilize these structured problems to facilitate evidence-based discussions regarding data variability and distribution, ensuring students meet core mastery benchmarks in modern middle school mathematics curricula.


