


Views
Downloads
Printable Dot Plot Worksheet | Grade 6 Math Aligned
Paste this activity's link or code into your existing LMS (Google Classroom, Canvas, Teams, Schoology, Moodle, etc.).
Students can open and work on the activity right away, with no student login required.
You'll still be able to track student progress and results from your teacher account.
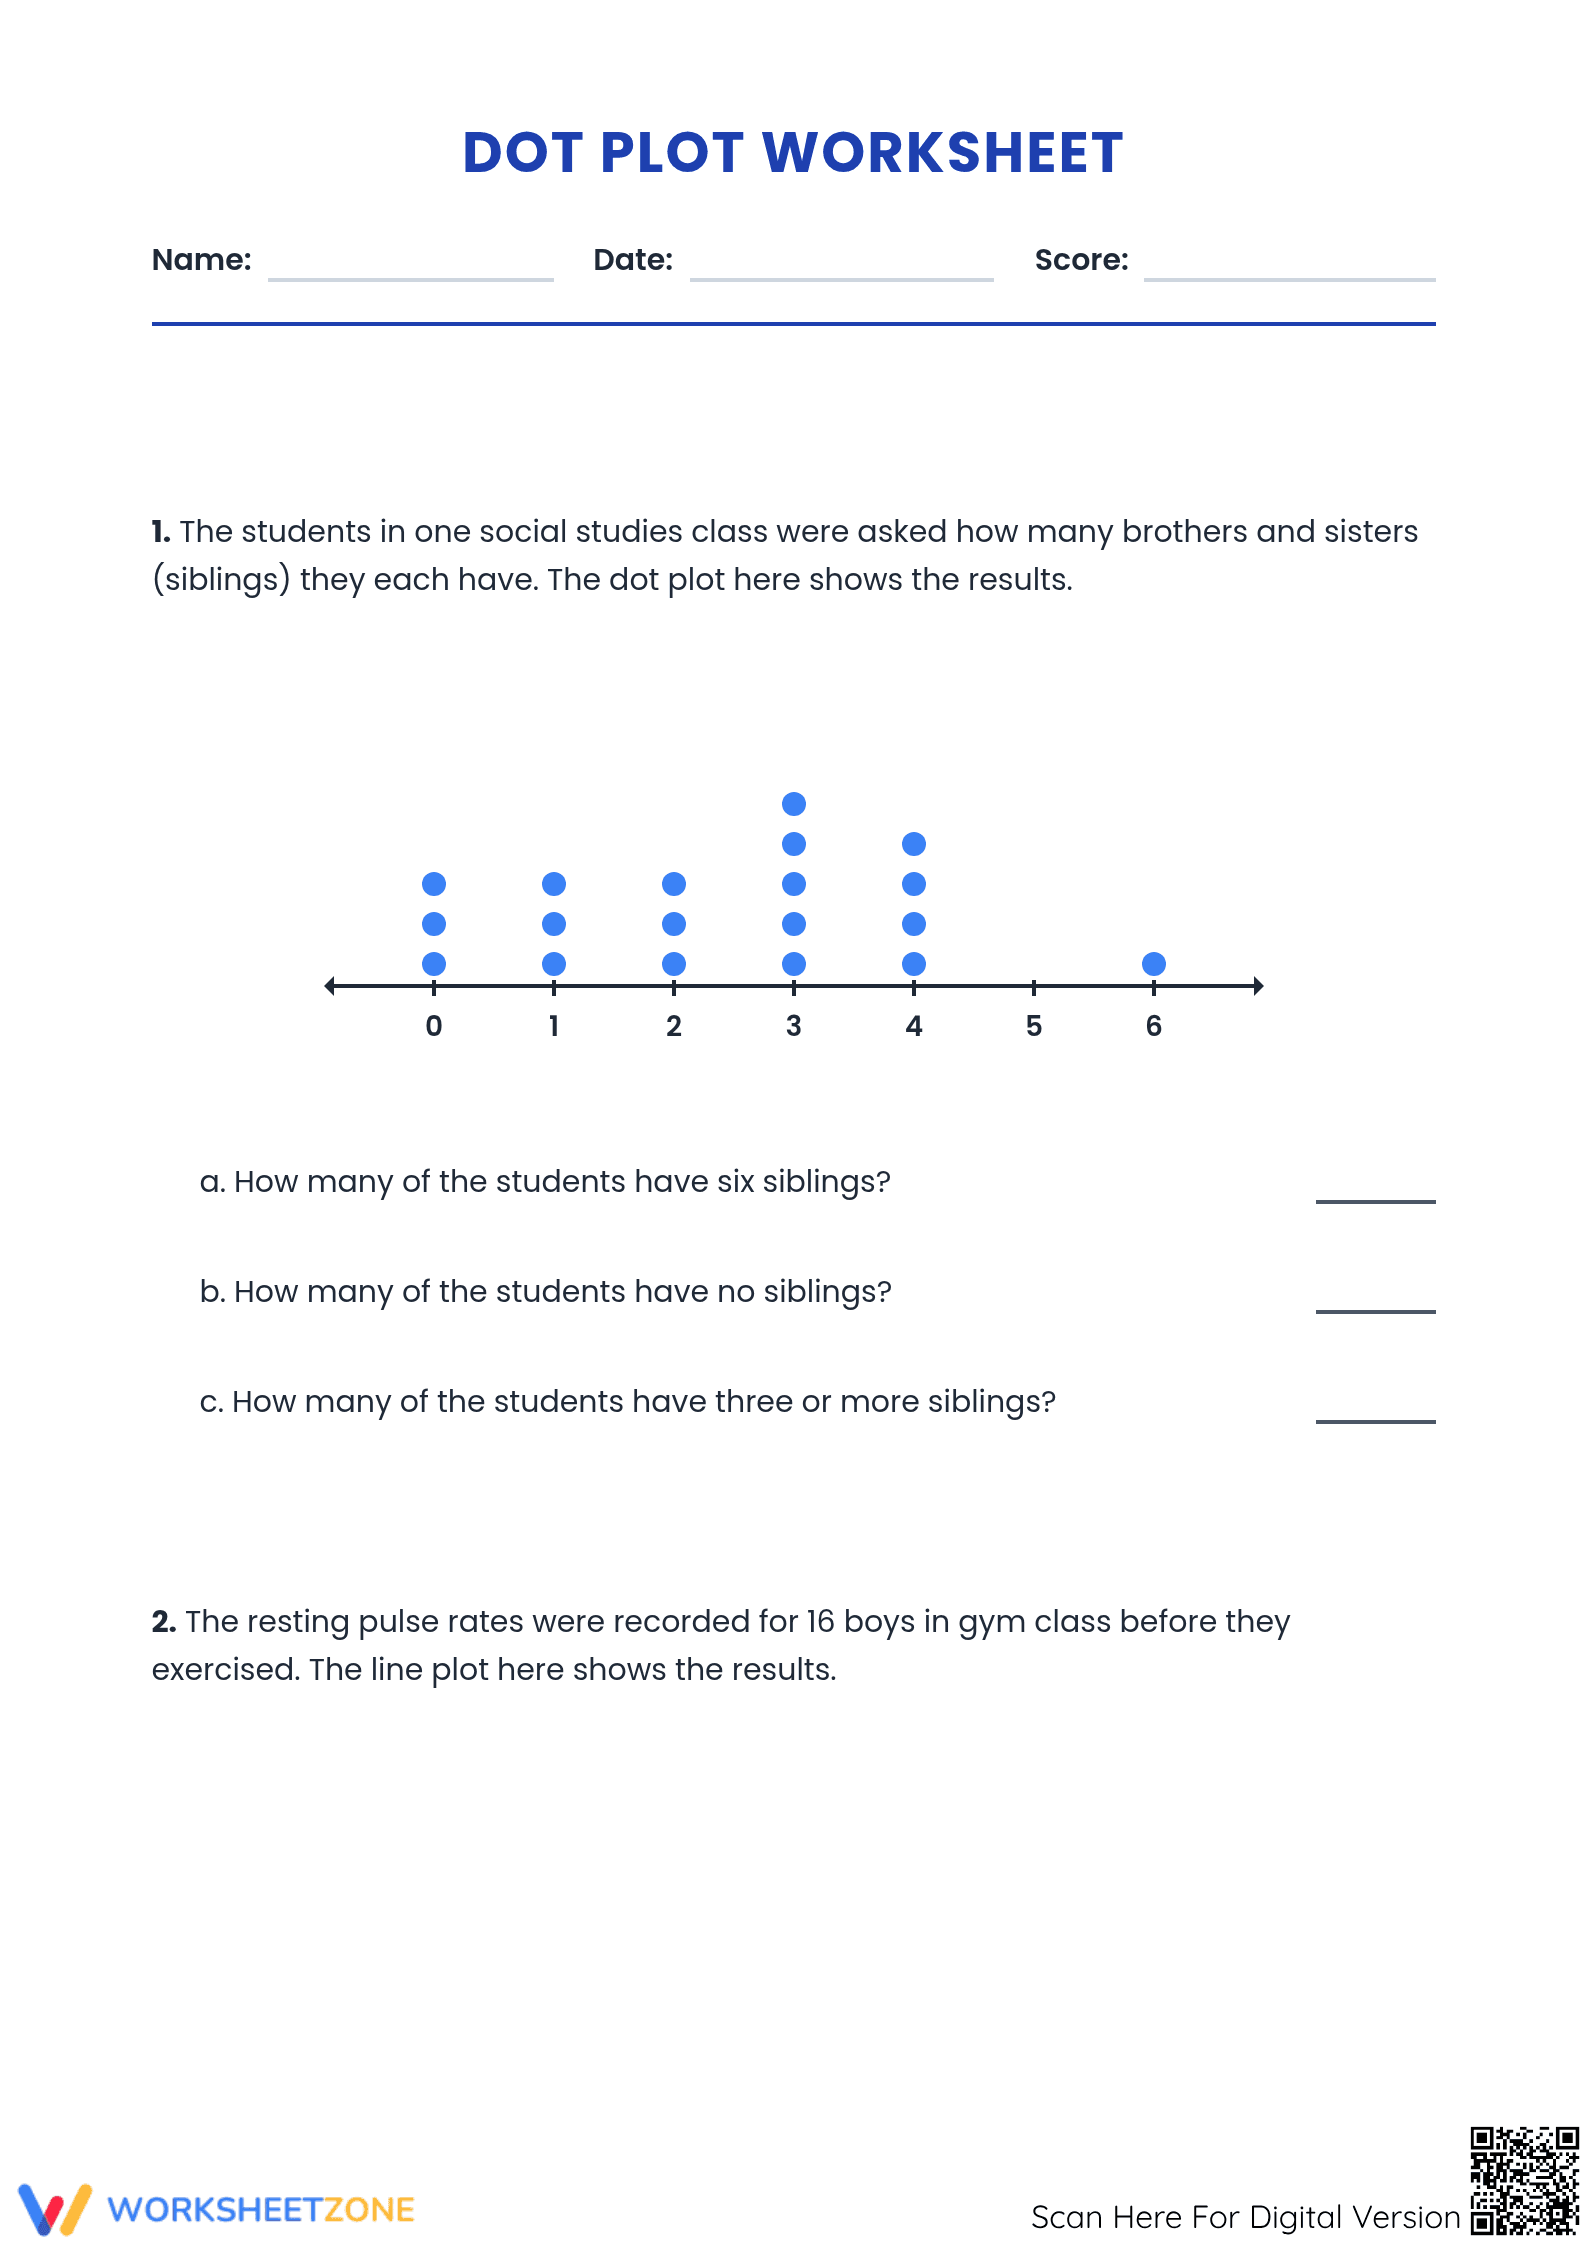
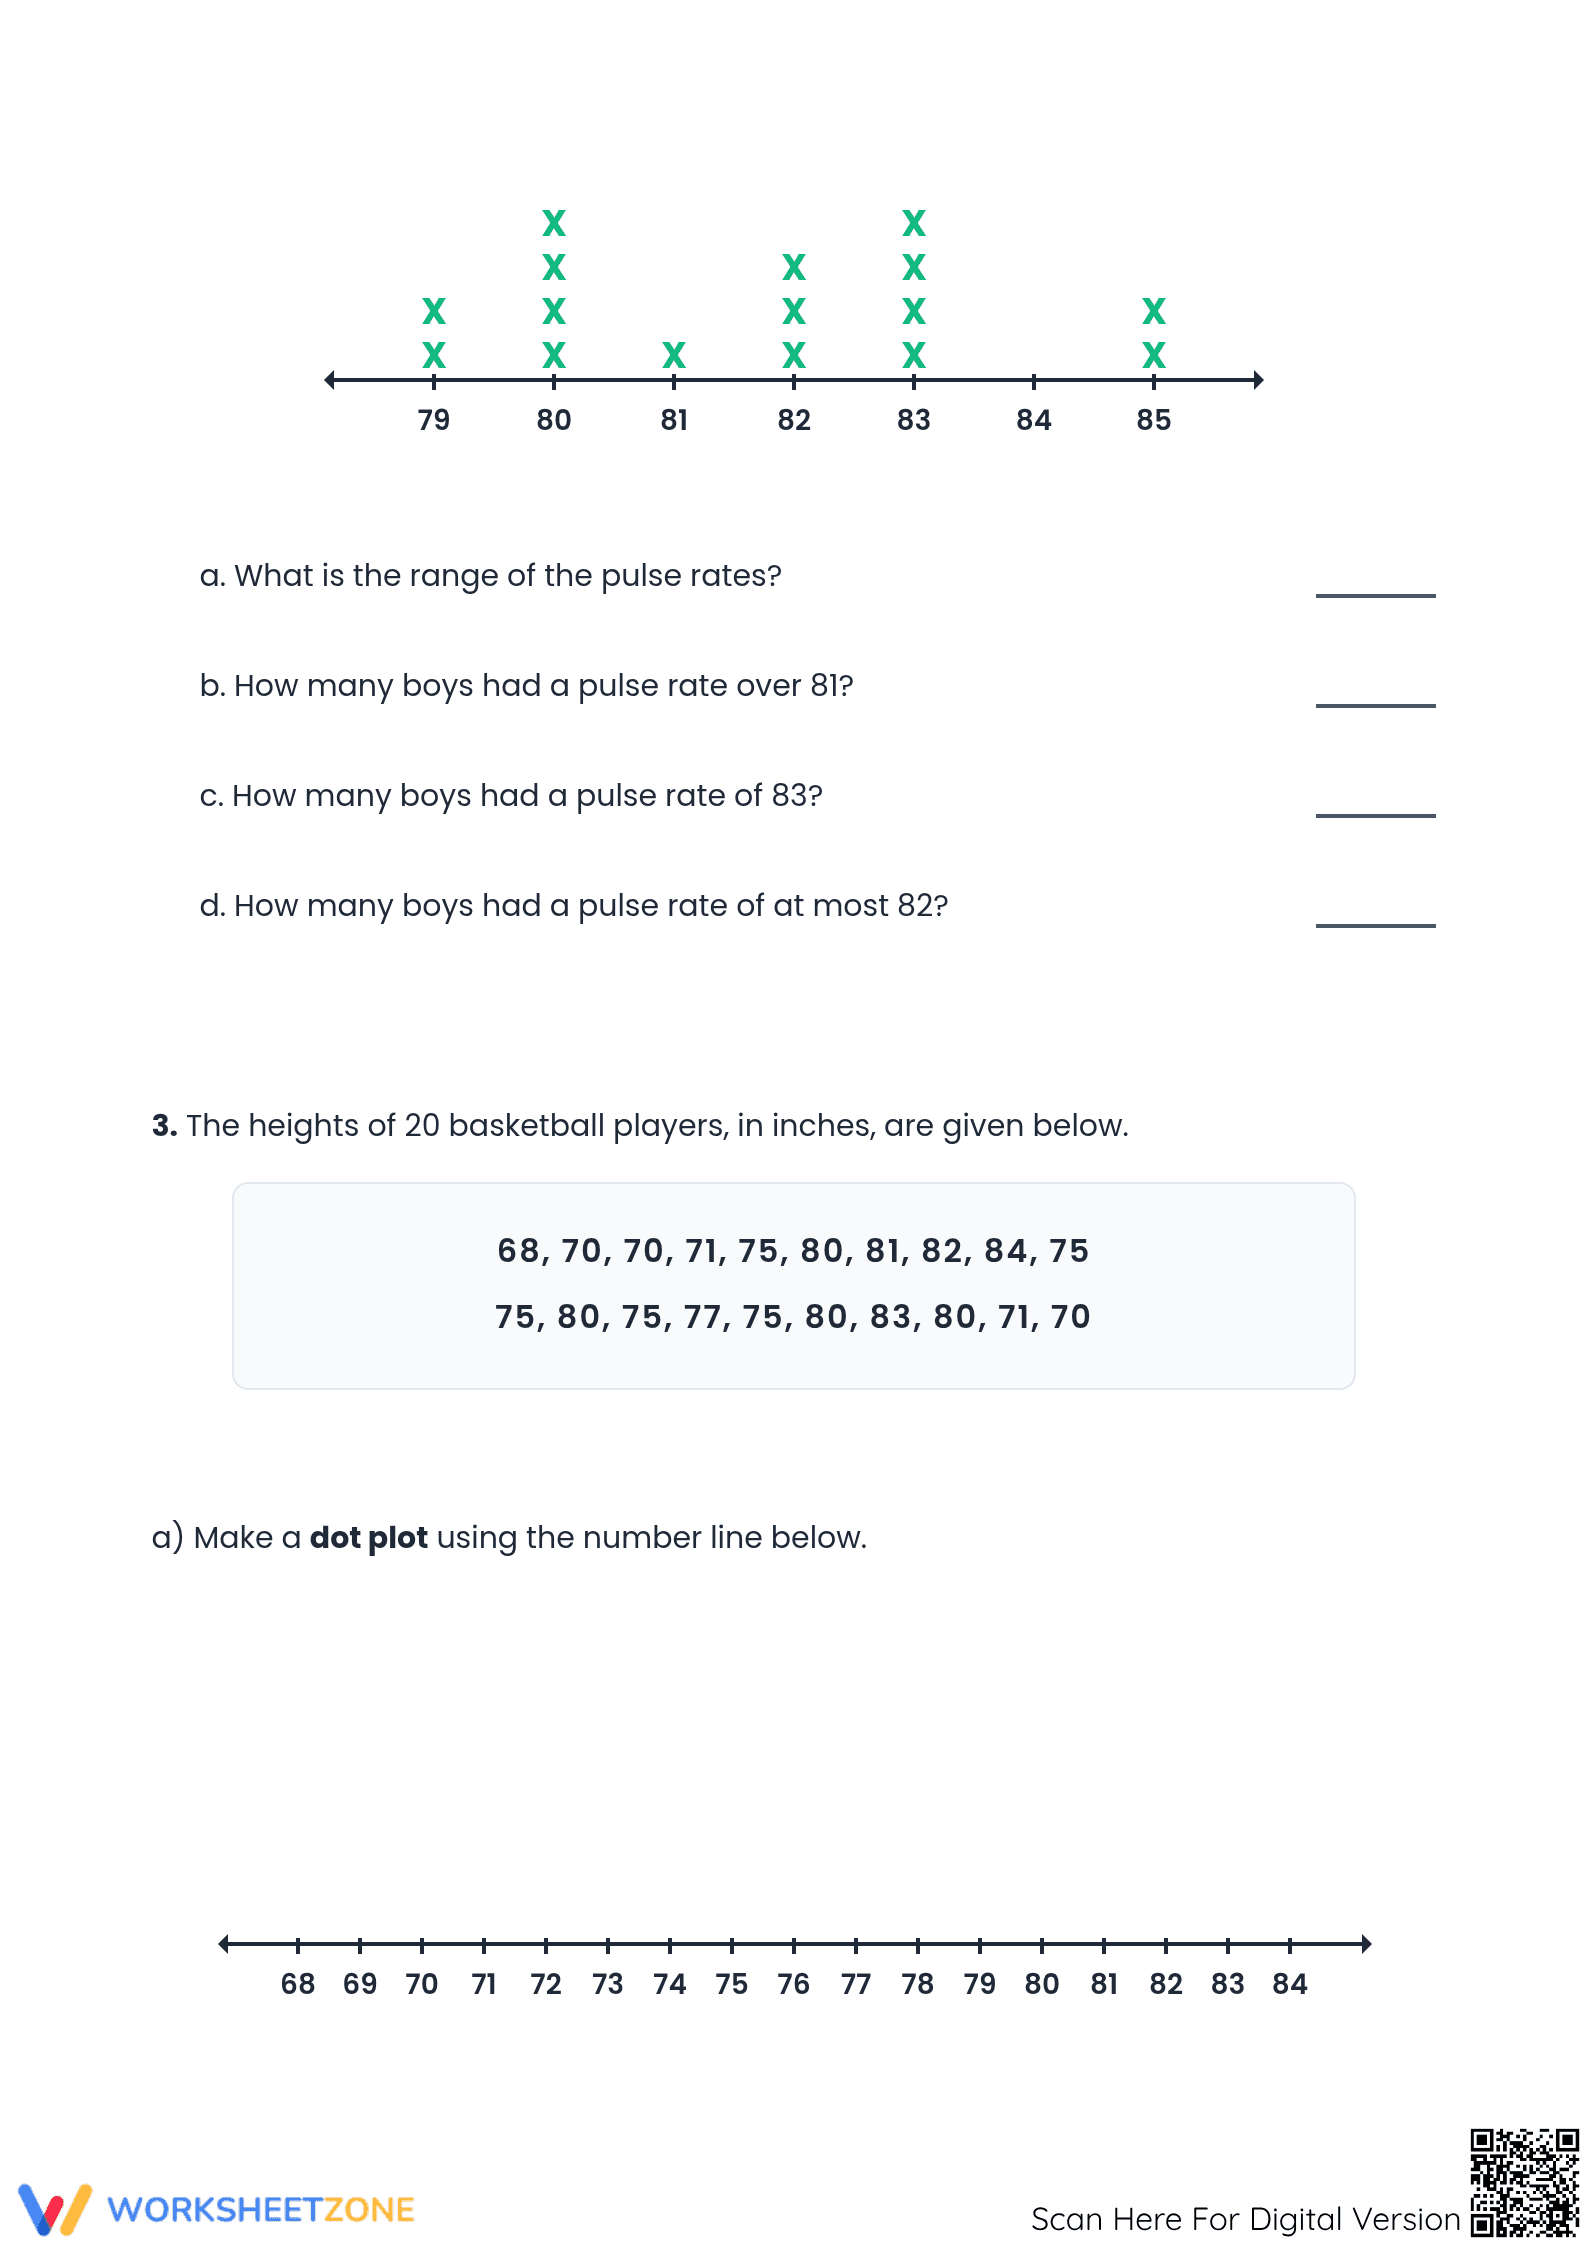
This Printable Dot Plot Worksheet provides a comprehensive framework for students to master the art of data visualization and statistical interpretation. By engaging with real-world scenarios like sibling counts and athlete heights, learners develop the essential ability to translate raw numbers into meaningful visual stories. This resource ensures students gain confidence in calculating range and identifying frequency patterns.
At a Glance
- Grade: 6 · Subject: Math
- Standard:
CCSS.6.SP.B.4— Display numerical data in plots on a number line including dot plots- Skill Focus: Data Display and Interpretation
- Format: 3 pages · 15 problems · Answer key included · PDF
- Best For: Middle school data and statistics units
- Time: 30–45 minutes
Across three structured pages, this resource presents a variety of task types designed to challenge different cognitive levels. Students will find two pre-generated dot plots for immediate interpretation, followed by two raw data sets that require the construction of new displays from scratch. The worksheet includes clear number line templates, dedicated space for multi-step calculations like range and mode, and a complete answer key for rapid verification.
Skill Progression
- Guided Practice: Students begin by interpreting existing dot plots, answering 7 direct questions about frequency, comparisons, and data extremes to build initial confidence.
- Supported Practice: The worksheet provides raw data for basketball player heights, requiring students to organize 20 data points into a new visual display using a provided number line.
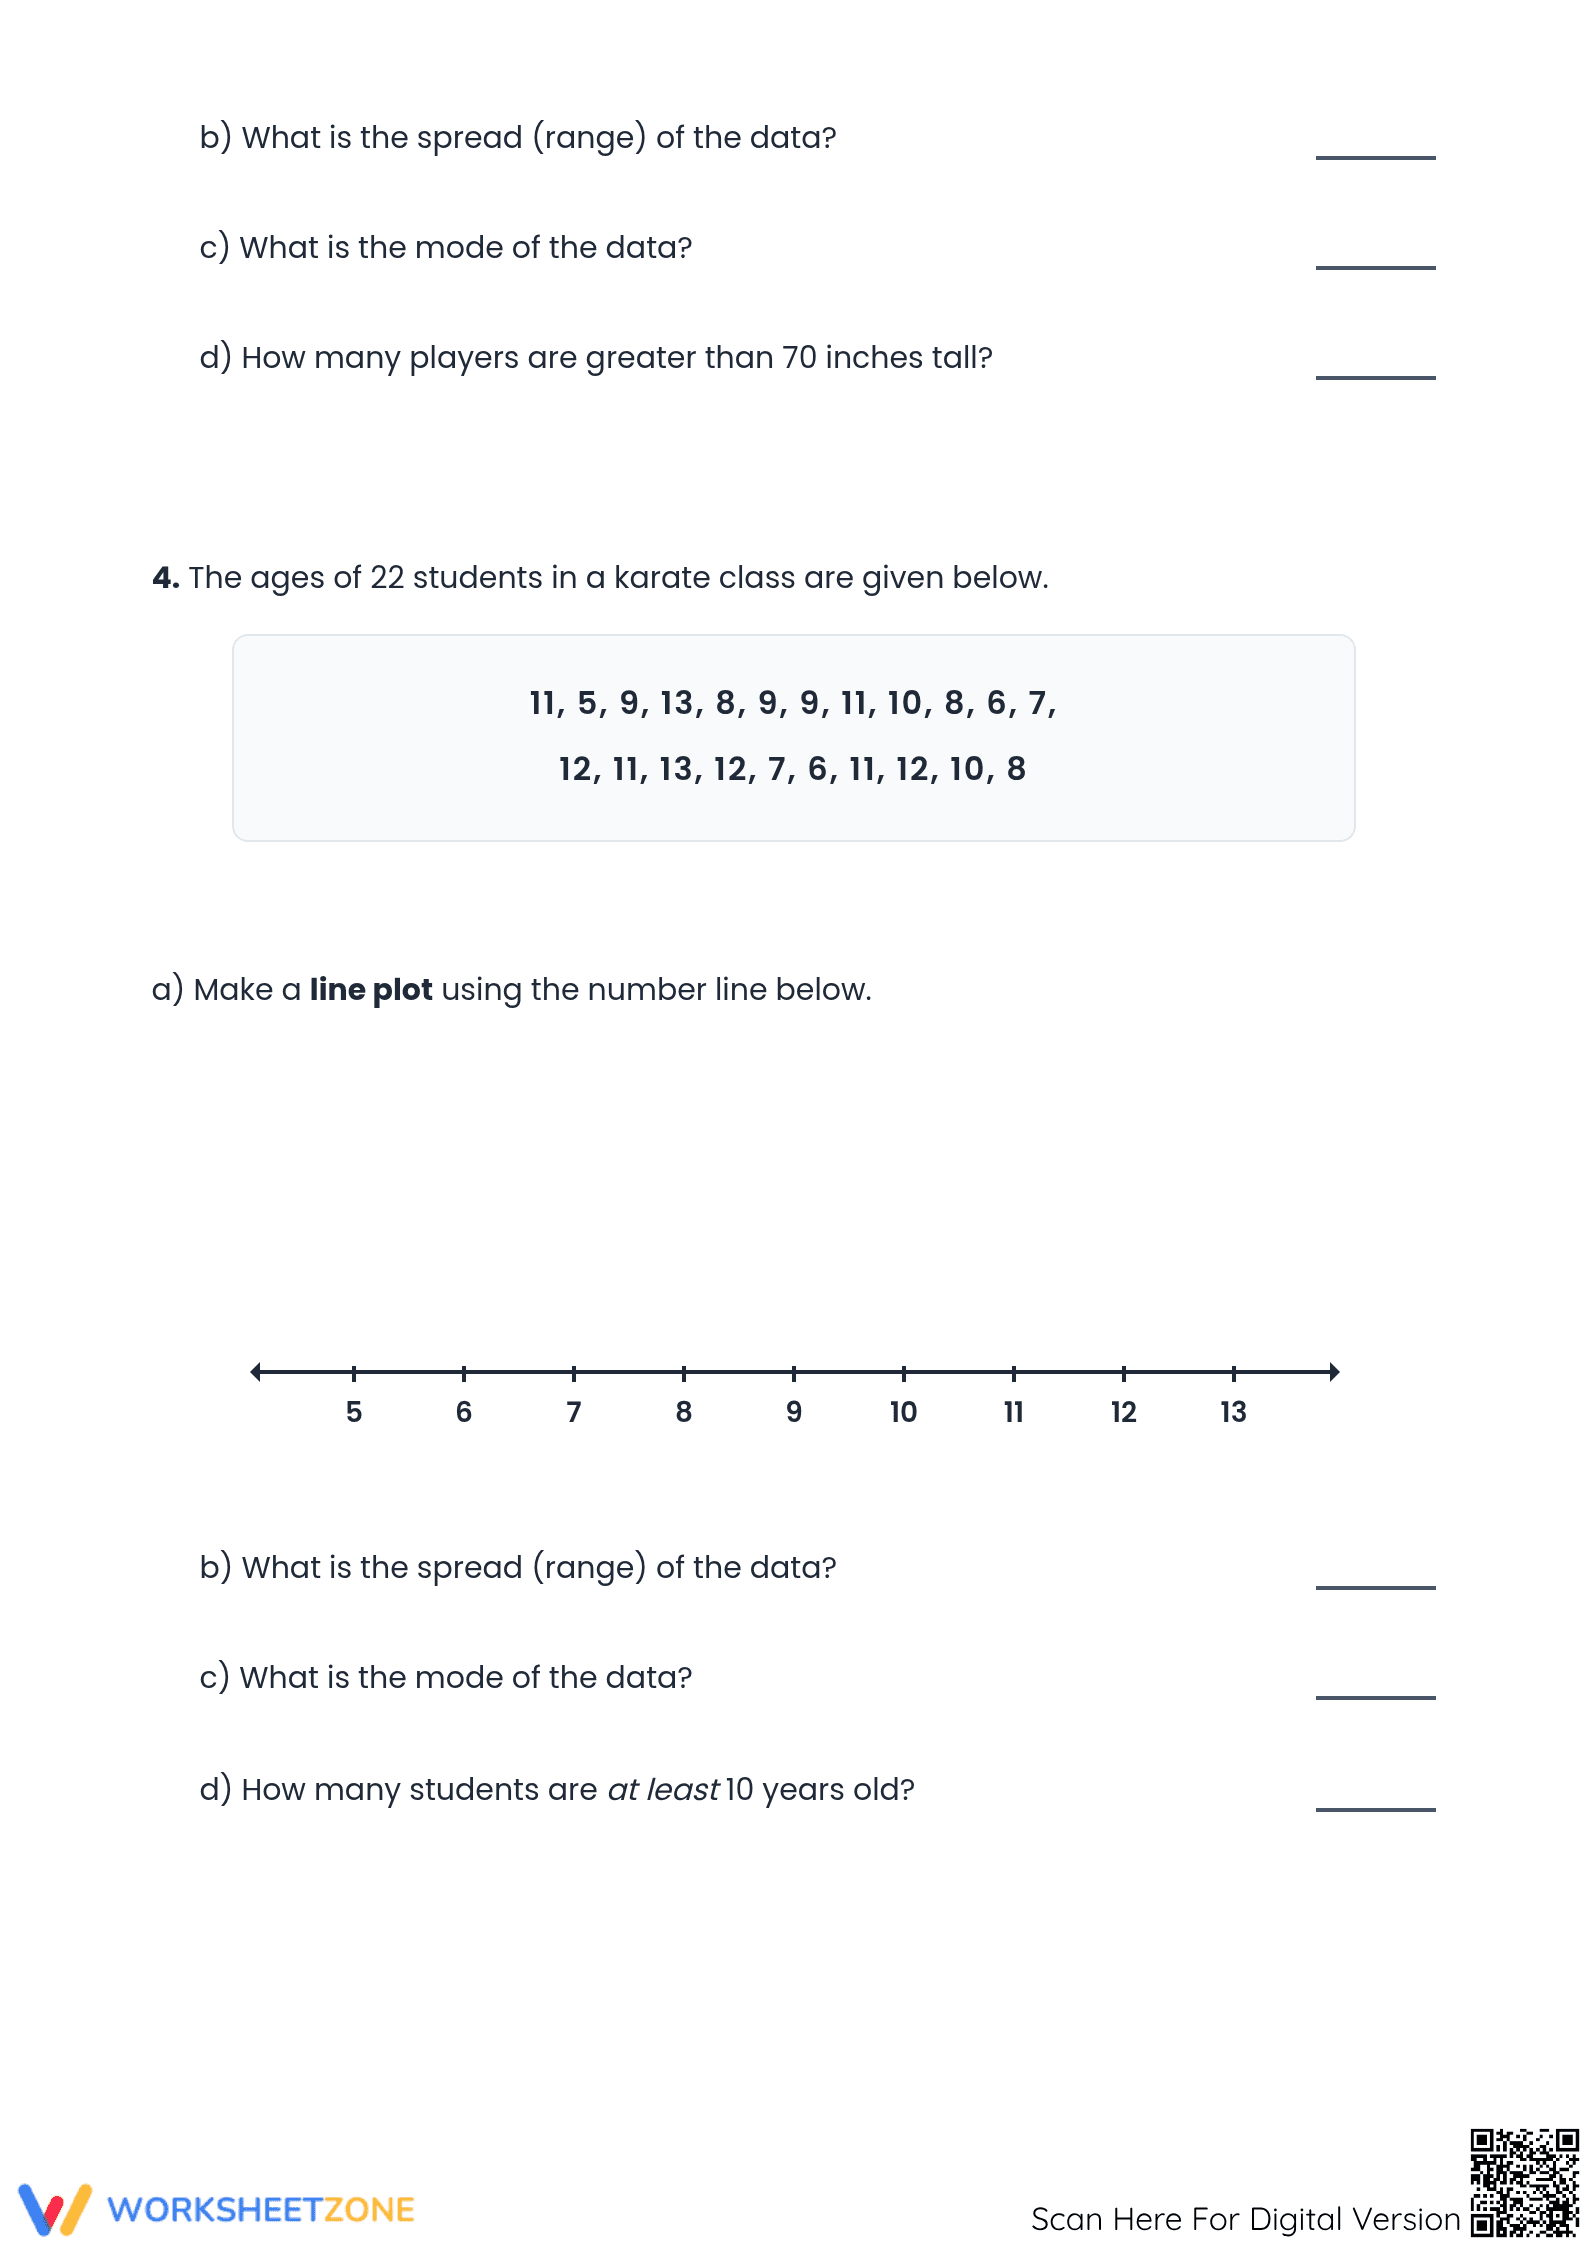
- Independent Practice: Learners process a final data set of karate student ages, performing independent calculations for range and mode while constructing a professional line plot.
This sequence follows a gradual-release model, moving from concrete interpretation to abstract data synthesis and analysis.
Standards Alignment
The primary focus of this worksheet is CCSS.6.SP.B.4, which mandates that students "display numerical data in plots on a number line, including dot plots." It also supports CCSS.6.SP.B.5.C by asking students to describe the nature of the attribute under investigation, including its range and measures of center. Both standard codes can be copied directly into lesson plans, IEP goals, or district curriculum mapping tools.
How to Use It
Teachers can utilize this worksheet as a mid-unit formative assessment after introducing the basic mechanics of number lines. For an effective instructional moment, have students complete the first page during direct instruction to check for misconceptions about "at least" versus "more than" language. One formative-assessment observation tip: watch for students who struggle to maintain consistent vertical spacing between dots, as this affects visual accuracy. Expected completion time ranges from 30 to 45 minutes depending on student familiarity with data sets.
Who It's For
This resource is tailored for sixth-grade general education students, though it serves as an excellent enrichment tool for fifth graders or a review for seventh-grade statistics units. The clear layouts and repetitive task structures provide scaffolding for English Language Learners and students with IEP accommodations. It pairs naturally with a classroom anchor chart detailing the differences between dot plots, bar graphs, and histograms.
Research conducted by Fisher & Frey (2014) emphasizes the importance of visual data representations, such as dot plots, in developing statistical literacy and critical thinking skills. This worksheet aligns with CCSS.6.SP.B.4, requiring students to display and interpret numerical data on number lines. By transitioning from simple frequency counts to complex data sets involving basketball heights and karate student ages, the resource builds a bridge between concrete observation and abstract analysis. According to NAEP frameworks, proficiency in data interpretation is a primary indicator of middle-school mathematical maturity. These exercises provide the repeated exposure necessary for students to internalize concepts of range, mode, and frequency distribution. Incorporating these printable tools into a regular curriculum helps bridge the gap between raw data collection and meaningful synthesis, ensuring students are prepared for more advanced statistical modeling in later grades.