


Views
Downloads

Essential Dot Plot Analysis Worksheet | Grade 6 Math
Paste this activity's link or code into your existing LMS (Google Classroom, Canvas, Teams, Schoology, Moodle, etc.).
Students can open and work on the activity right away, with no student login required.
You'll still be able to track student progress and results from your teacher account.
This Dot Plot Analysis worksheet empowers students to master statistical data interpretation through real-world scenarios. By engaging with four data sets, learners develop the ability to read, analyze, and extract insights from numerical displays. This printable resource ensures students can calculate frequency, identify modes, and determine statistical ranges in a classroom-ready format.
At a Glance
- Grade: 6 · Subject: Math
- Standard:
CCSS.MATH.CONTENT.6.SP.B.4— Display numerical data in plots on a number line, including dot plots- Skill Focus: Data Interpretation & Statistical Measures
- Format: 5 pages · 20 problems · Answer key included · PDF
- Best For: Middle school data literacy unit practice
- Time: 35–45 minutes
What's Inside
This 5-page PDF contains four scenarios: Cookie Party Survey, Sleep Patterns, Pencil Collection, and Sibling Survey. Each provides a dot plot or data summary followed by targeted questions. The worksheet features 20 problems requiring students to find totals, identify the mode, calculate the range, and interpret conditions within data sets. A full answer key is included for rapid grading and student self-correction.
Skill Progression
- Guided Practice: Scenario 1 provides guided practice using visual dot plots for six frequency and mode questions.
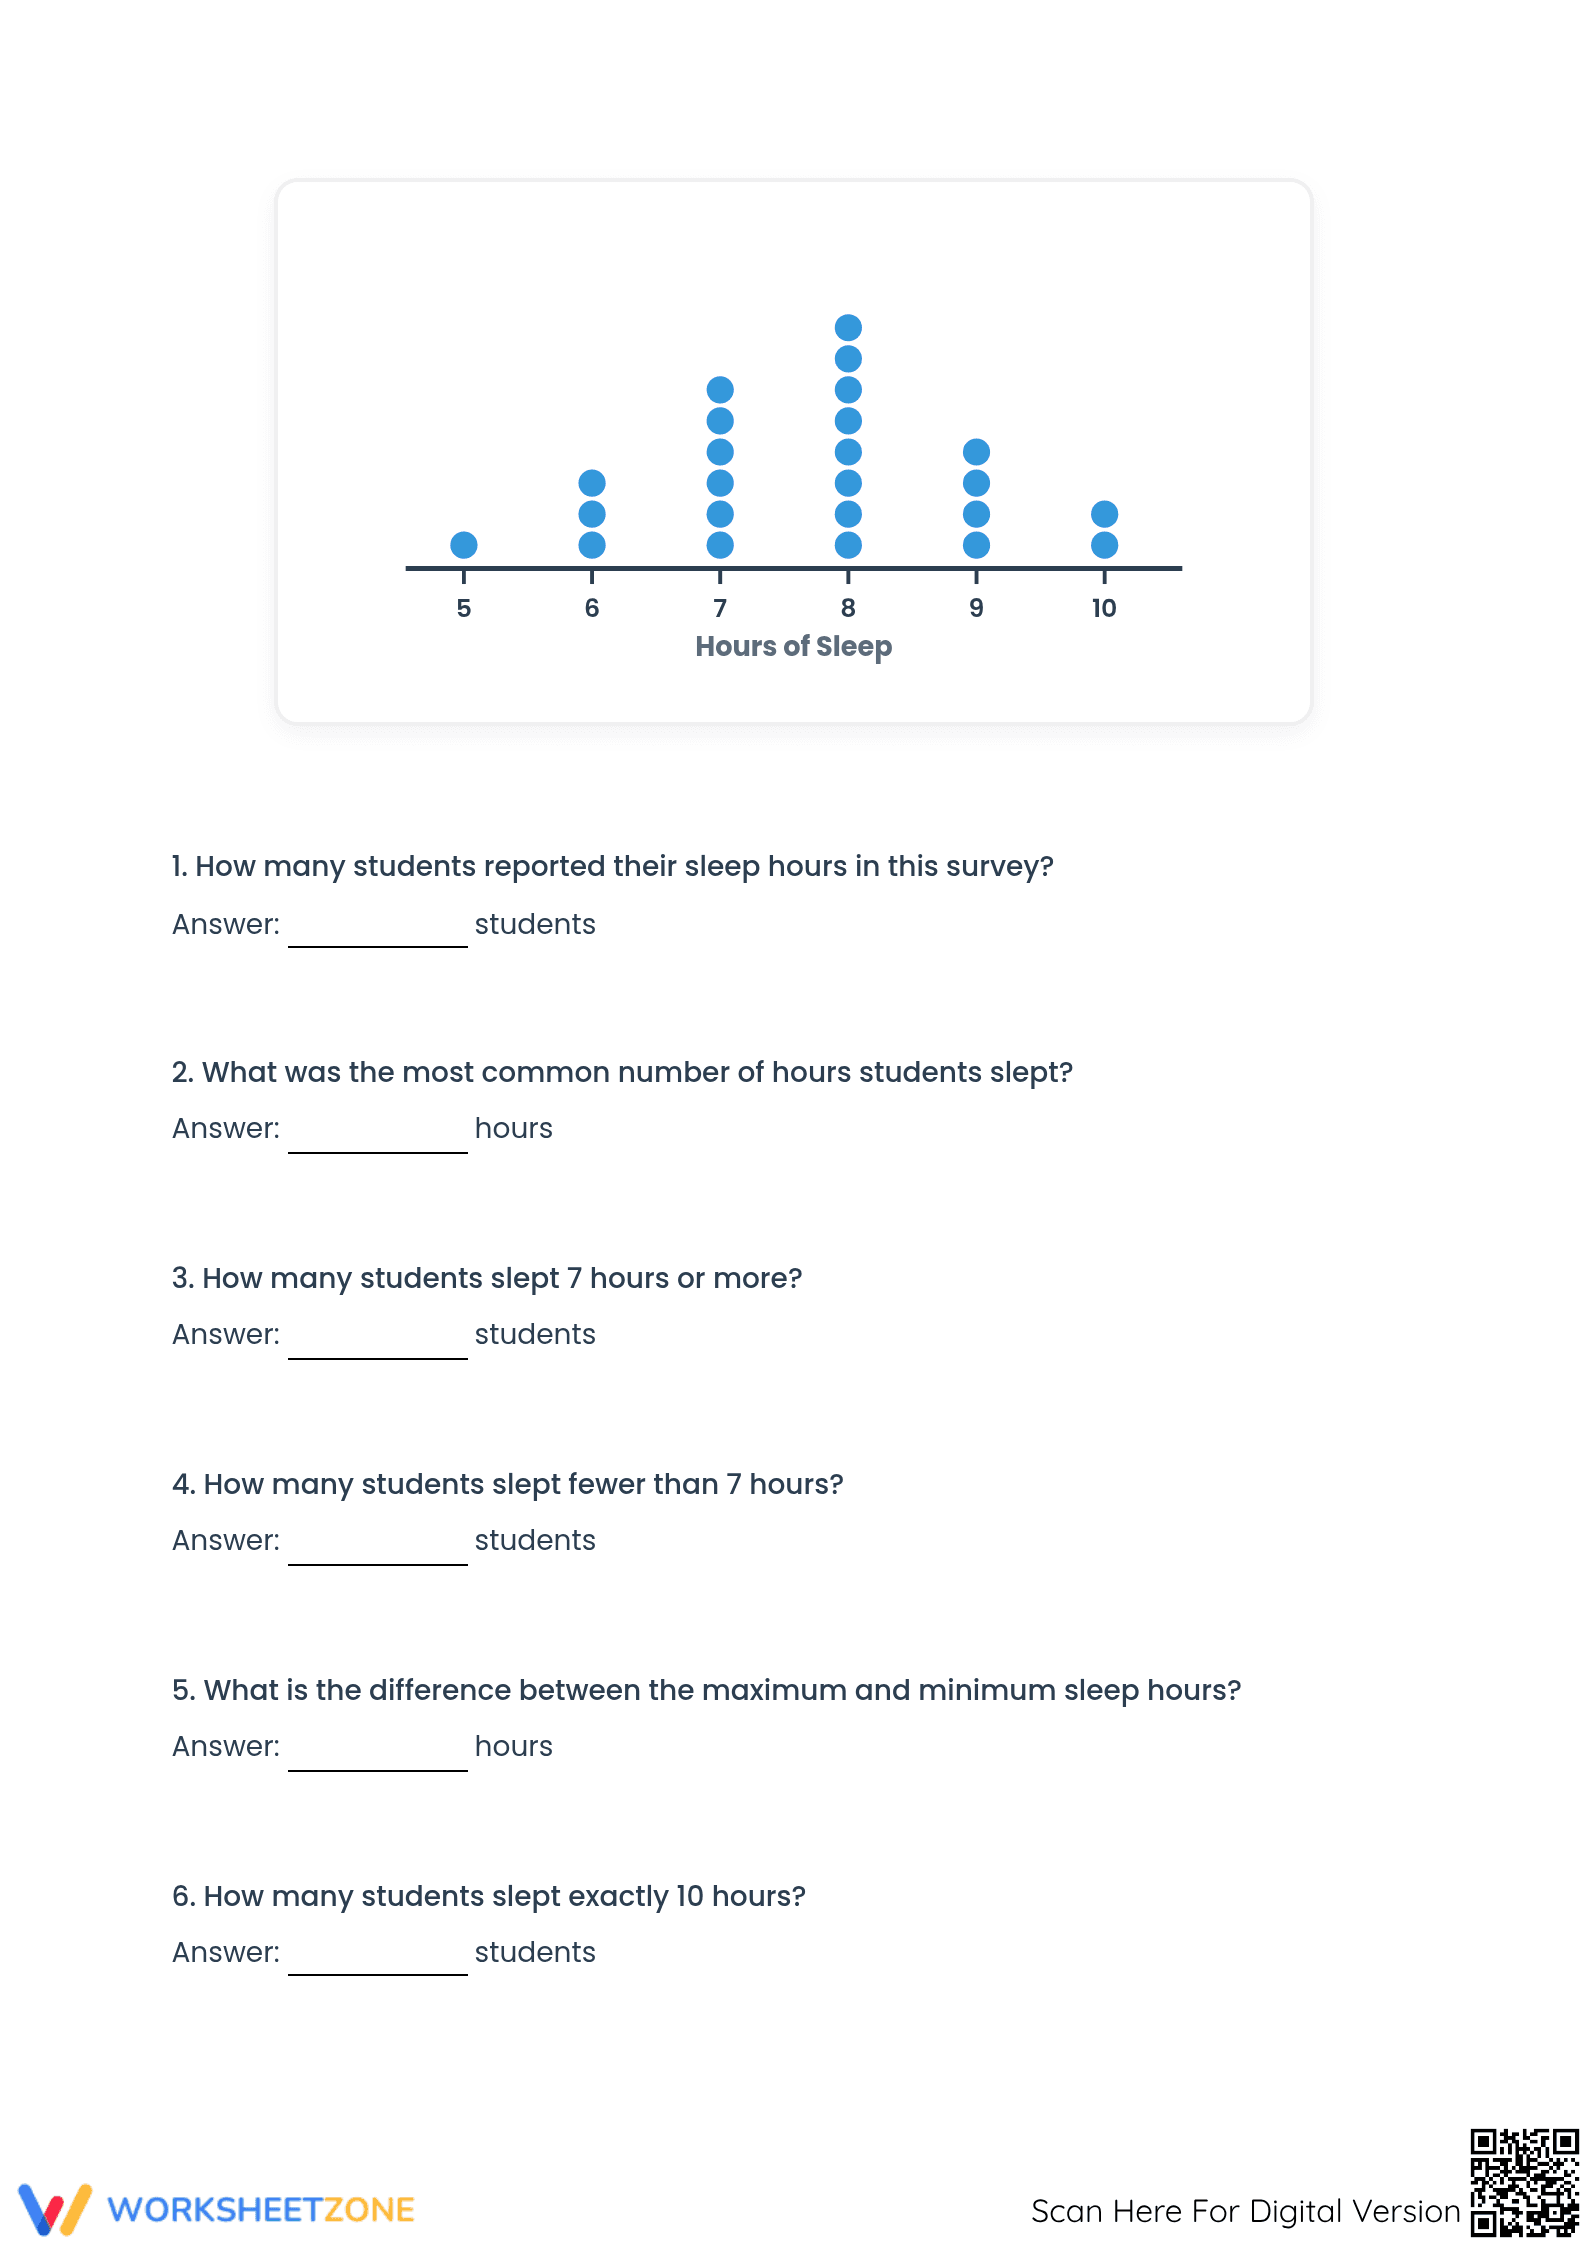
- Supported Practice: Scenario 2 offers supported practice, challenging students to apply range calculations to sleep patterns.
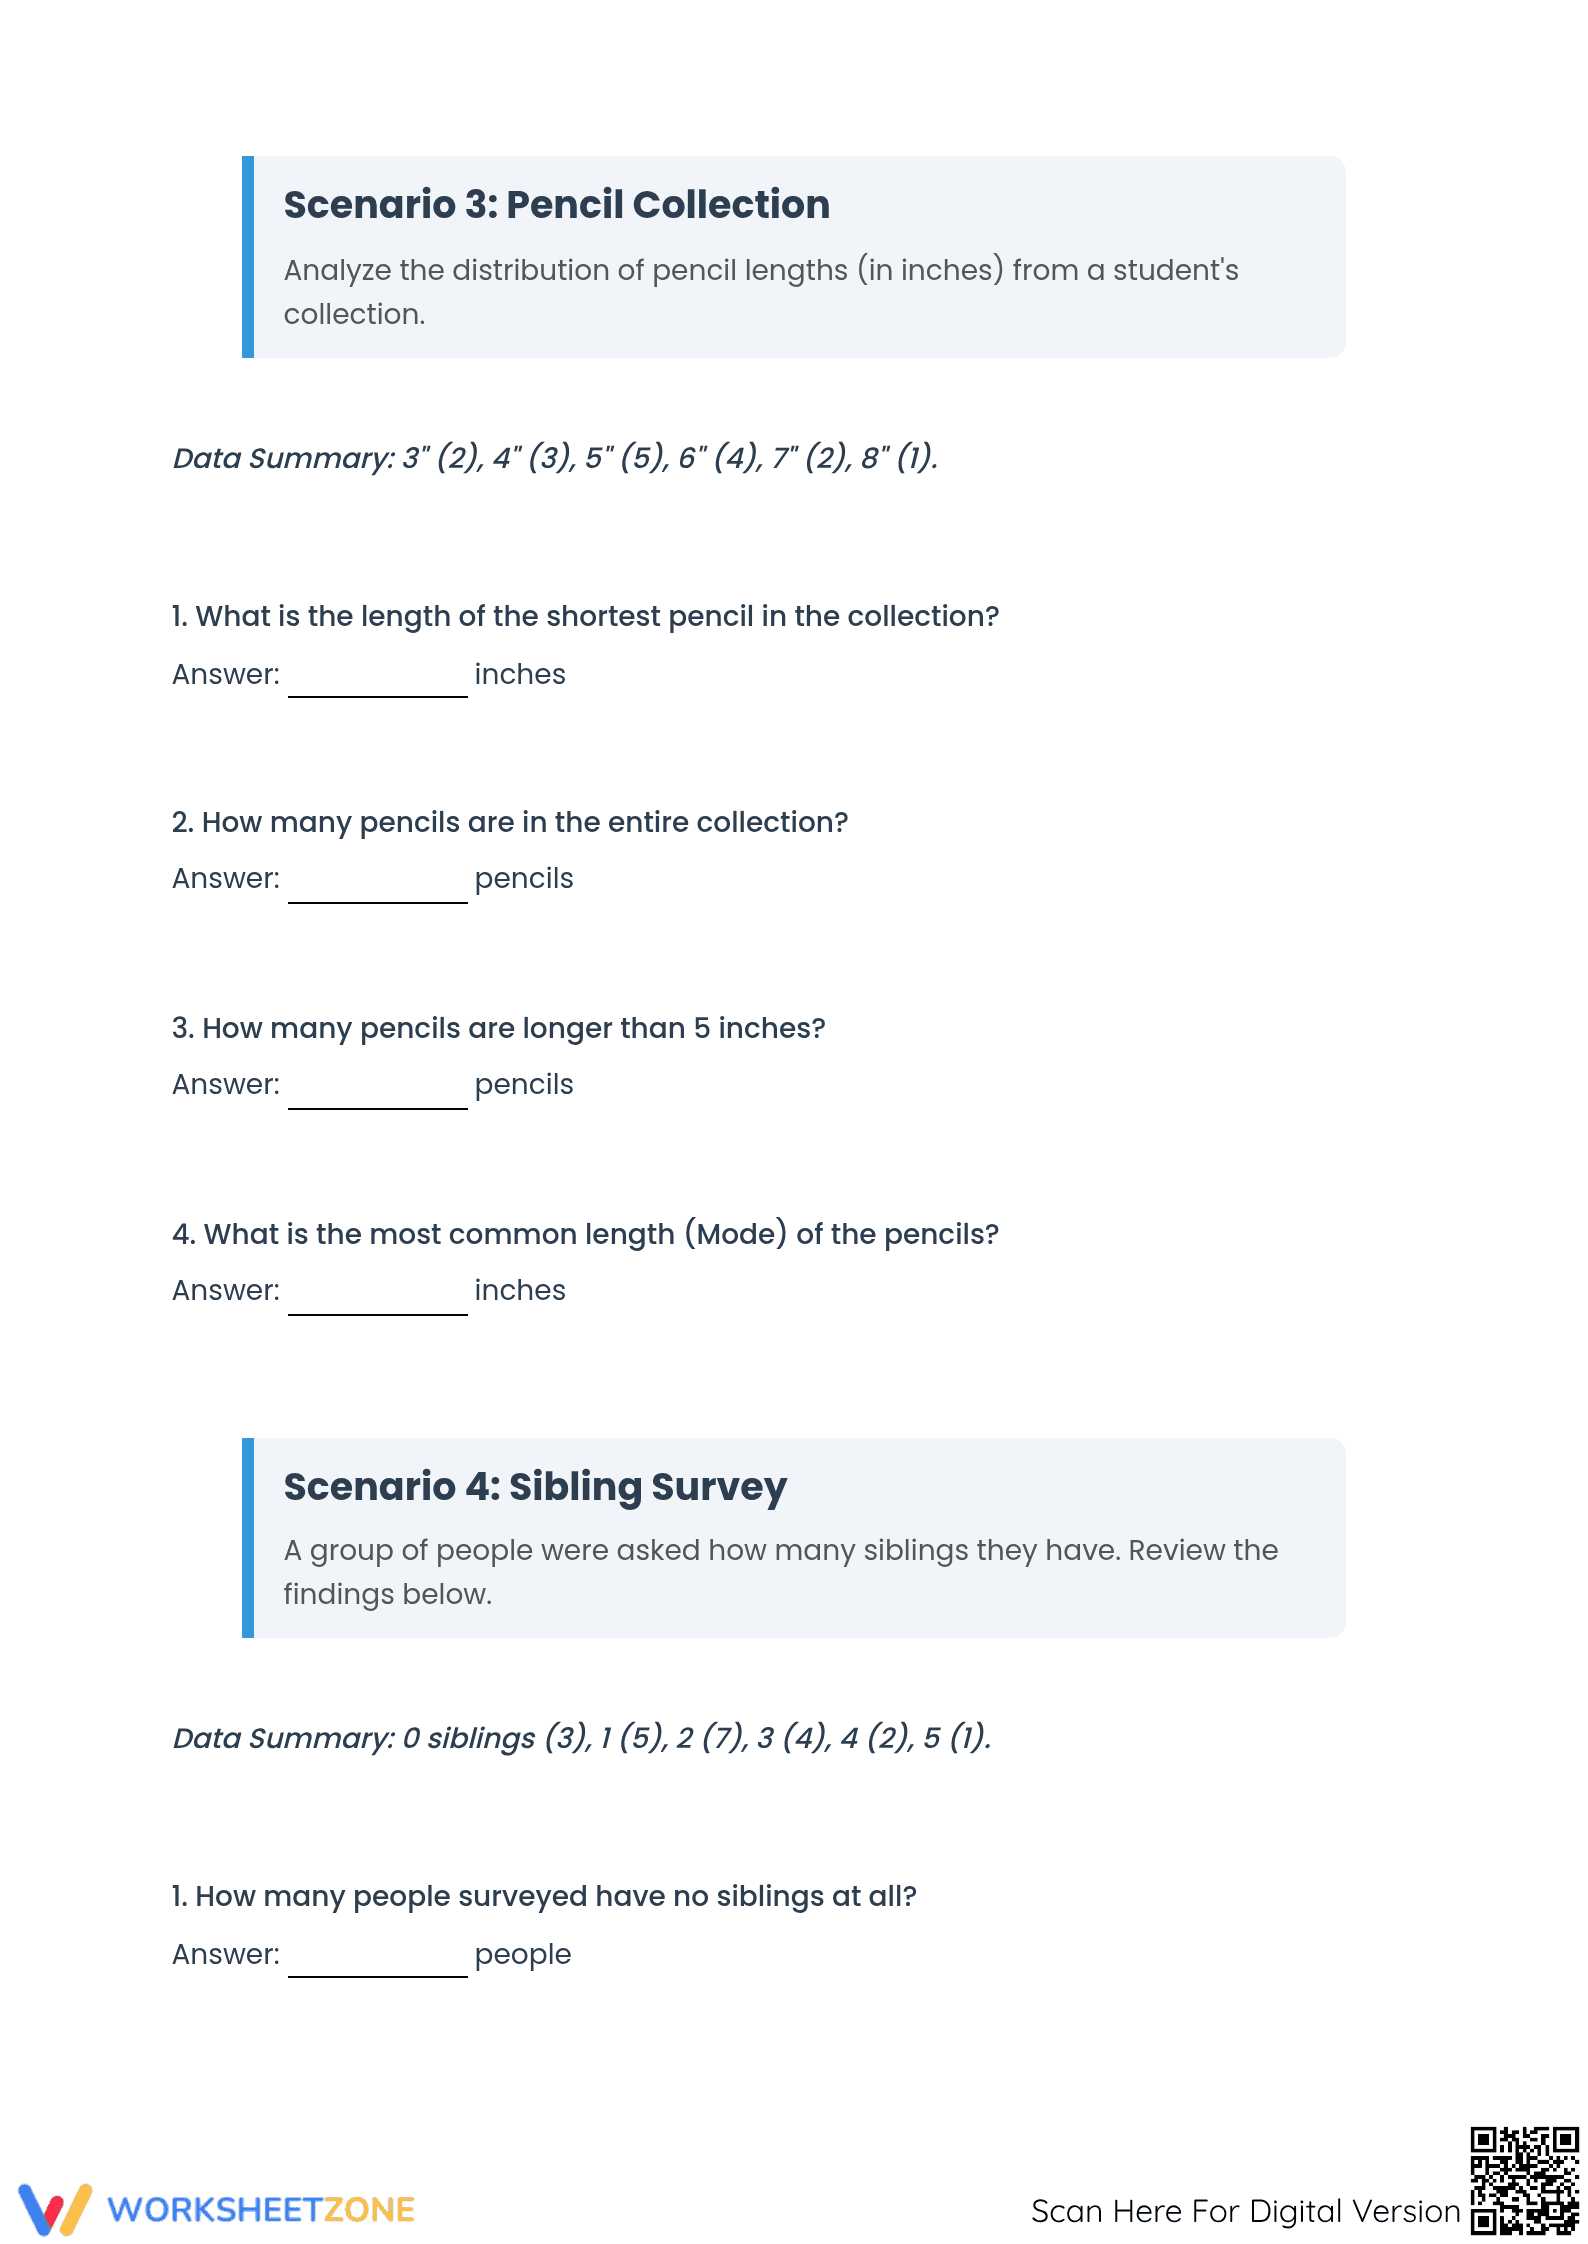
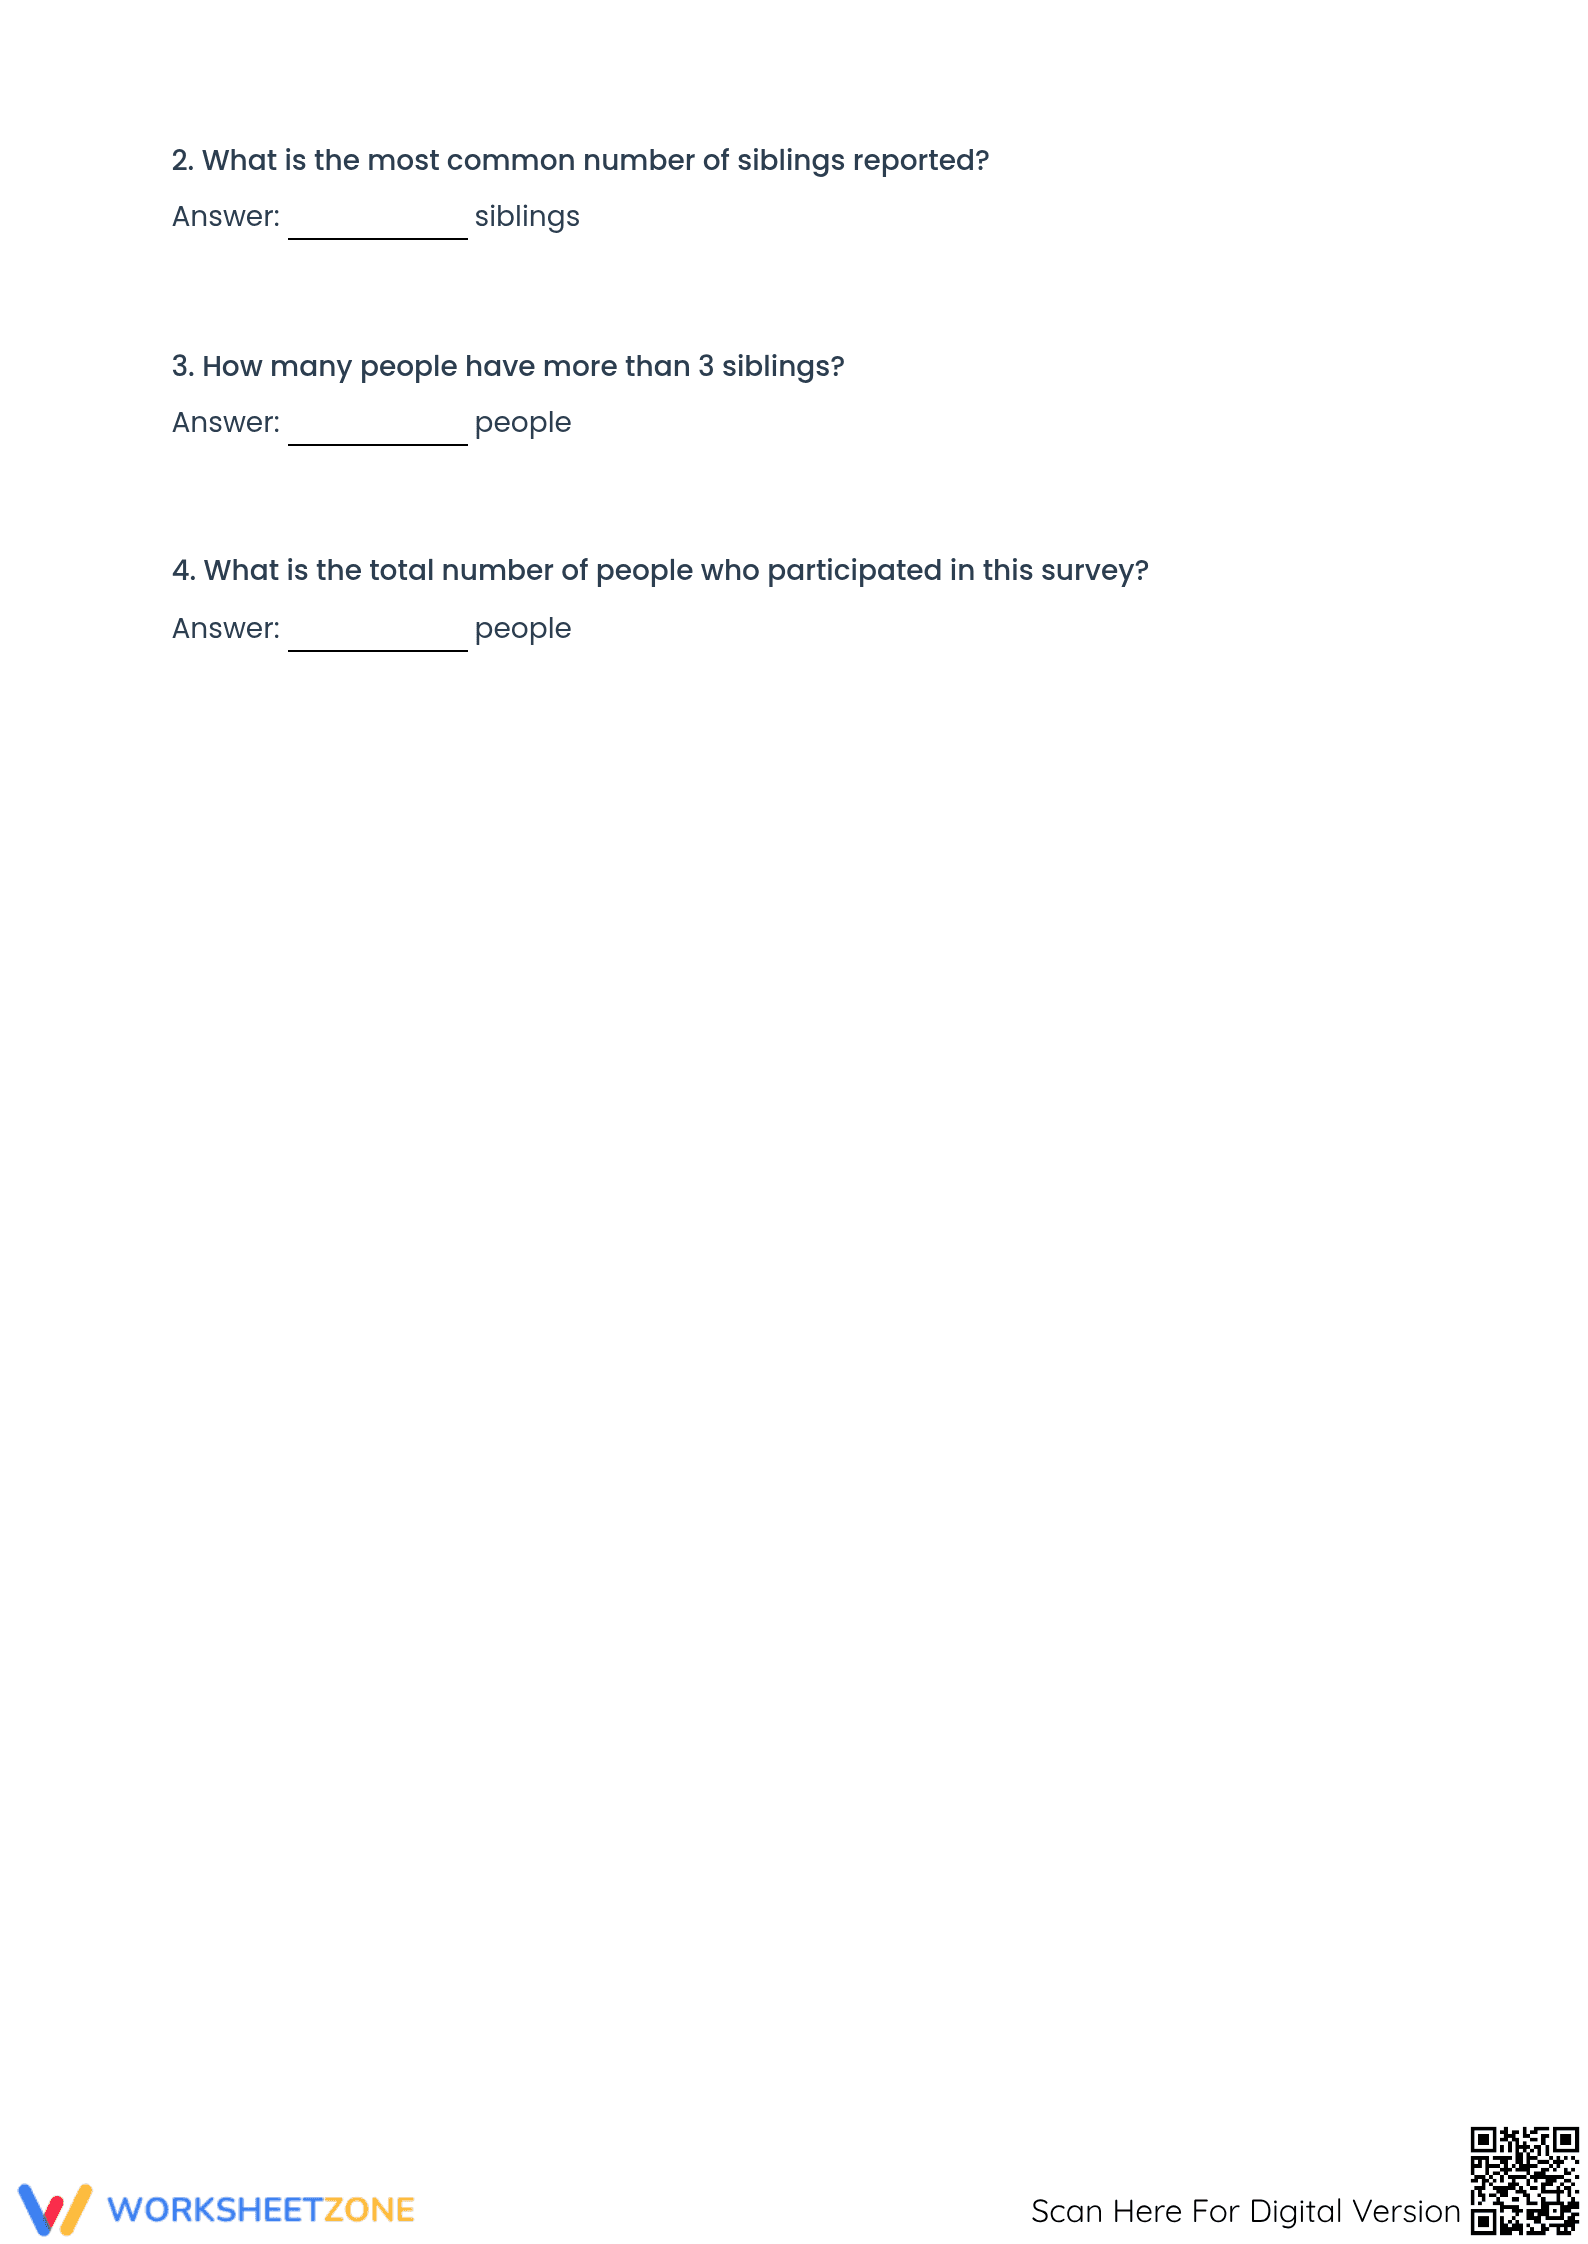
- Independent Practice: Scenarios 3 and 4 require independent practice, where students translate text-based data summaries into solutions.
This gradual-release approach ensures students move from basic decoding to higher-order data synthesis effectively, following the I Do, We Do, You Do instructional model.
Standards Alignment
This resource is aligned to CCSS.MATH.CONTENT.6.SP.B.4, requiring students to display numerical data in plots on a number line. It also supports CCSS.MATH.CONTENT.6.SP.B.5 by asking students to summarize numerical data sets in context. Both standard codes can be copied directly into lesson plans, IEP goals, or district curriculum mapping tools to ensure instructional alignment.
How to Use It
Use this worksheet as a primary practice activity during your statistics unit. It serves as an excellent formative assessment tool; observe if students correctly identify the range as a single number versus a span. The expected completion time is 40 minutes, making it ideal for a single class period or a comprehensive homework assignment that reinforces direct instruction on data displays.
Who It's For
This resource is designed for Grade 6 students but works for Grade 5 enrichment or Grade 7 intervention. It is ideal for learners who benefit from concrete math problems. Pair this worksheet with a short video or a classroom "human dot plot" activity to provide a tactile anchor for the statistical concepts presented.
Mastering dot plots is a foundational component of middle school data literacy, serving as the essential bridge between simple counting and complex statistical modeling. According to the NAEP (National Assessment of Educational Progress) framework, the ability to summarize and describe the distribution of a data set is a critical indicator of mathematical proficiency in the sixth grade. This printable worksheet directly addresses this need by providing 20 rigorous problems aligned to CCSS.MATH.CONTENT.6.SP.B.4, focusing on the plain-English skill of displaying and interpreting numerical data on a number line. Research from the ScienceDirect TpT Analysis (2024) suggests that contextualized data sets, such as cookie surveys or sleep patterns, significantly increase student engagement and long-term retention of measures like mode and range. Educators can integrate this resource into their curriculum to provide evidence-based practice that builds the fluency required for high-school statistics.