


Views
Downloads
Printable Dot Plot Dice Roll Worksheet | Grade 4-5 Math
Paste this activity's link or code into your existing LMS (Google Classroom, Canvas, Teams, Schoology, Moodle, etc.).
Students can open and work on the activity right away, with no student login required.
You'll still be able to track student progress and results from your teacher account.
This comprehensive 4-page math resource engages students in the hands-on process of data collection and visual representation using dot plots. By rolling different types of dice, students generate their own data sets, bridging the gap between abstract probability and concrete statistical modeling while mastering the foundational skills required for upper elementary data analysis.
At a Glance
- Grade: 4–5 · Subject: Math
- Standard:
CCSS.MATH.CONTENT.4.MD.B.4— Make a line plot to display a data set of measurements- Skill Focus: Data collection and representation
- Format: 4 pages · 12 tasks · Answer key included · PDF
- Best For: Small group math centers or assessment
- Time: 35–45 minutes
What's Inside: This PDF includes three distinct activity sections that progress in complexity. Each section features a dedicated tally mark recording area, a structured dot plot graph with labeled axes, and a data analysis suite. The packet covers standard 6-sided dice, 10-sided dice, and 12-sided dice to provide a wide range of data variability and frequency observations.
Skill Progression
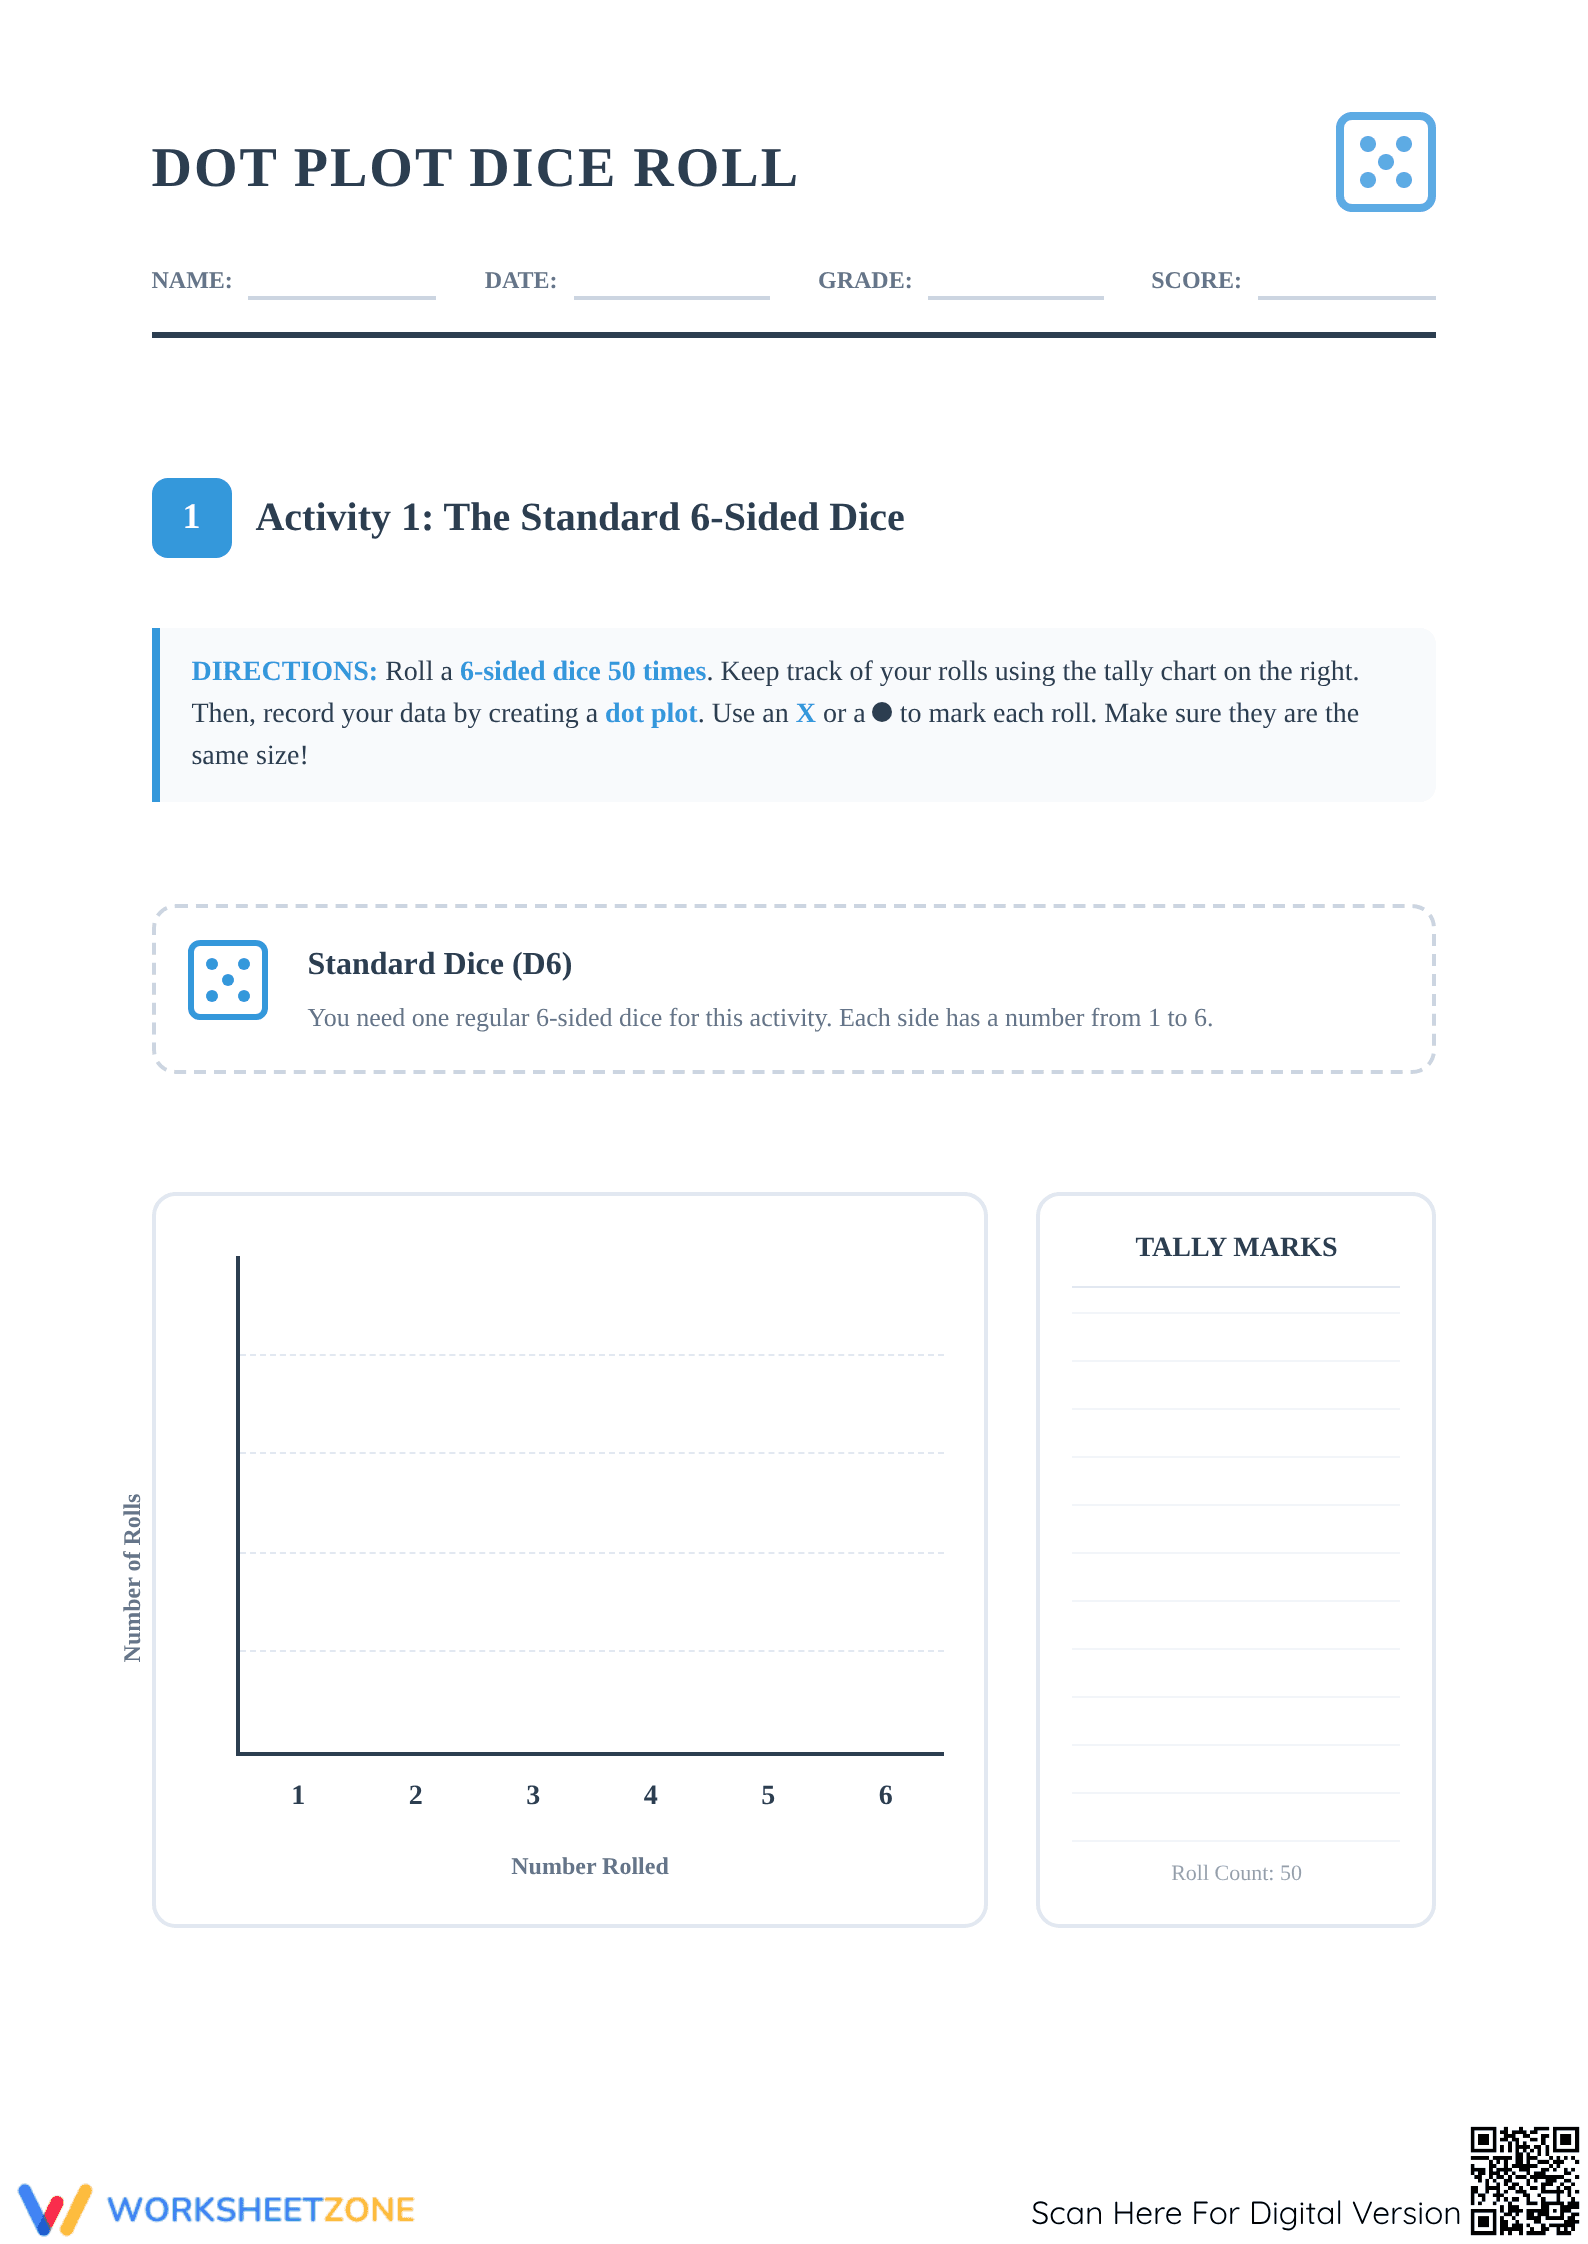
- Guided Practice: Activity 1 utilizes a standard 6-sided dice (D6) for 50 rolls, allowing students to establish a baseline for dot plot creation with a limited range of outcomes.
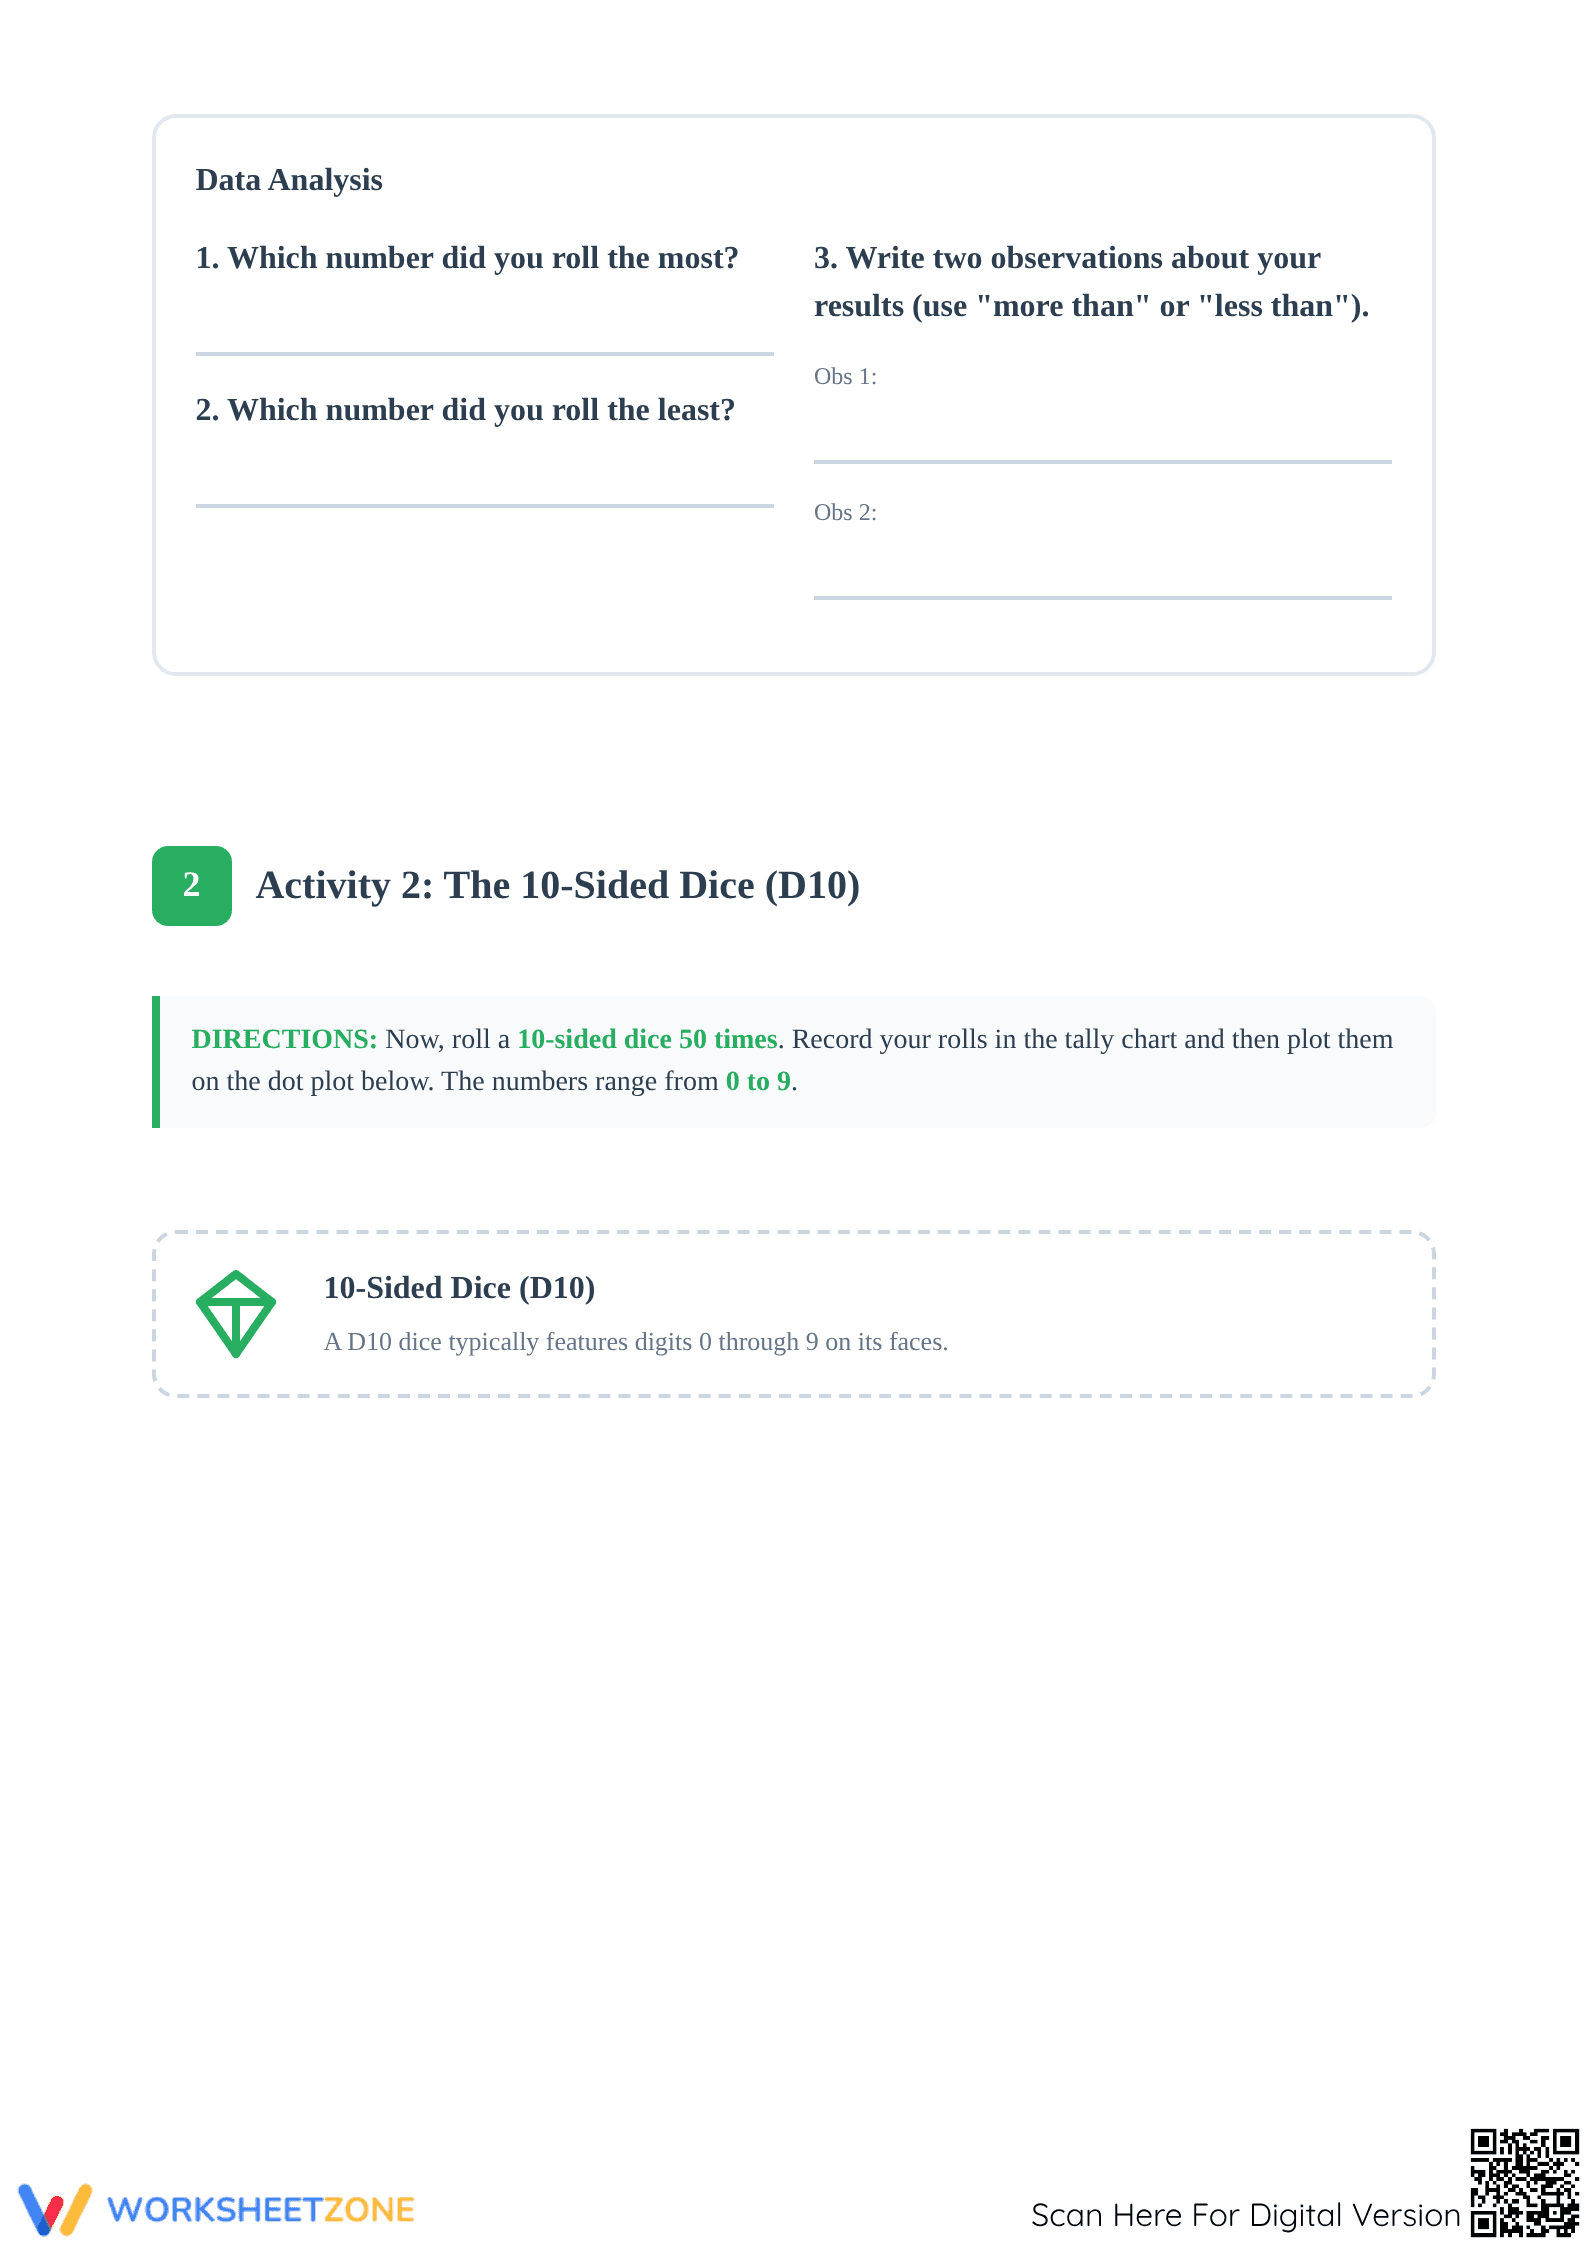
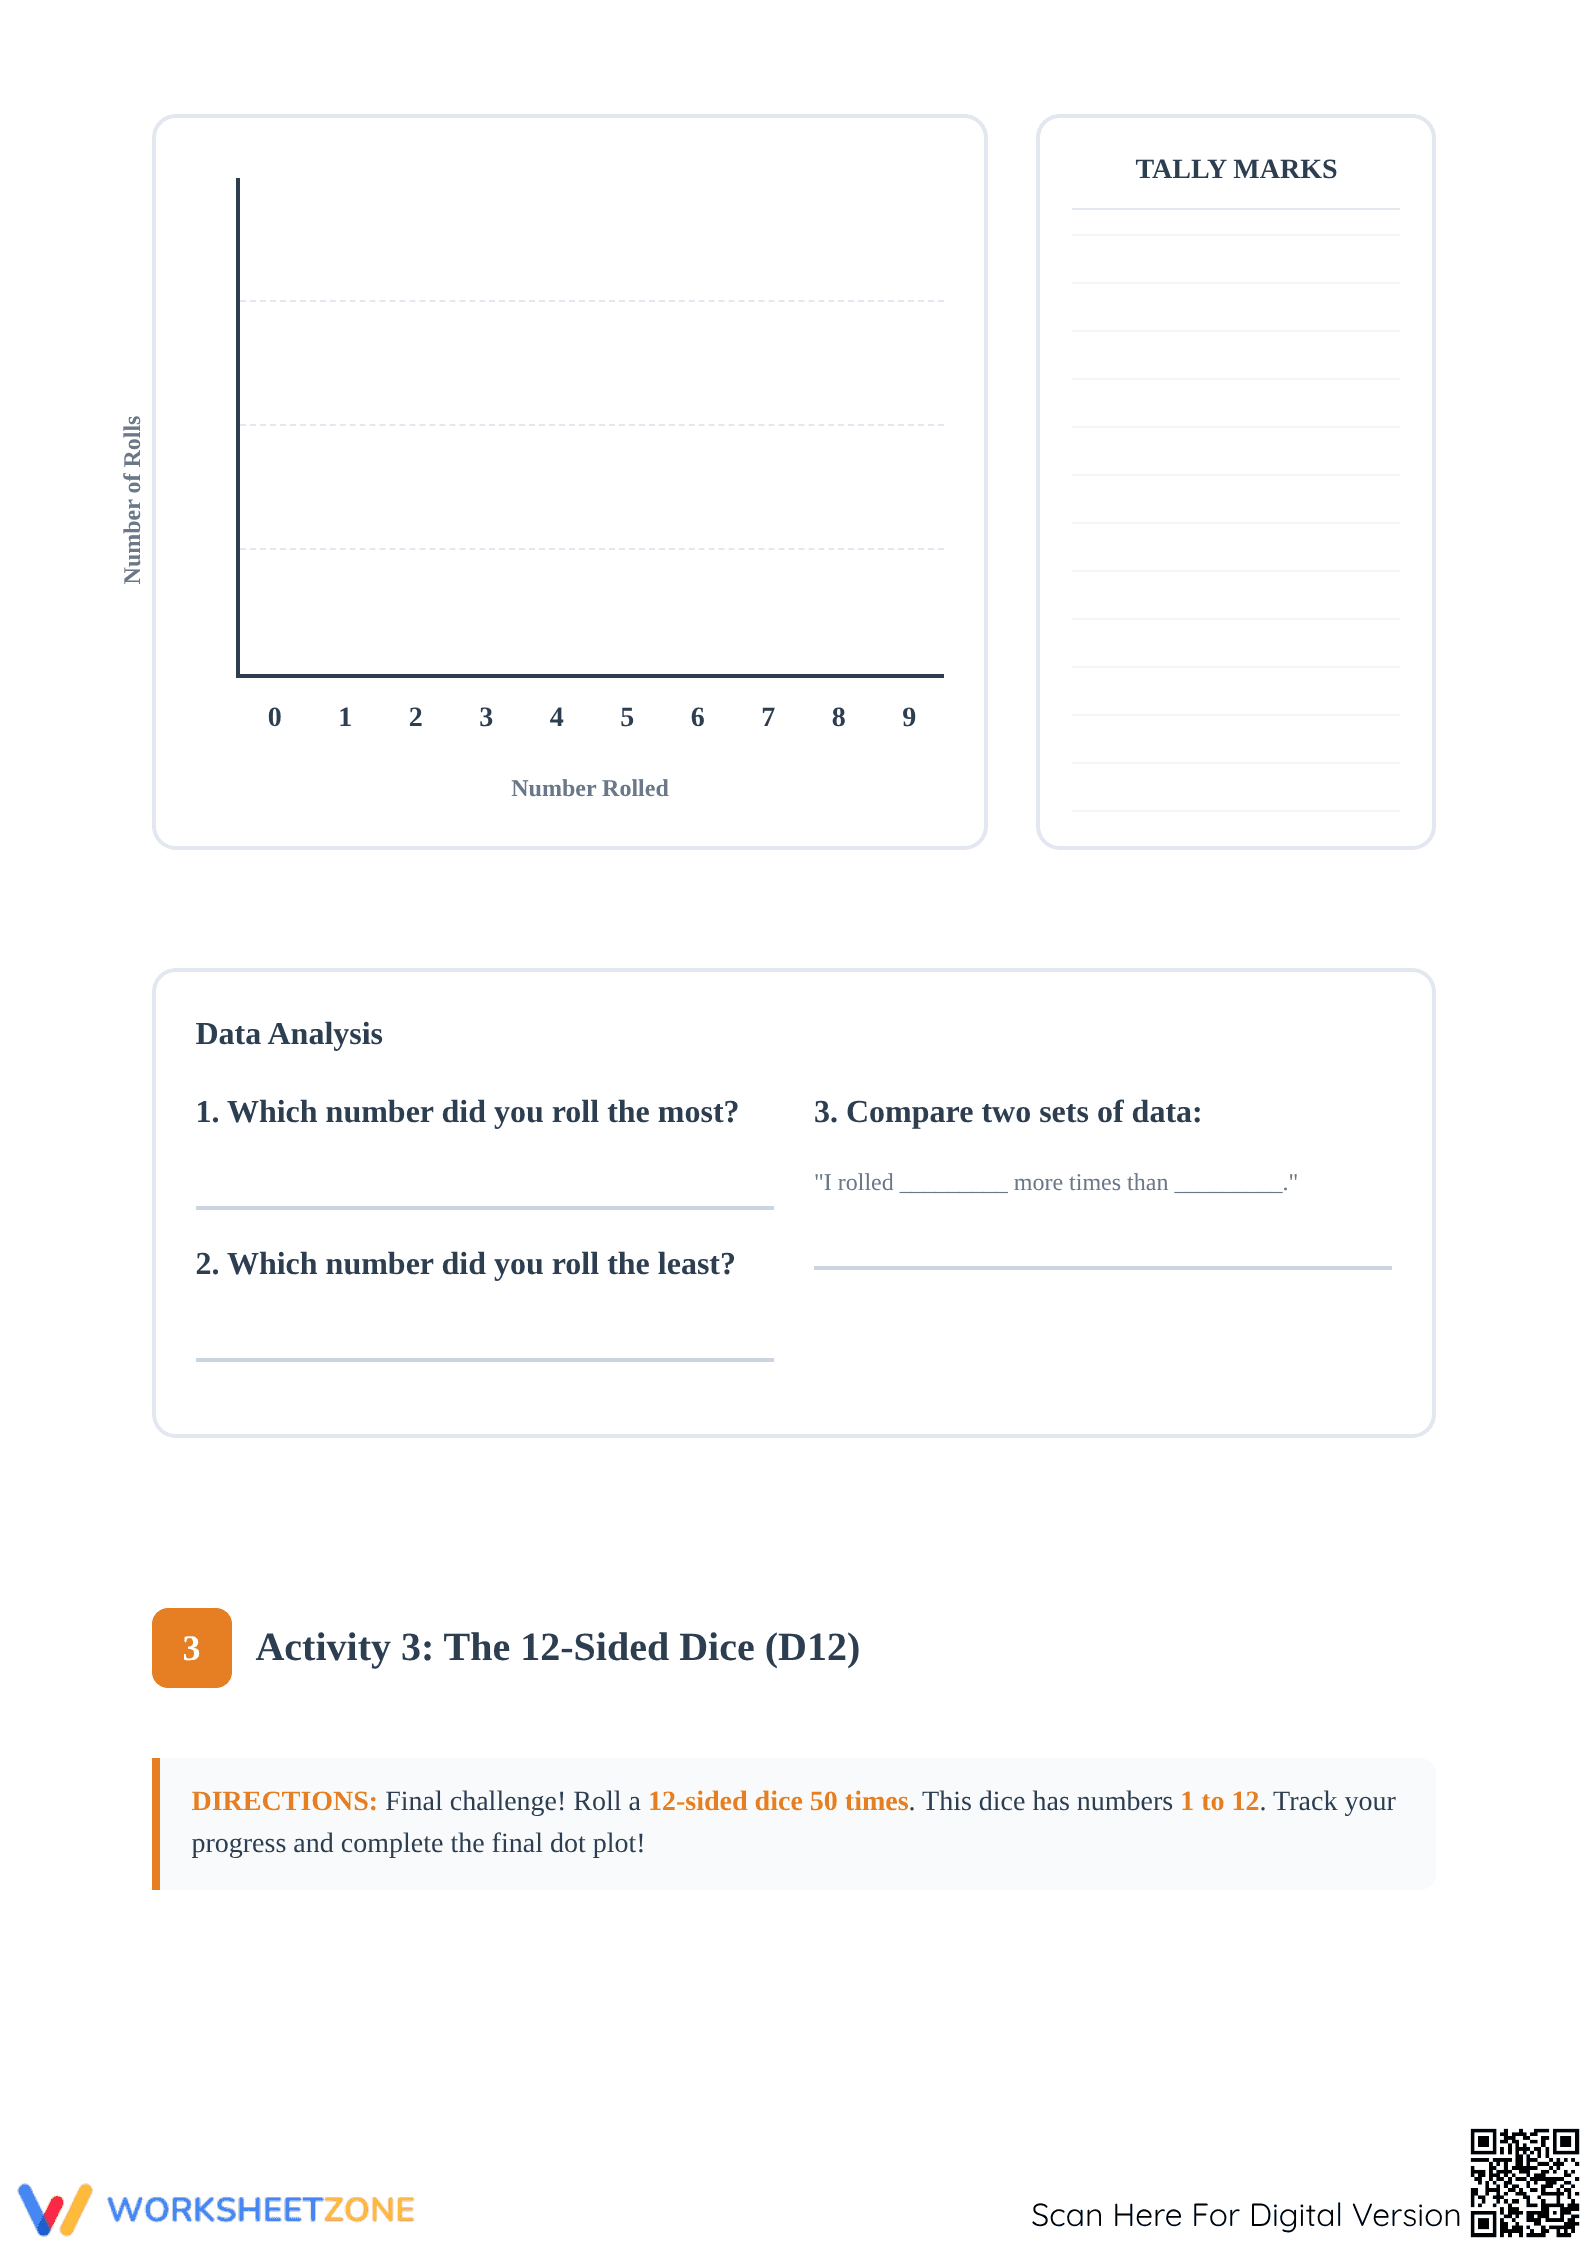
- Supported Practice: Activity 2 expands the scope to a 10-sided dice (D10), requiring students to manage a larger data range (0–9) and perform more complex comparative observations.
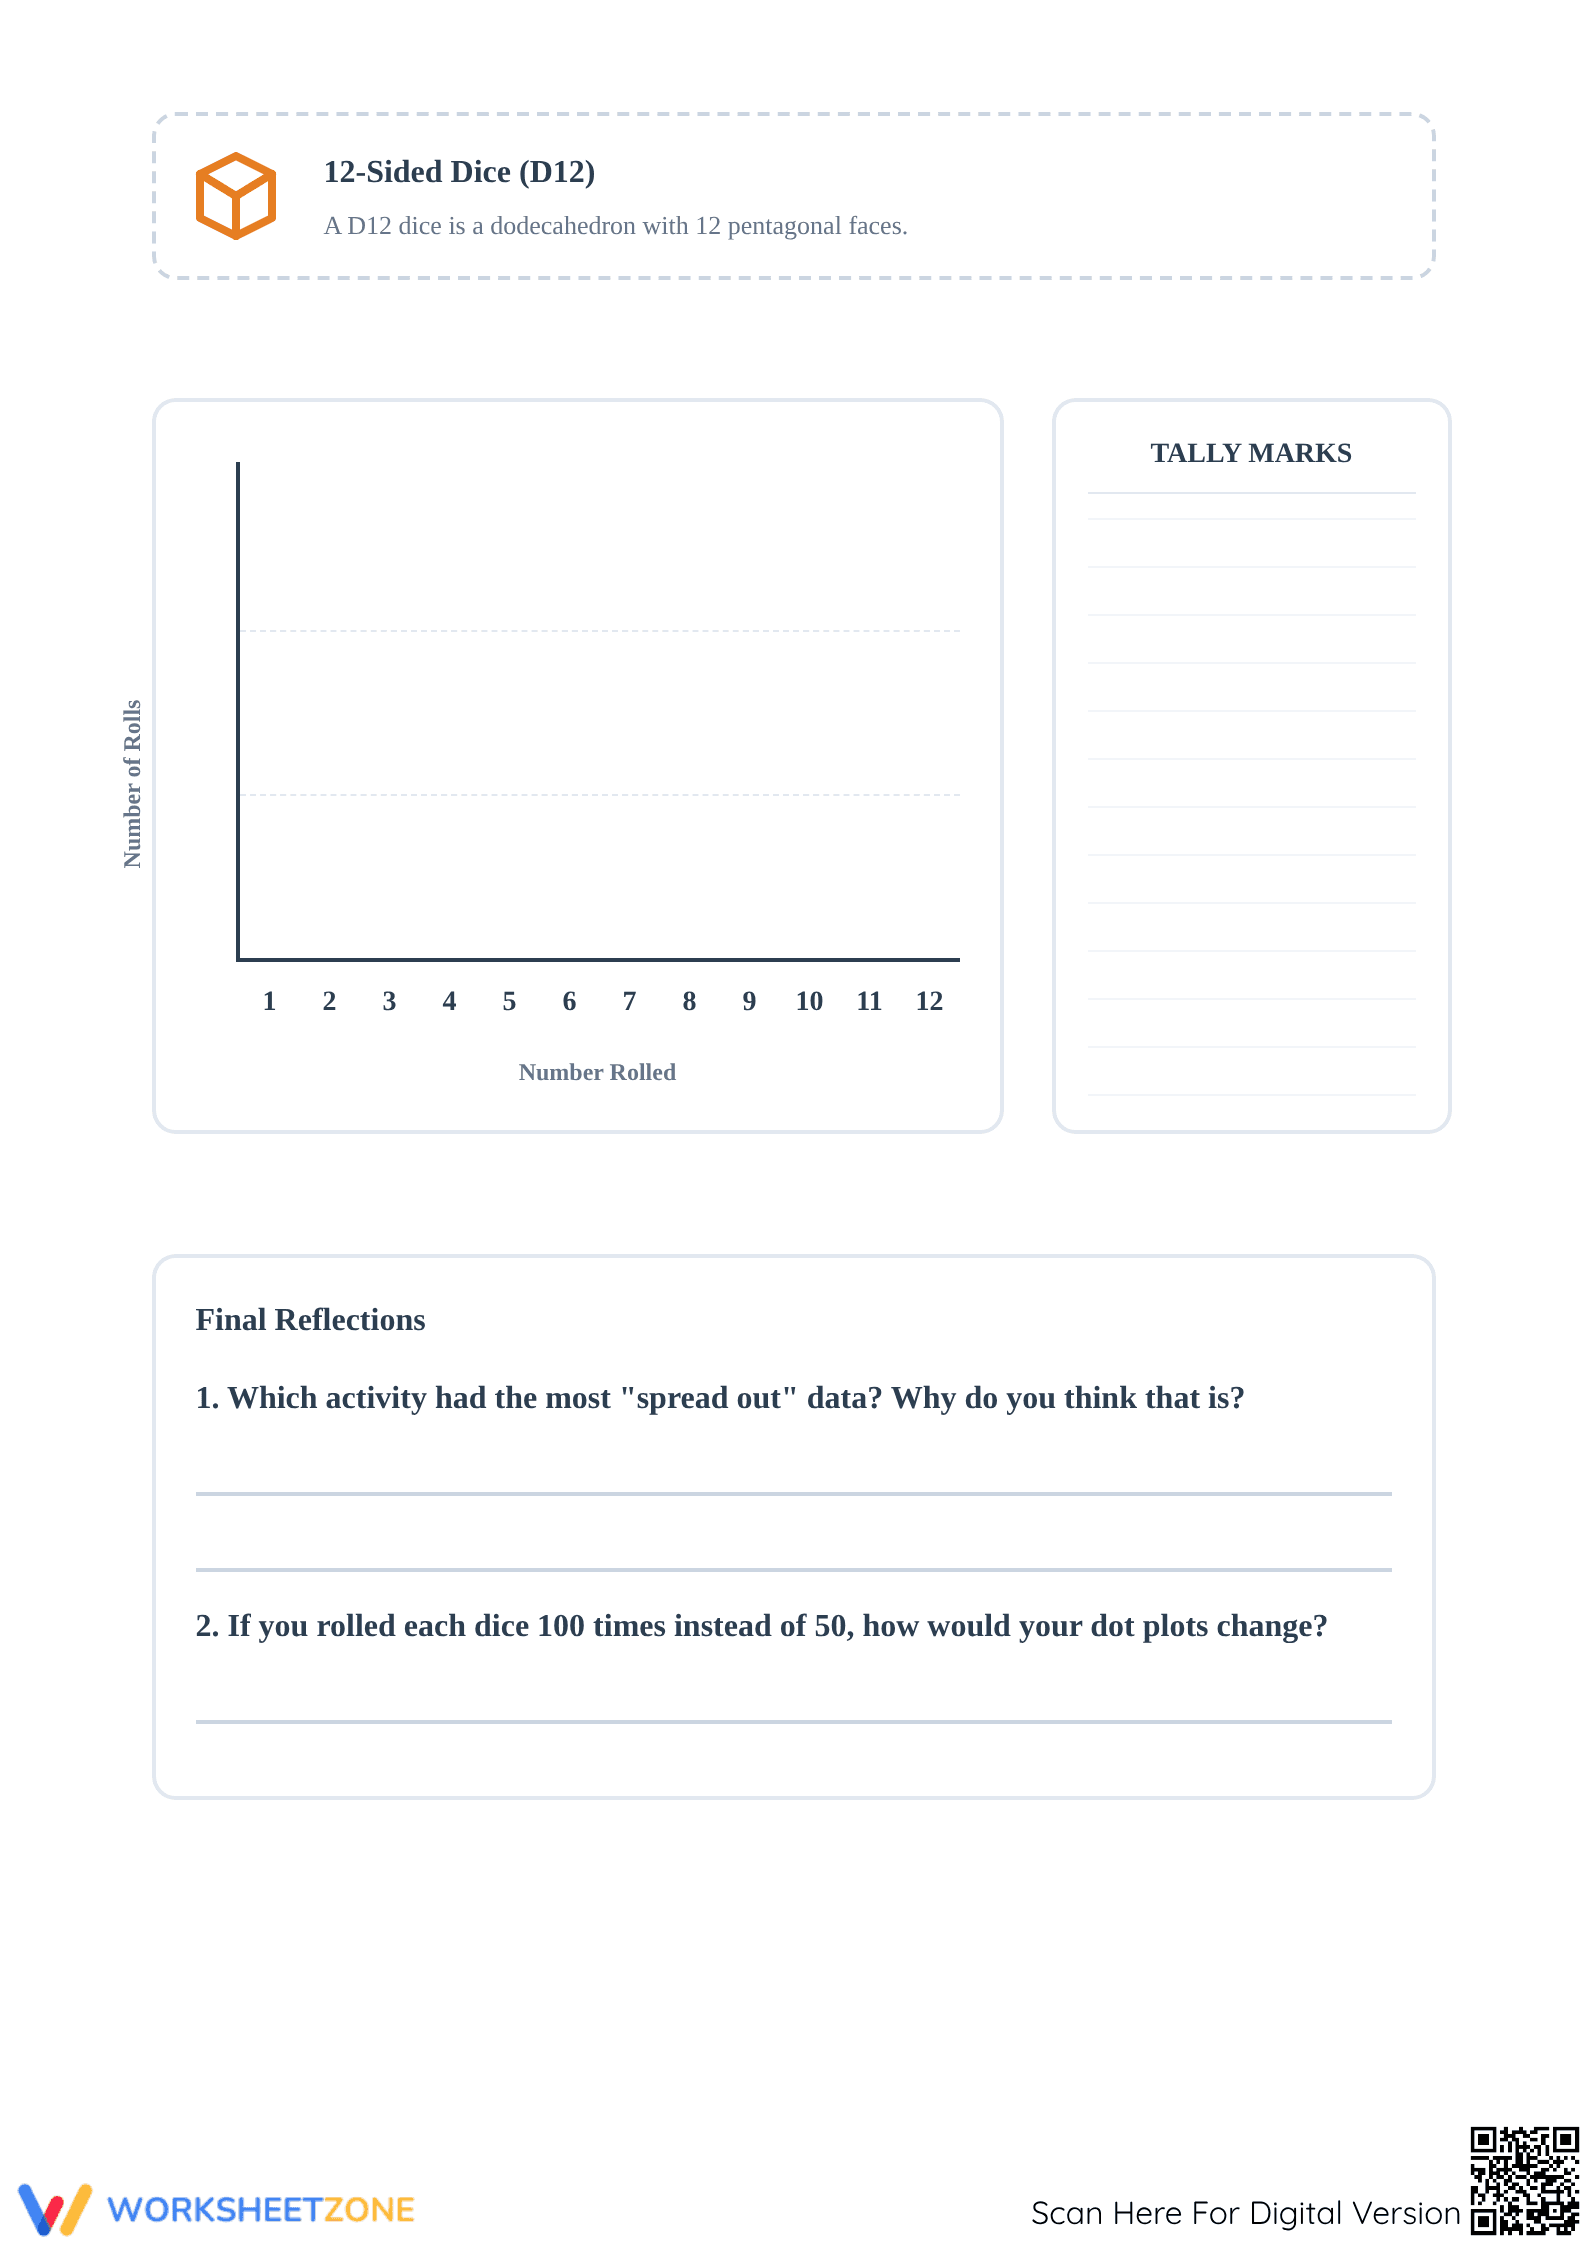
- Independent Practice: Activity 3 challenges students with a 12-sided dice (D12) and final reflections that ask them to synthesize their findings across all three probability experiments.
This sequence follows a gradual-release model, ensuring students master the mechanics of plotting before moving to higher-order analysis.
Standards Alignment: This resource is primarily aligned to CCSS.MATH.CONTENT.4.MD.B.4: "Make a line plot to display a data set of measurements in fractions of a unit (1/2, 1/4, 1/8). Solve problems involving addition and subtraction of fractions by using information presented in line plots." While these activities focus on whole number frequencies, they provide the essential scaffolding for plotting fractional data. Both standard codes can be copied directly into lesson plans, IEP goals, or district curriculum mapping tools.
How to Use It: Integrate this worksheet during your data and measurement unit as a station-based rotation. Students can work in pairs, with one person rolling and the other recording, to foster collaborative data collection. Use the final reflection page as a formative assessment to gauge student understanding of how trial counts (e.g., 50 vs. 100 rolls) impact the distribution and "spread" of a dot plot.
Who It's For: Designed for Grade 4 and Grade 5 students, this activity is ideal for general education classrooms, RTI groups, and special education settings. It pairs naturally with direct instruction on frequency tables, probability, or as a hands-on supplement to a textbook lesson on line plots.
The use of dot plots to visualize data frequency is a core component of upper elementary mathematics, specifically within the Measurement and Data domain of the Common Core State Standards. This Dot Plot Dice Roll Activity aligns with CCSS.MATH.CONTENT.4.MD.B.4, which mandates that students make a line plot to display a data set of measurements. By engaging in active data collection through dice rolling, students bridge the gap between abstract numbers and concrete visual representations. Research by Fisher & Frey (2014) emphasizes that the gradual release of responsibility—moving from guided tallying to independent data analysis—supports deeper conceptual understanding of statistical variability. This activity provides the structured repetition necessary for mastery, allowing students to identify the most and least frequent outcomes while observing how larger data ranges affect the distribution of a plot. It serves as a critical prerequisite for more advanced data modeling in middle school statistics.