


Views
Downloads
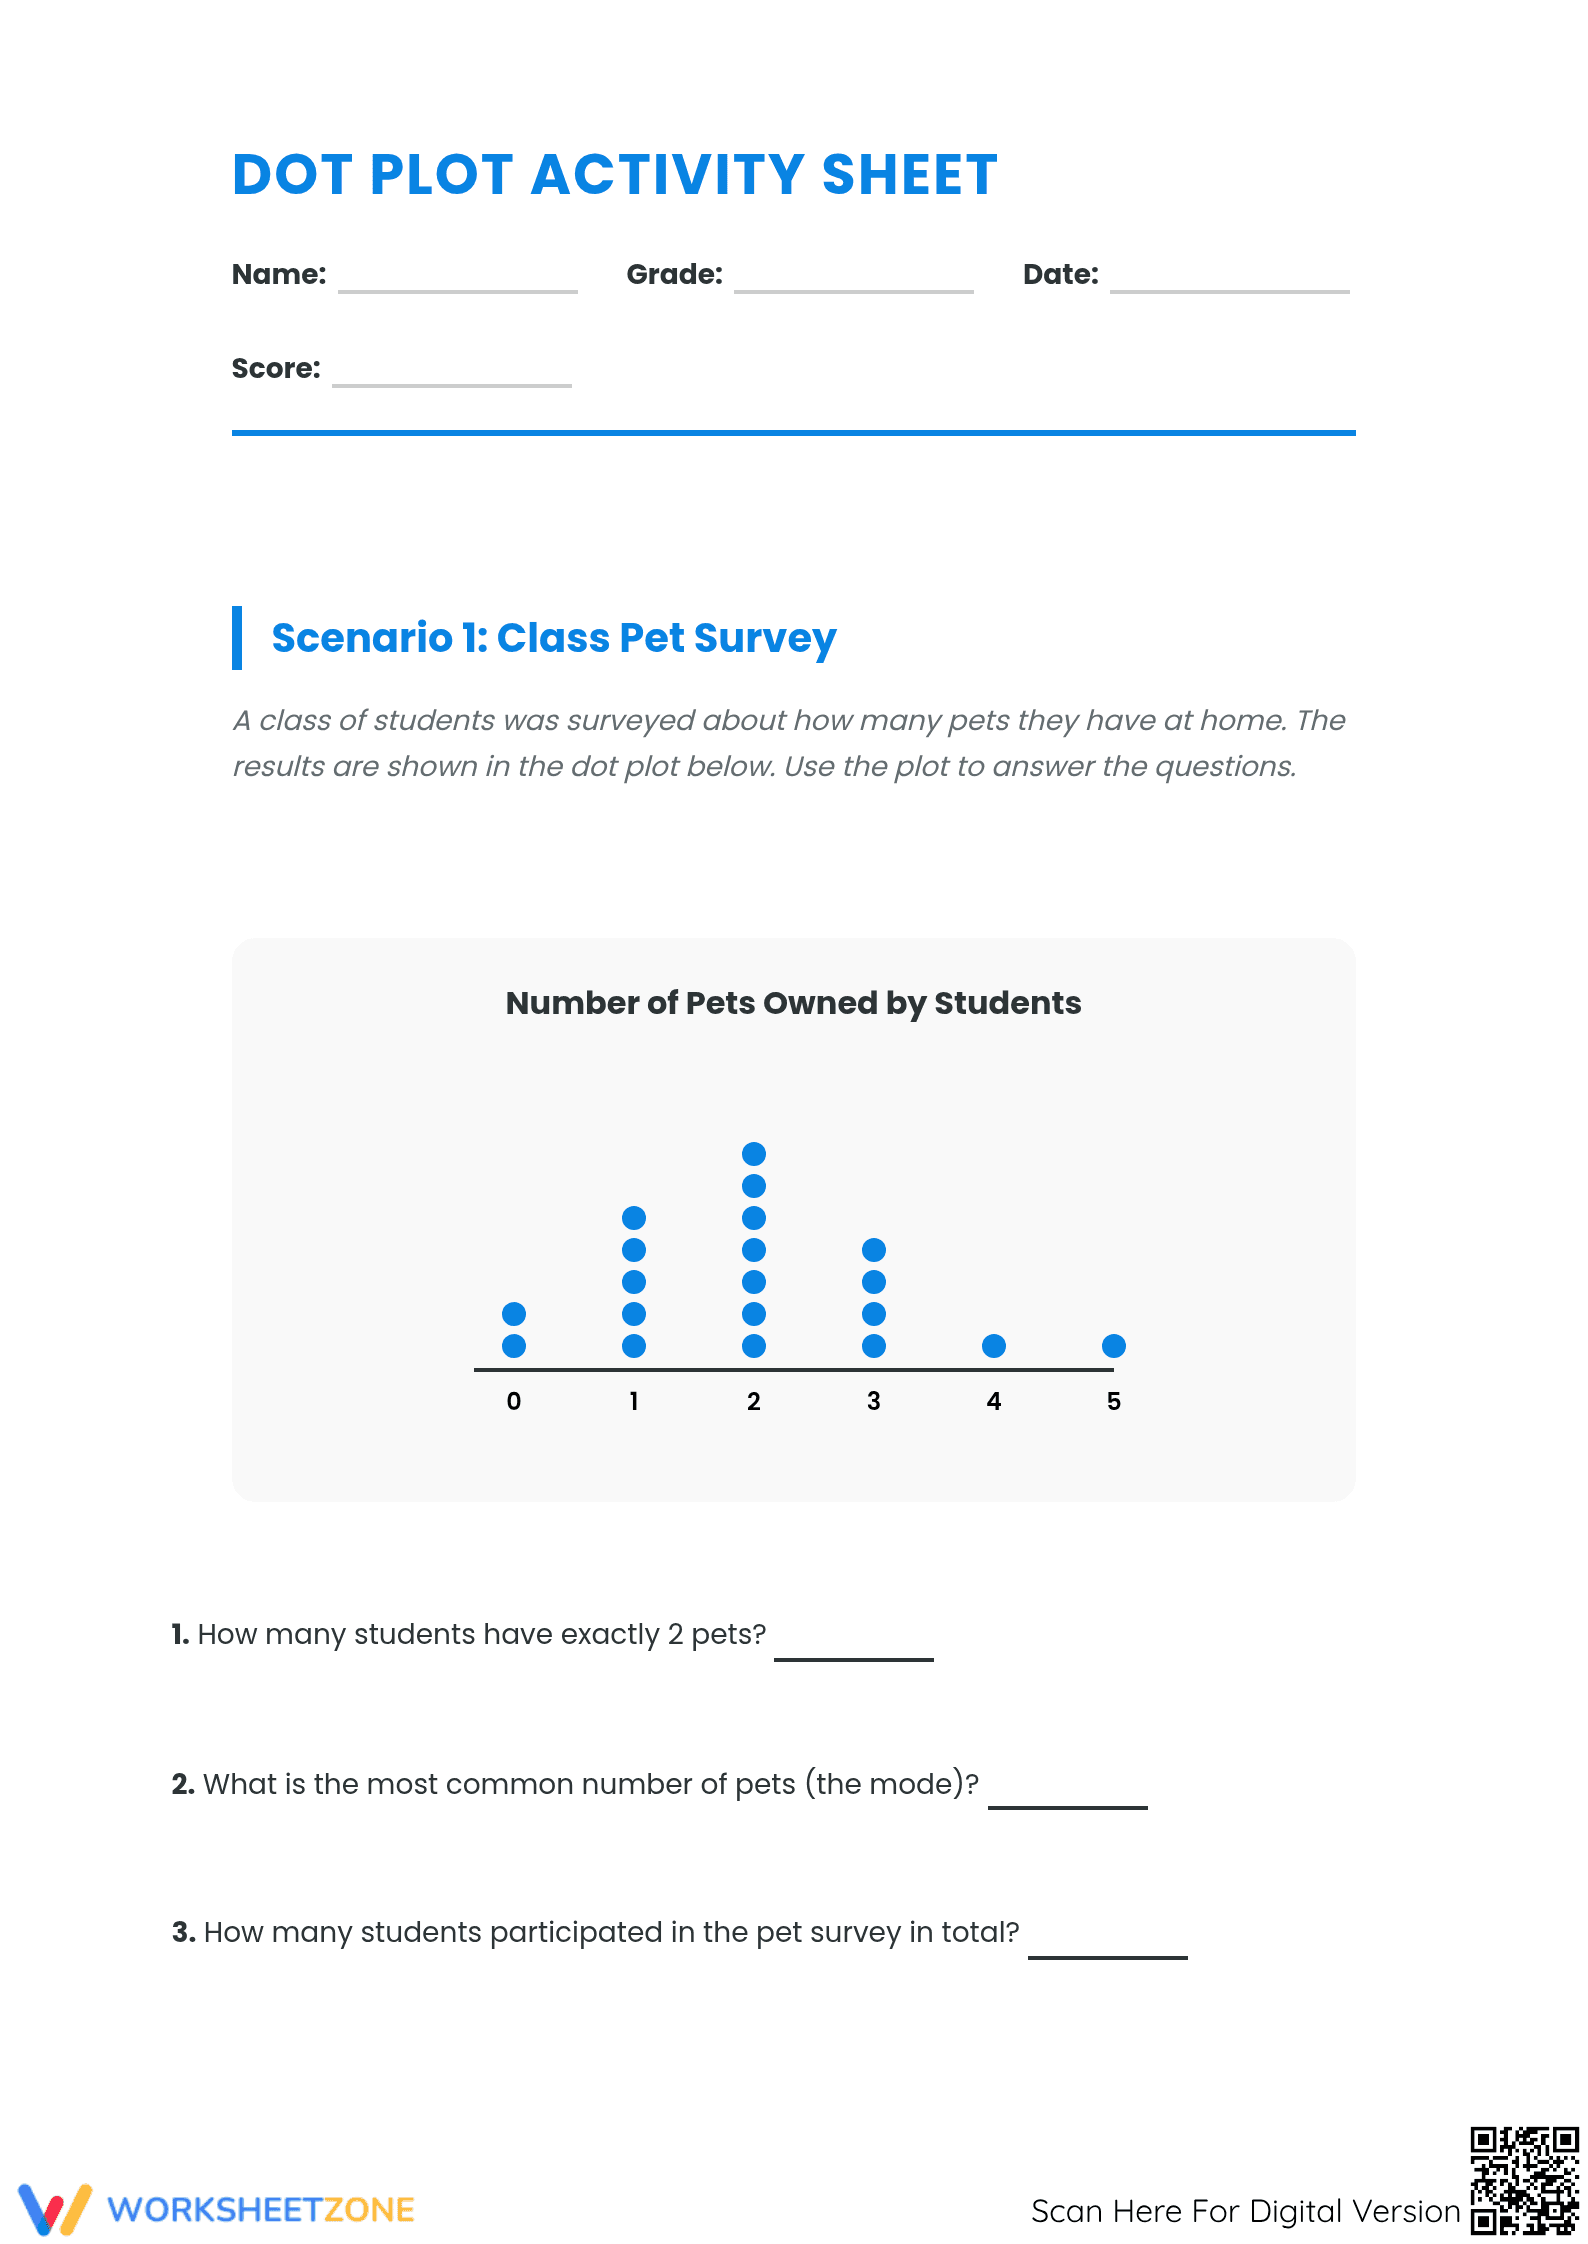
Grade 6 Dot Plot — Printable No-Prep Activity Sheet
Data Interpretation Mastery
This Dot Plot Activity Sheet provides students with a framework for analyzing numerical data through visual representation. By engaging with real-world scenarios—ranging from pet ownership to sleep patterns—learners develop the ability to interpret dot plots and frequency tables. This worksheet ensures students move beyond counting to sophisticated statistical reasoning.
At a Glance
- Grade: 6 · Subject: Math
- Standard:
CCSS.MATH.CONTENT.6.SP.B.5— Summarize numerical data sets in relation to their context by describing distributions- Skill Focus: Data Interpretation & Statistical Measures
- Format: 4 pages · 17 problems · Answer key included · PDF
- Best For: Independent practice or formative assessment
- Time: 30–45 minutes
What's Inside
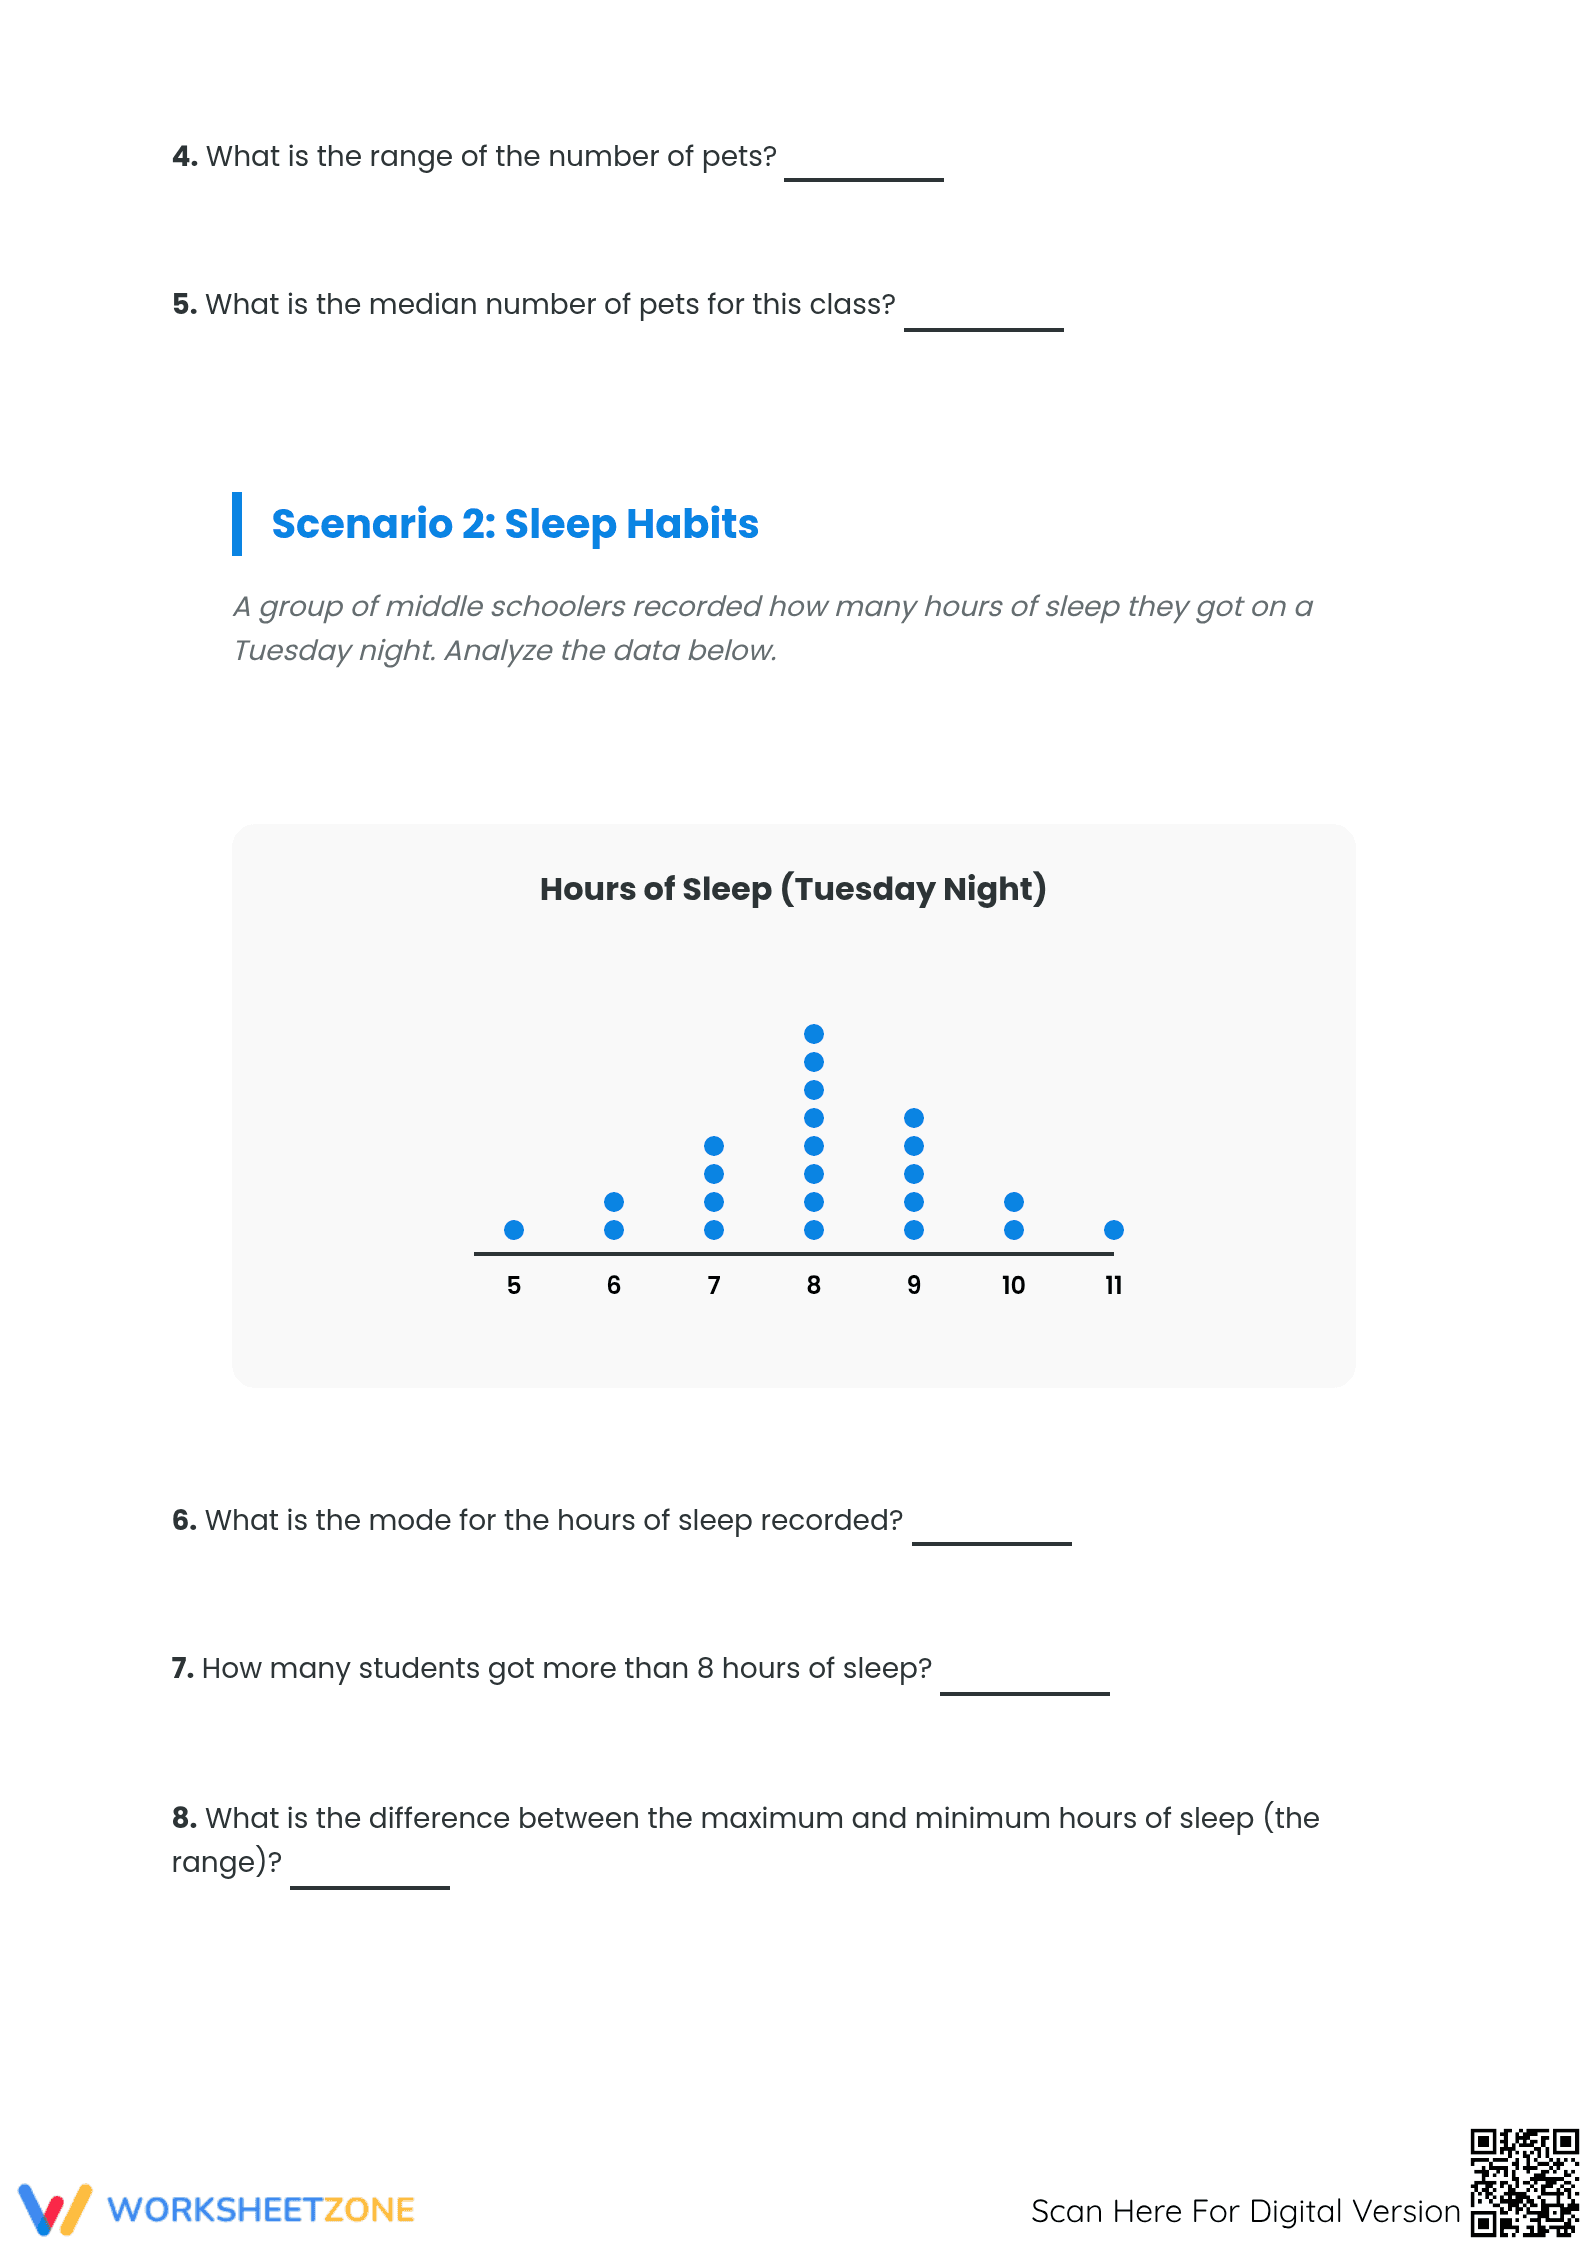
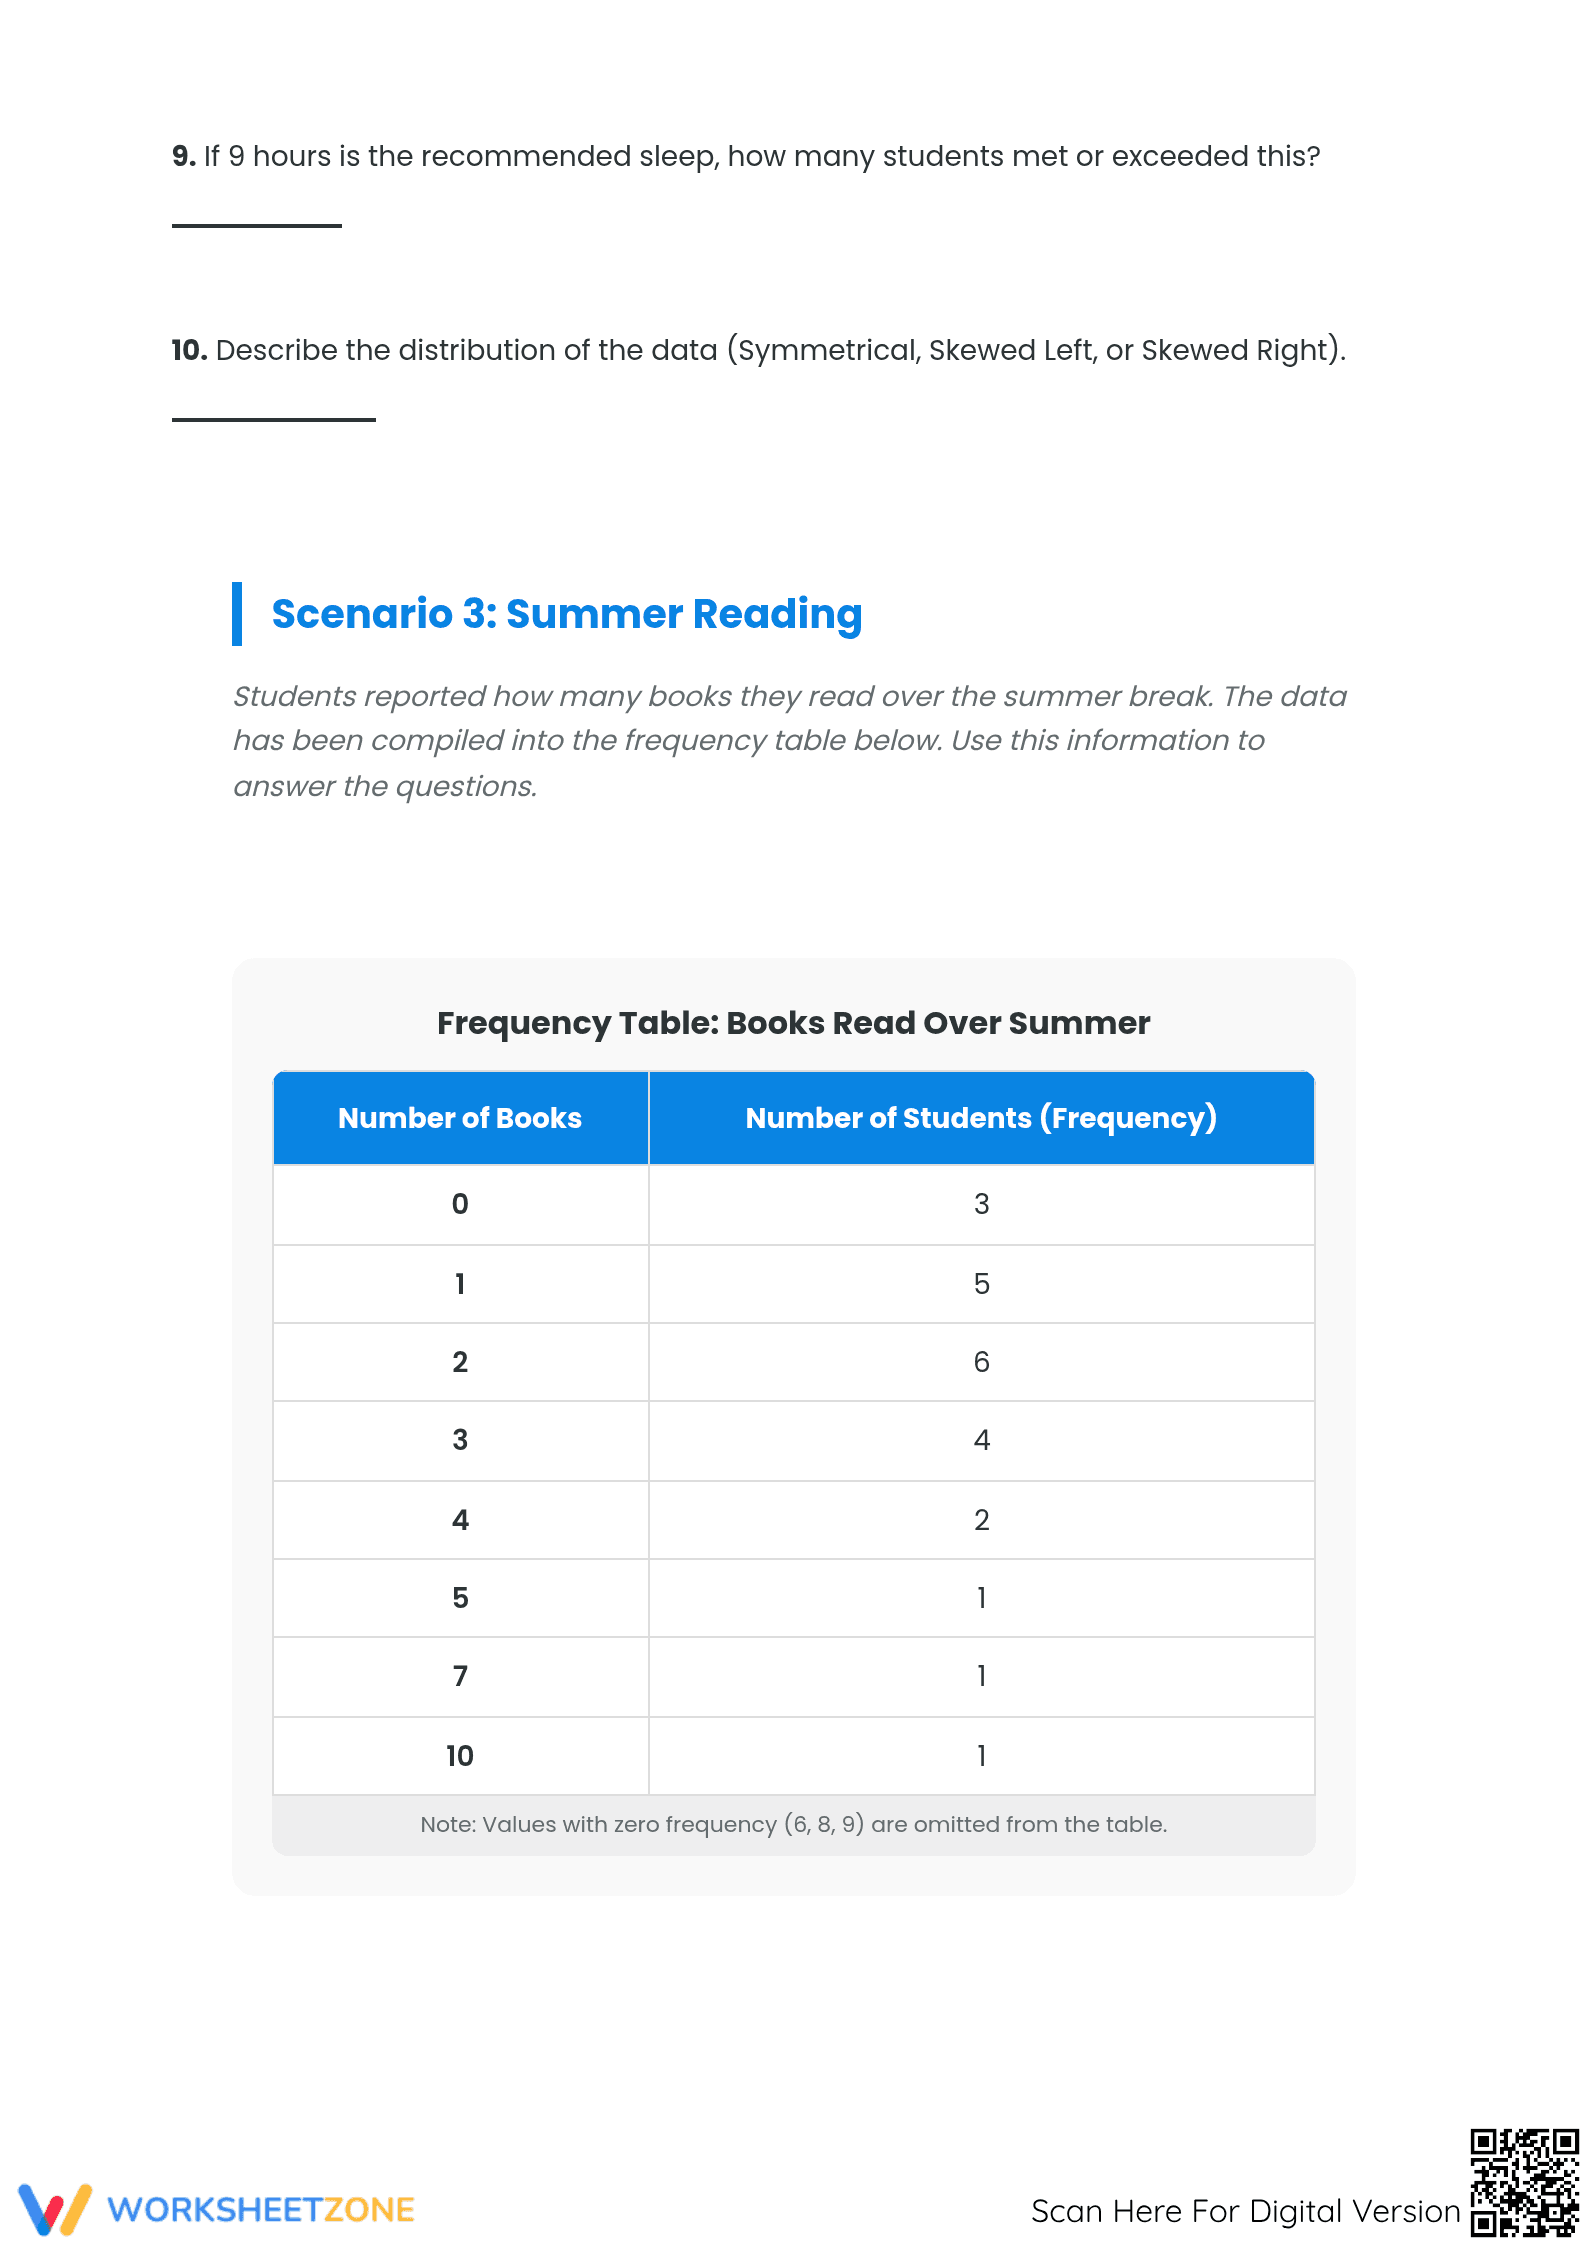
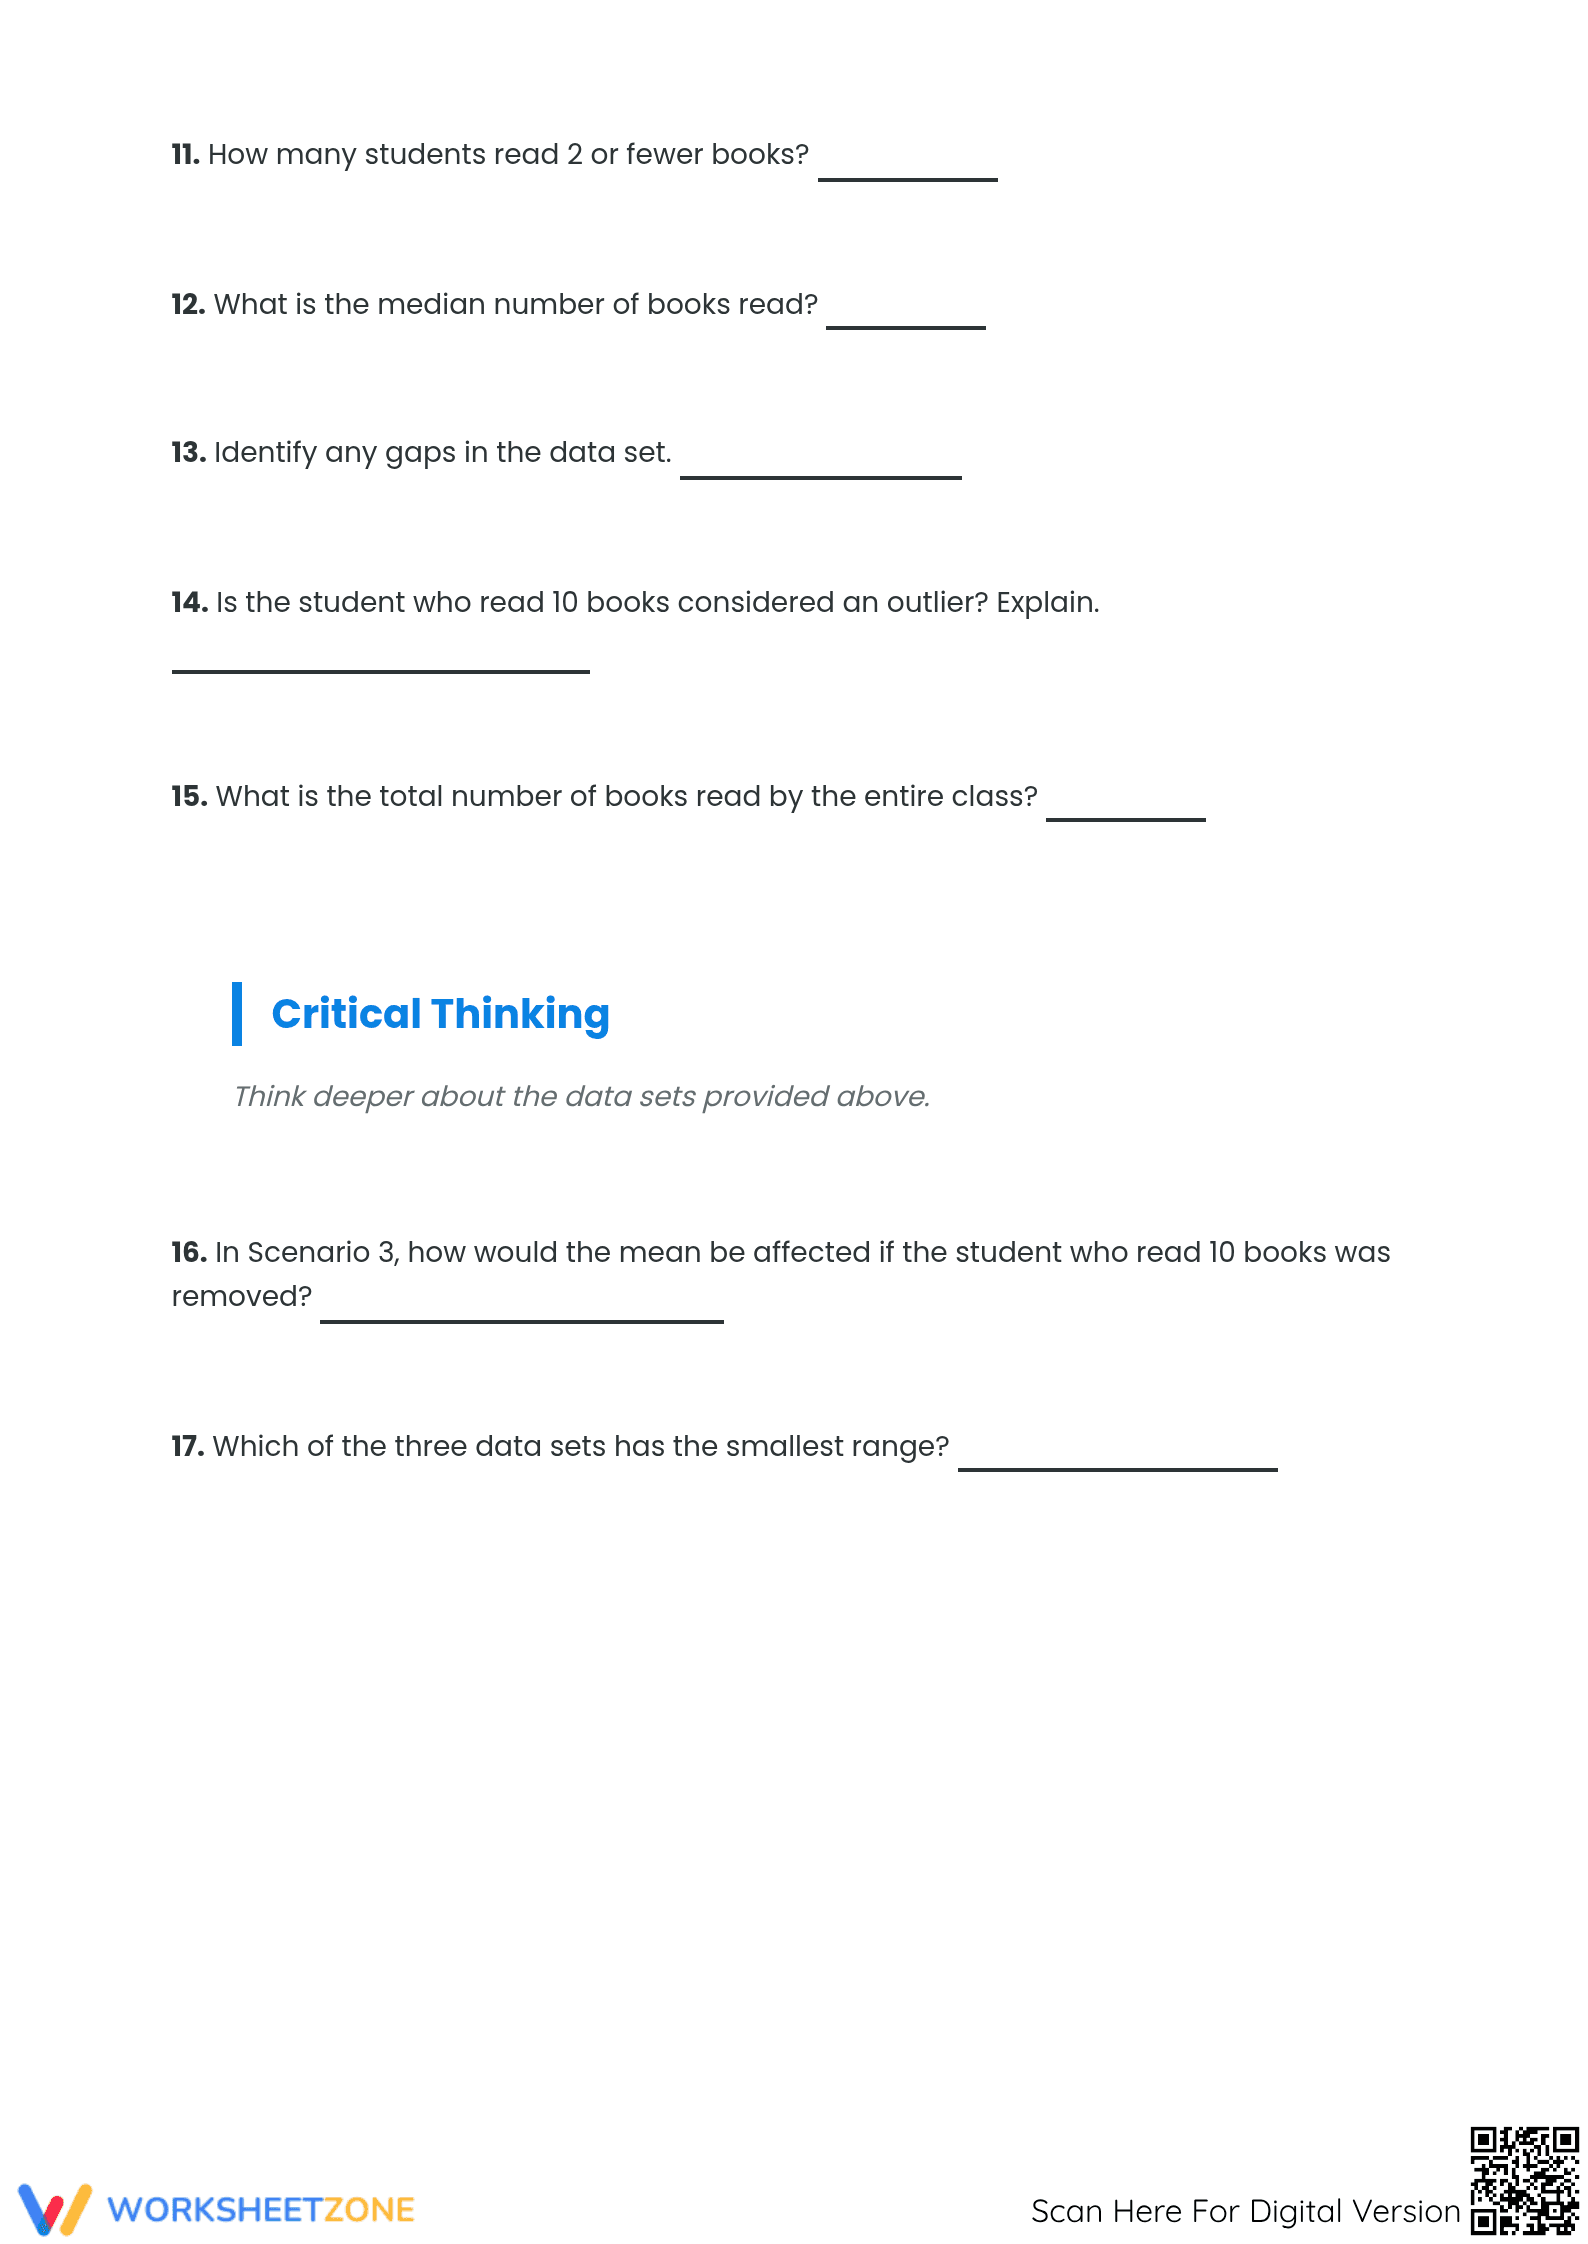
Inside this four-page resource, students will find three distinct data scenarios accompanied by 17 structured problems. The worksheet features two high-quality dot plots and one detailed frequency table, covering skills such as identifying the mode, calculating range, finding the median, and describing data distribution (symmetrical vs. skewed). A dedicated critical thinking section challenges students to predict how removing outliers affects the mean, while a complete answer key ensures efficient grading.
Zero-Prep Workflow
The zero-prep workflow for this resource is designed for classroom efficiency. First, print the four-page PDF. Second, distribute the activity sheets for independent work; the clear instructions require no additional teacher explanation. Finally, use the included answer key to review responses or facilitate self-grading. This streamlined process makes it an ideal choice for emergency sub plans or "plug-and-play" lesson components. Total teacher prep time is under two minutes.
Standards Alignment
This resource is primary aligned to CCSS.MATH.CONTENT.6.SP.B.5, which requires students to summarize numerical data sets in relation to their context, such as by reporting the number of observations and describing the nature of the attribute under investigation. It also supports CCSS.MATH.CONTENT.6.SP.B.4 by providing opportunities to analyze data displayed on a number line. Both standard codes can be copied directly into lesson plans, IEP goals, or district curriculum mapping tools.
How to Use It
Use this worksheet as a summative assessment following a unit on data displays to measure mastery of statistical concepts. Alternatively, it serves as an excellent station activity where students work through one scenario at a time. During the activity, observe if students correctly sequence data points when finding the median. Expected completion time is 35 minutes.
Who It's For
This activity is designed for Grade 6 math students but provides valuable review for Grades 7 and 8 learners who need to reinforce their data literacy. It is particularly effective for visual learners who benefit from seeing data plotted on a number line. This resource pairs naturally with a lesson on measures of center or a supplemental passage about statistical variability, providing the necessary hands-on practice.
Aligned with the statistical foundations of CCSS.MATH.CONTENT.6.SP.B.5, this dot plot activity sheet addresses the essential skill of summarizing and interpreting numerical data sets. According to Fisher & Frey (2014), the use of scaffolded practice—moving from simple observation to complex critical thinking—is vital for developing mathematical literacy. This worksheet facilitates that progression by requiring students to calculate the mode, median, and range before analyzing the impact of outliers and data distribution shapes. By integrating dot plots with frequency tables, the resource ensures students can translate between different data representations, a core requirement for secondary mathematics. The inclusion of 17 varied tasks allows for multiple "at-bats" with the material, supporting the gradual release of responsibility and ensuring that learners can independently explain how data characteristics relate to the original survey context. This rigorous approach builds a strong foundation in data analysis.