


1 / 5
0
Views
0
Downloads


0.0
0
Save
0 Likes
Data Representation: Frequency Tables, Dot Plots Worksheet
0 Views
0 Downloads
Paste this activity's link or code into your existing LMS (Google Classroom, Canvas, Teams, Schoology, Moodle, etc.).
Students can open and work on the activity right away, with no student login required.
You'll still be able to track student progress and results from your teacher account.
Information
Description
What It Is:
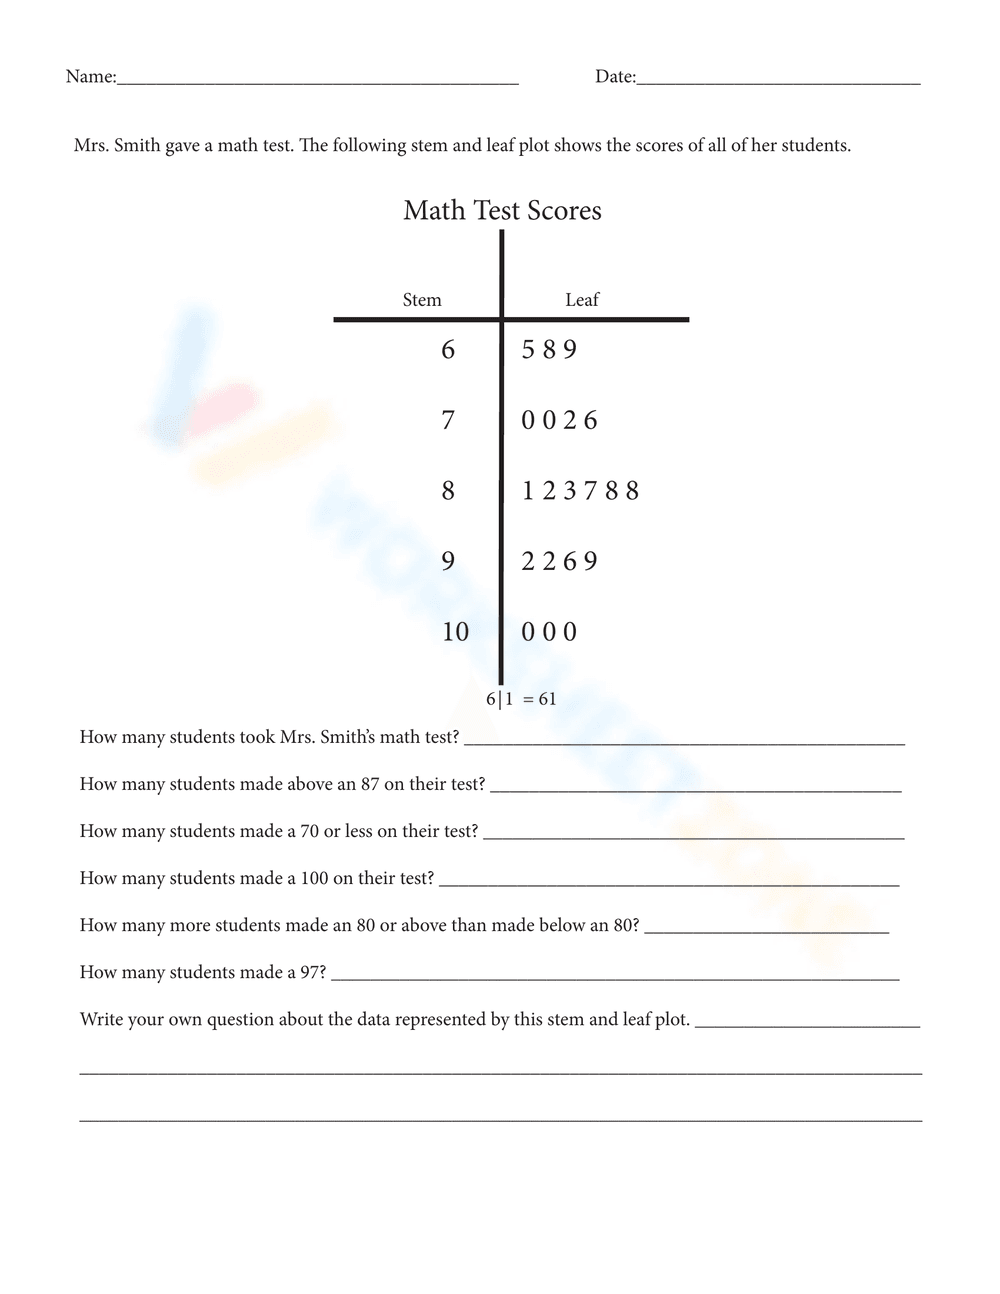
This is a math worksheet focused on data interpretation using a frequency table. The table shows the number of points scored by basketball players during a game, with the number of points (0 to 5) listed and tally marks indicating the amount of players scoring that amount. The worksheet includes questions about the data in the table, such as 'How many players scored 3 or more points?' and asks the student to create their own question based on the data.
Grade Level Suitability:
This worksheet is suitable for grades 3-5. It involves reading and interpreting data from a frequency table, which is a skill typically taught in these grades. The arithmetic required to answer the questions is also appropriate for this age range.
Why Use It:
This worksheet helps students develop data analysis and interpretation skills. It allows them to practice reading frequency tables, answering questions based on the data presented, and formulating their own questions, promoting critical thinking and engagement with statistical information.
How to Use It:
First, students should carefully read the frequency table and understand the relationship between the number of points and the number of players. Then, they should answer each question by analyzing the data in the table. Finally, they should write their own question based on the data.
Target Users:
This worksheet is designed for elementary school students, specifically those in grades 3-5, who are learning about data interpretation, frequency tables, and basic data analysis. It's beneficial for students who need practice in extracting information from visual representations of data.