


























Views
Downloads
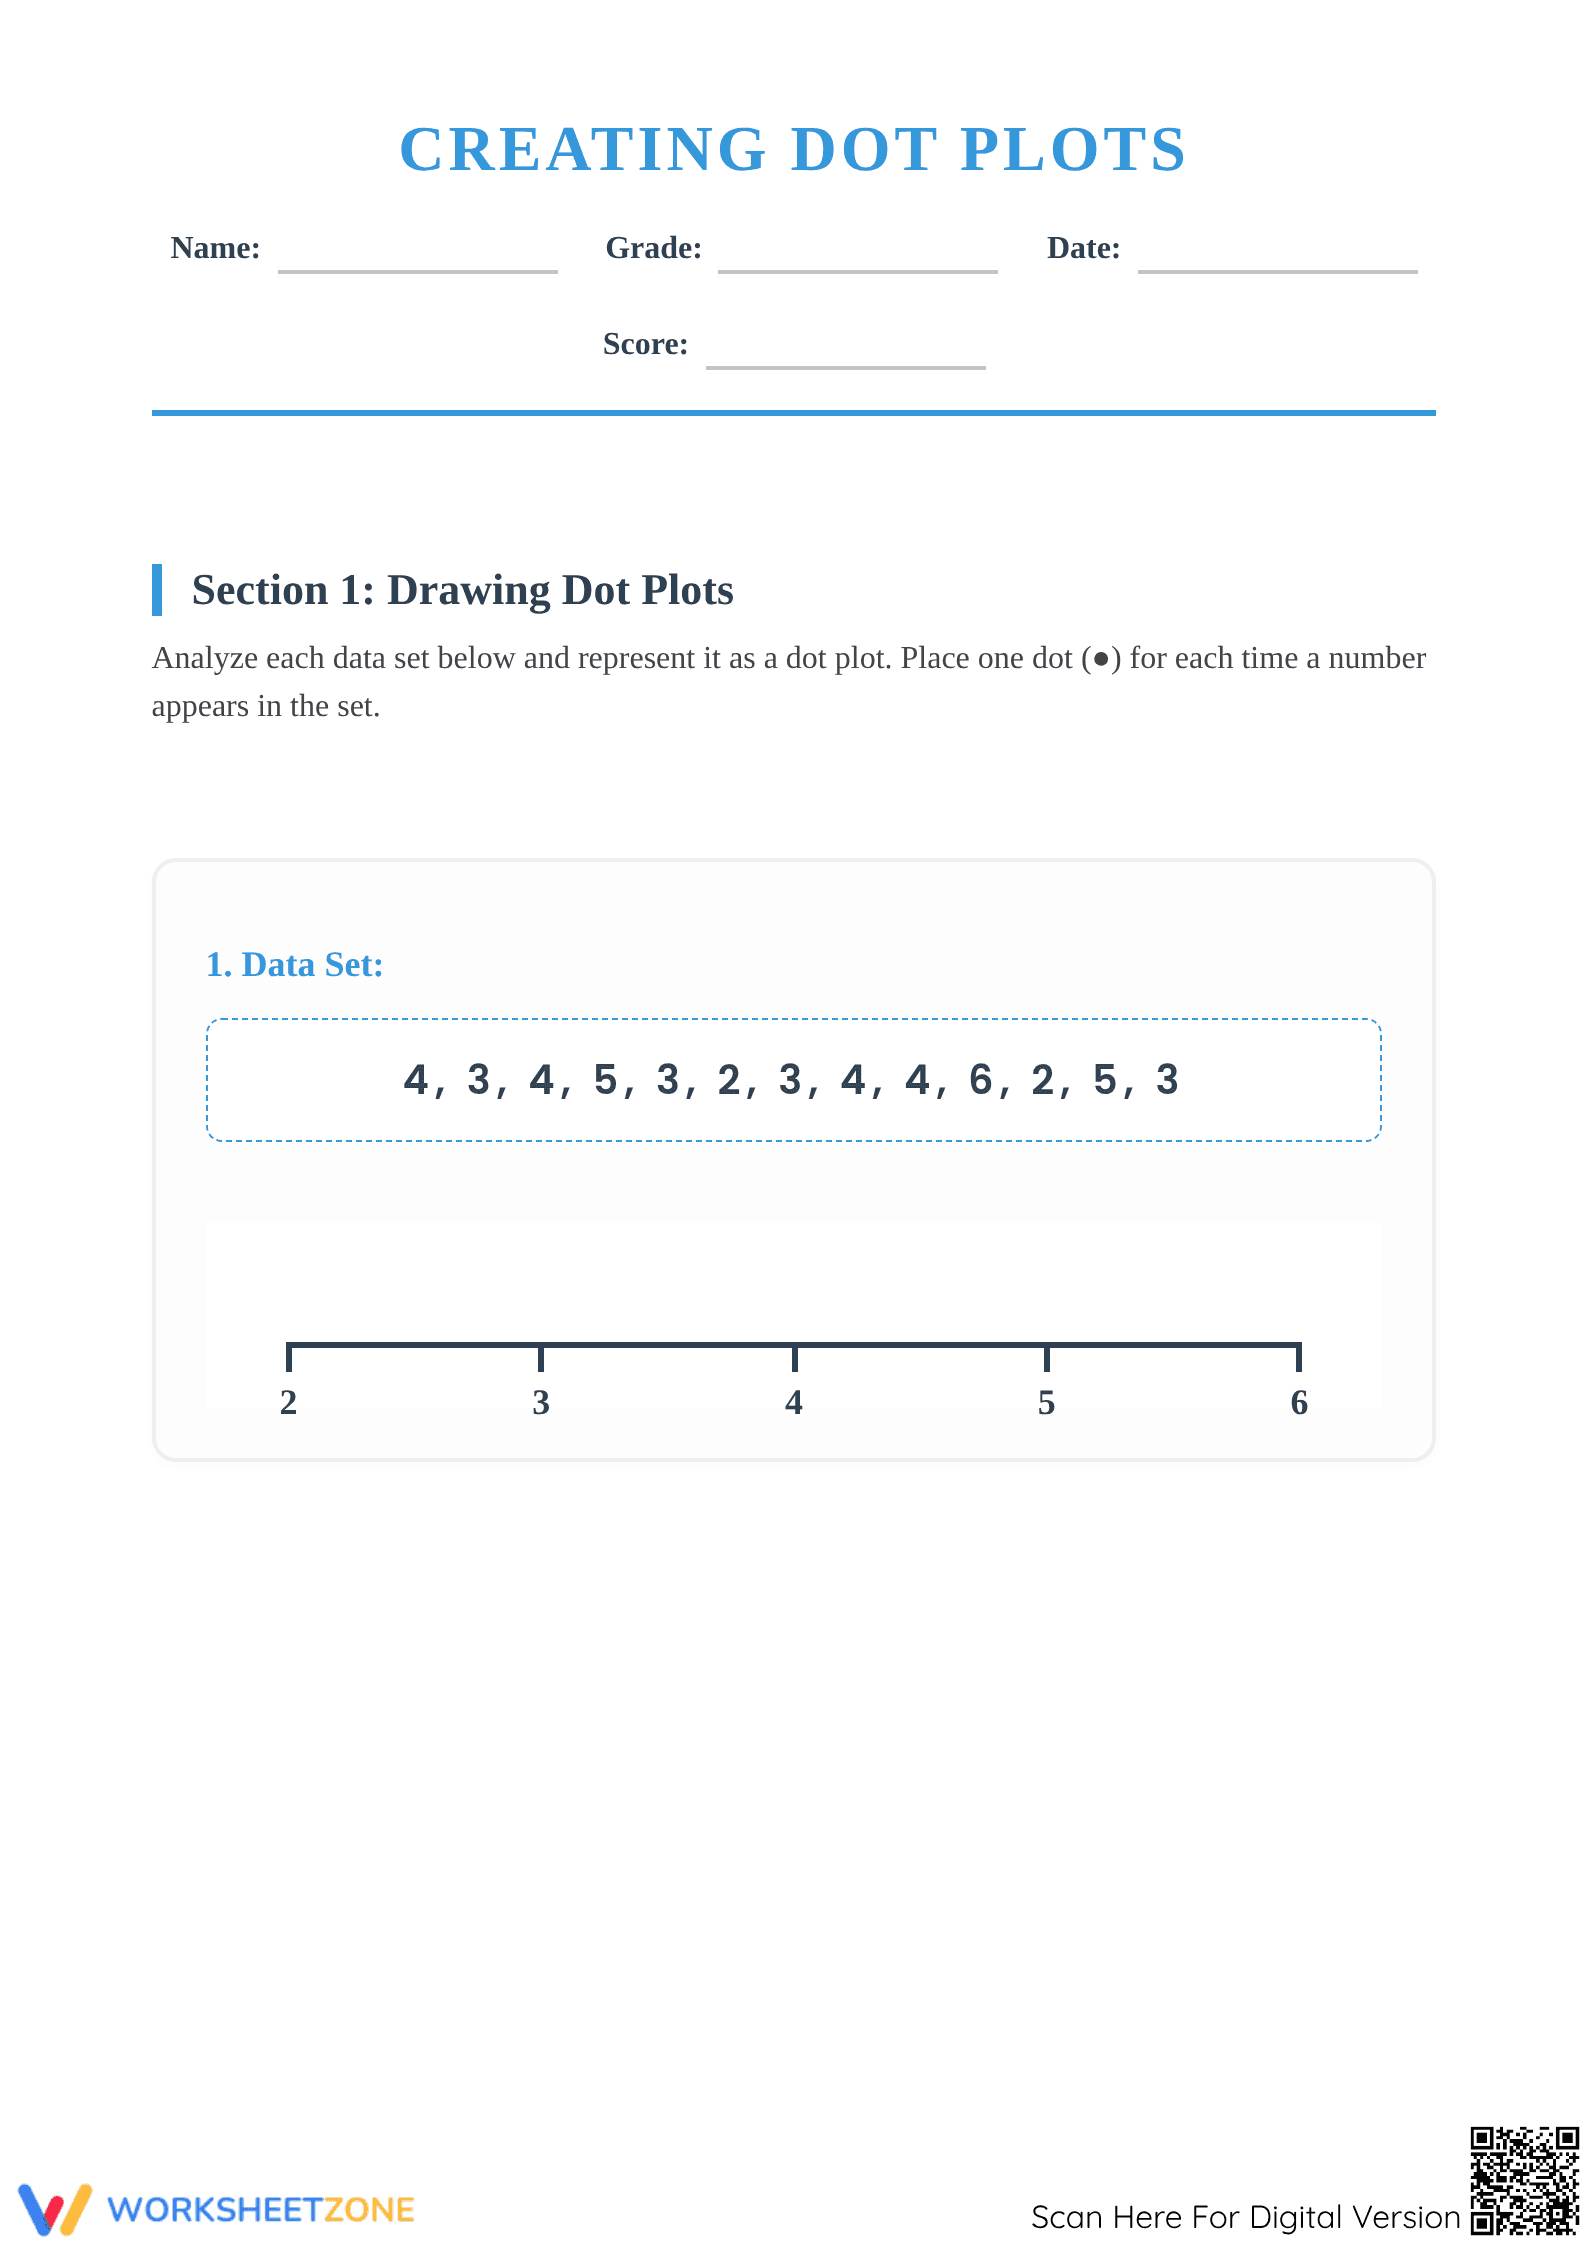


Printable Creating Dot Plots Worksheet | Grade 6 Math
Paste this activity's link or code into your existing LMS (Google Classroom, Canvas, Teams, Schoology, Moodle, etc.).
Students can open and work on the activity right away, with no student login required.
You'll still be able to track student progress and results from your teacher account.
This comprehensive dot plot worksheet provides middle school students with rigorous practice in representing numerical data sets. By manually placing frequency markers on provided number lines, learners bridge the gap between abstract data lists and visual distributions, ultimately calculating statistical measures like range and mode based on their own plots.
At a Glance
- Grade: 6 · Subject: Math
- Standard:
CCSS.MATH.CONTENT.6.SP.B.4— Display numerical data in plots on a number line, including dot plots.- Skill Focus: Frequency distribution & data interpretation
- Format: 3 pages · 8 problems · Answer key included · PDF
- Best For: Independent practice or formative assessment
- Time: 25–35 minutes
Inside this resource, you will find a structured three-page layout designed for clarity and maximum student engagement. Section 1 contains four distinct data sets where students analyze integers and plot them accurately on pre-labeled number lines. Section 2 shifts to data interpretation, requiring students to extract meaning from their created visuals by identifying the mode, calculating the range, and performing inequality comparisons on data points.
Skill Progression
- Guided Practice: The first two problems provide small, manageable data sets (13-14 points) on simple 2-6 and 10-14 scales to build confidence in one-to-one mapping.
- Supported Practice: Problems 3 and 4 increase complexity with higher number ranges (20-24) and more varied distributions, requiring closer attention to frequency accuracy.
- Independent Interpretation: The final section removes the plotting scaffold, asking students to perform four high-level analytical tasks that prove their mastery of the visual data.
This sequence follows a gradual-release model, moving from the mechanical task of plotting to the cognitive task of statistical analysis.
Standards Alignment
The primary focus of this worksheet is `CCSS.MATH.CONTENT.6.SP.B.4`, which requires students to display numerical data in plots on a number line. It also supports `CCSS.MATH.CONTENT.6.SP.B.5.C`, as students must summarize numerical data sets by describing the nature of the attribute under investigation. Both standard codes can be copied directly into lesson plans, IEP goals, or district curriculum mapping tools.
How to Use It
For best results, assign this worksheet during the "You Do" phase of a lesson on data displays. It serves as an excellent formative assessment tool; as students work through Section 1, walk the room to observe if they are marking off data points in the list as they plot them to avoid double-counting. Expect students to complete all three pages within 35 minutes.
Who It's For
This resource is tailored for 6th-grade math students, though it provides valuable remediation for 7th and 8th graders struggling with data visualization. It pairs naturally with a frequency table anchor chart or a short introductory passage on central tendency.
Statistical literacy begins with the ability to visualize the shape of data. According to Fisher & Frey (2014), the use of graphic organizers and visual representations like dot plots significantly enhances a student's ability to retain and analyze complex information. This worksheet leverages that principle by requiring students to construct the visual themselves before answering interpretive questions. By requiring the calculation of range and mode from the visual display rather than the raw list, students develop a deeper spatial understanding of how frequency impacts statistical outcomes. Aligned with CCSS.MATH.CONTENT.6.SP.B.4, this resource ensures that Grade 6 learners meet national benchmarks for data representation. The inclusion of a full answer key allows for rapid feedback, which is essential for correcting common plotting errors during the initial learning phase. This balance of construction and analysis makes it a robust tool for any middle school math curriculum.


