


0
Views
0
Downloads
0.0
0
Save
0 Likes
Understanding Box and Whisker Plots
0 Views
0 Downloads
Paste this activity's link or code into your existing LMS (Google Classroom, Canvas, Teams, Schoology, Moodle, etc.).
Students can open and work on the activity right away, with no student login required.
You'll still be able to track student progress and results from your teacher account.
Information
Description
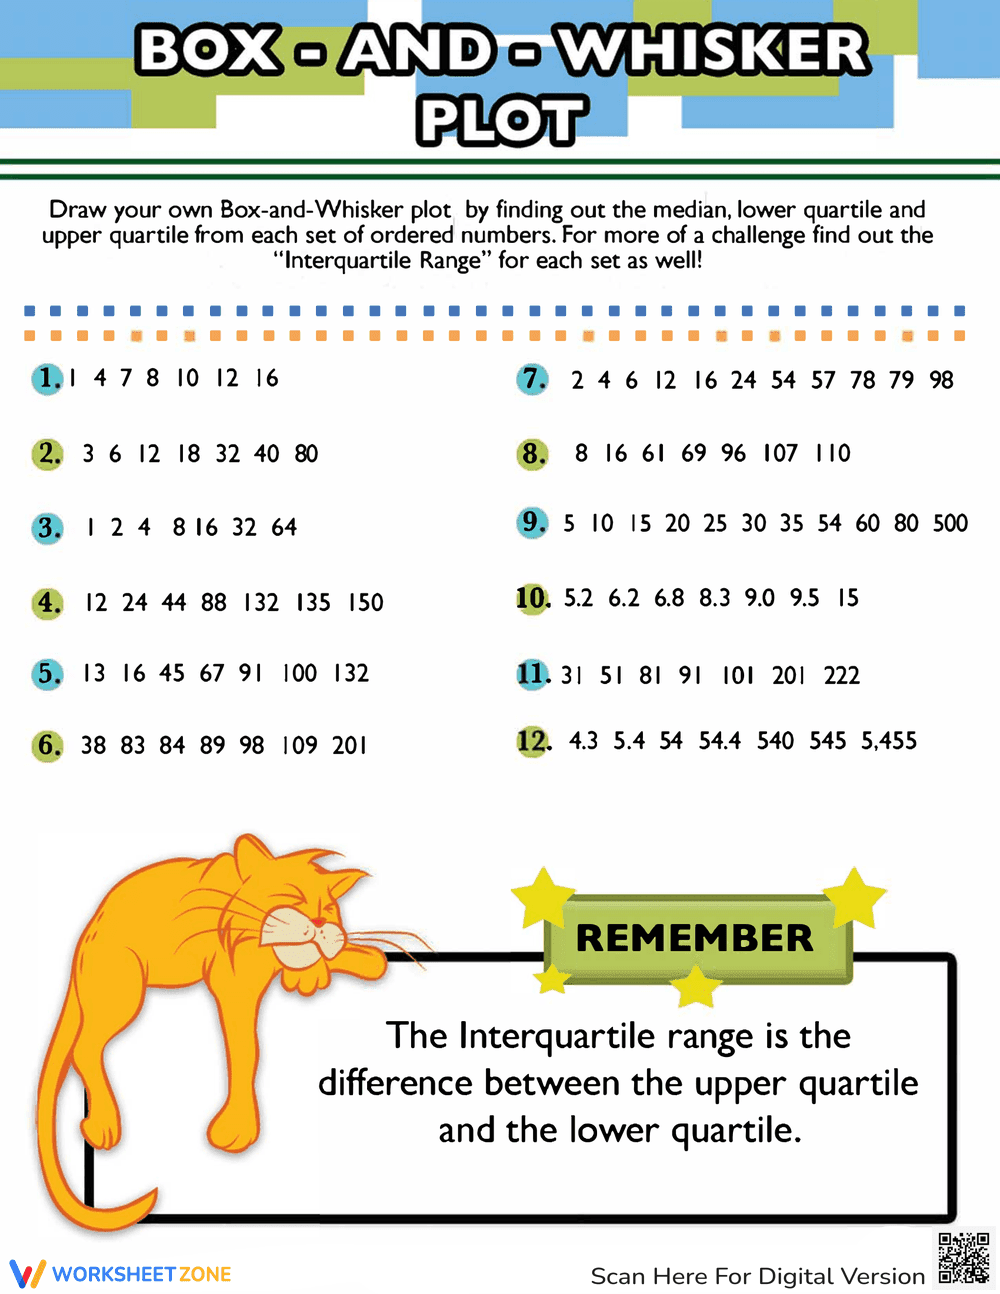
What It Is:
This is a math worksheet focusing on box-and-whisker plots. The worksheet provides 12 sets of ordered numbers. The task is to draw box-and-whisker plots for each set by finding the median, lower quartile, and upper quartile. As an added challenge, students are asked to calculate the interquartile range. A reminder box explains that the interquartile range is the difference between the upper and lower quartiles.
Grade Level Suitability:
This worksheet is suitable for grades 6-8. It requires students to understand ordered numbers, medians, quartiles, and box-and-whisker plots, which are typically introduced in middle school math curricula.
Why Use It:
This worksheet reinforces the concepts of median, quartiles, and interquartile range. It provides practice in creating box-and-whisker plots, which helps students visualize and interpret data sets. Calculating the interquartile range further develops data analysis skills.
How to Use It:
First, students should find the median, lower quartile, and upper quartile for each set of numbers. Then, they can use these values to draw a box-and-whisker plot for each data set. Finally, they should calculate the interquartile range by subtracting the lower quartile from the upper quartile.
Target Users:
This worksheet is ideal for middle school math students learning about statistics and data representation. It can be used for classroom practice, homework assignments, or review activities. It's also helpful for students who need extra practice with box-and-whisker plots.