


Views
Downloads
Printable Bar Graph Worksheet | Grade 3 Math Guide
Paste this activity's link or code into your existing LMS (Google Classroom, Canvas, Teams, Schoology, Moodle, etc.).
Students can open and work on the activity right away, with no student login required.
You'll still be able to track student progress and results from your teacher account.
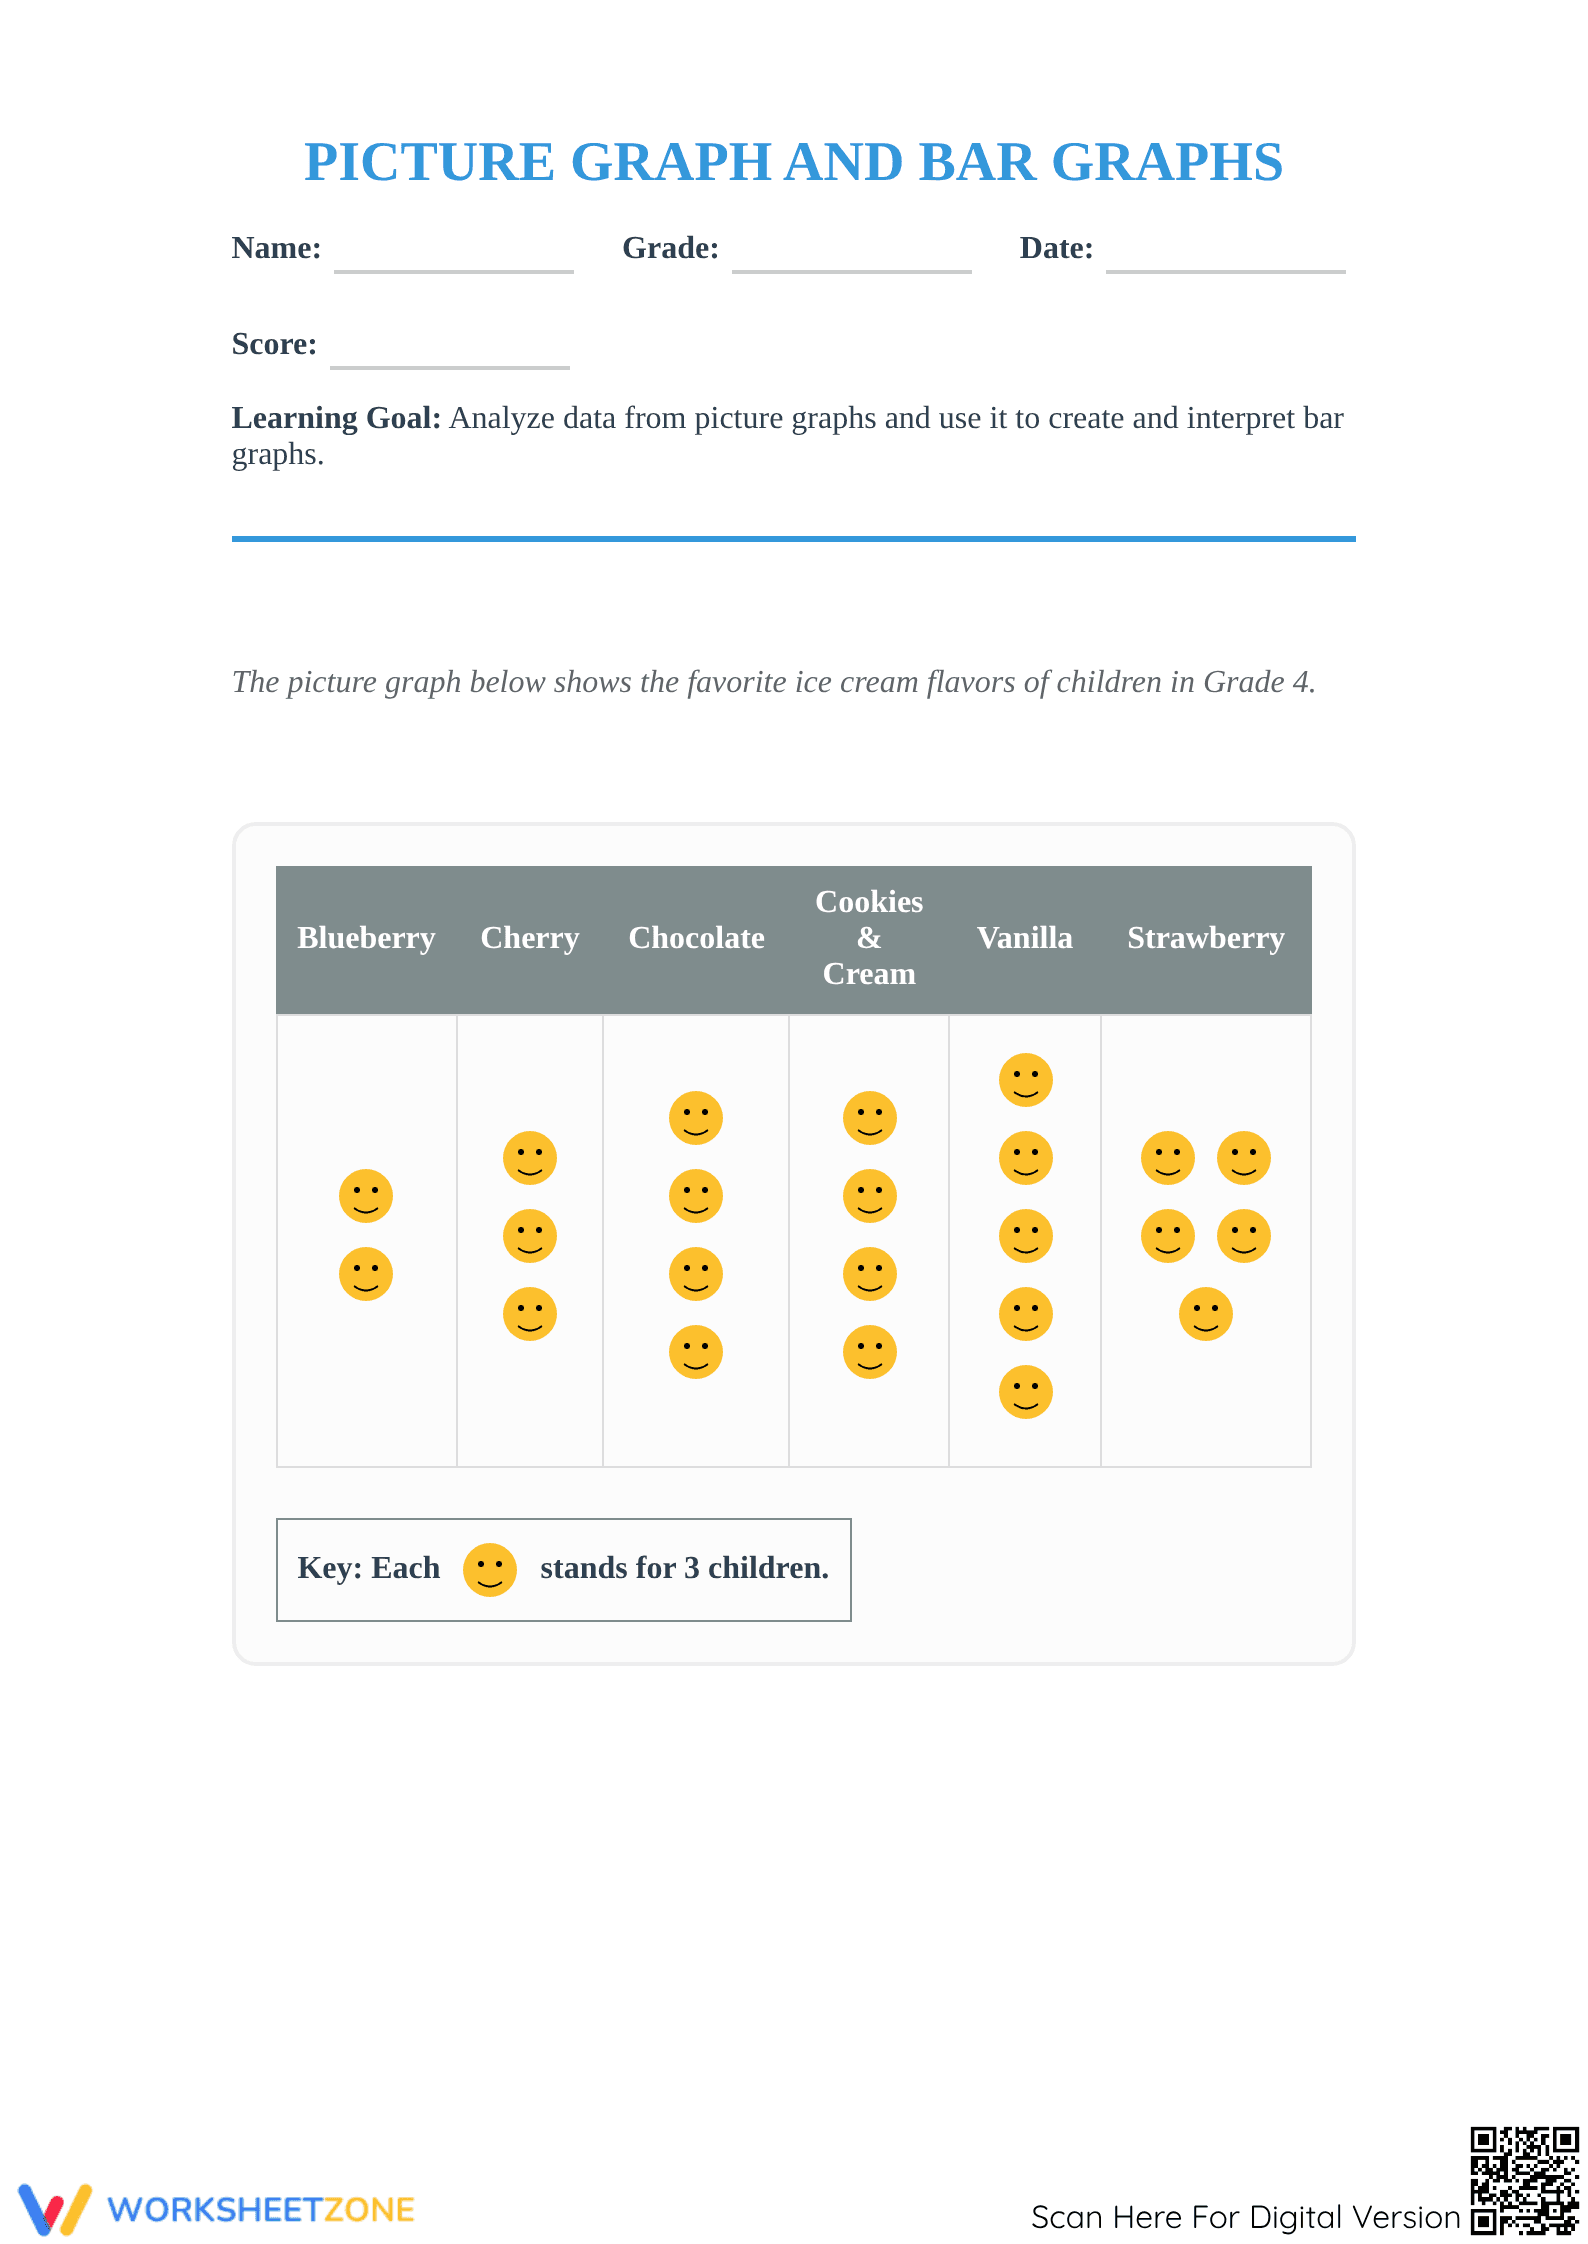
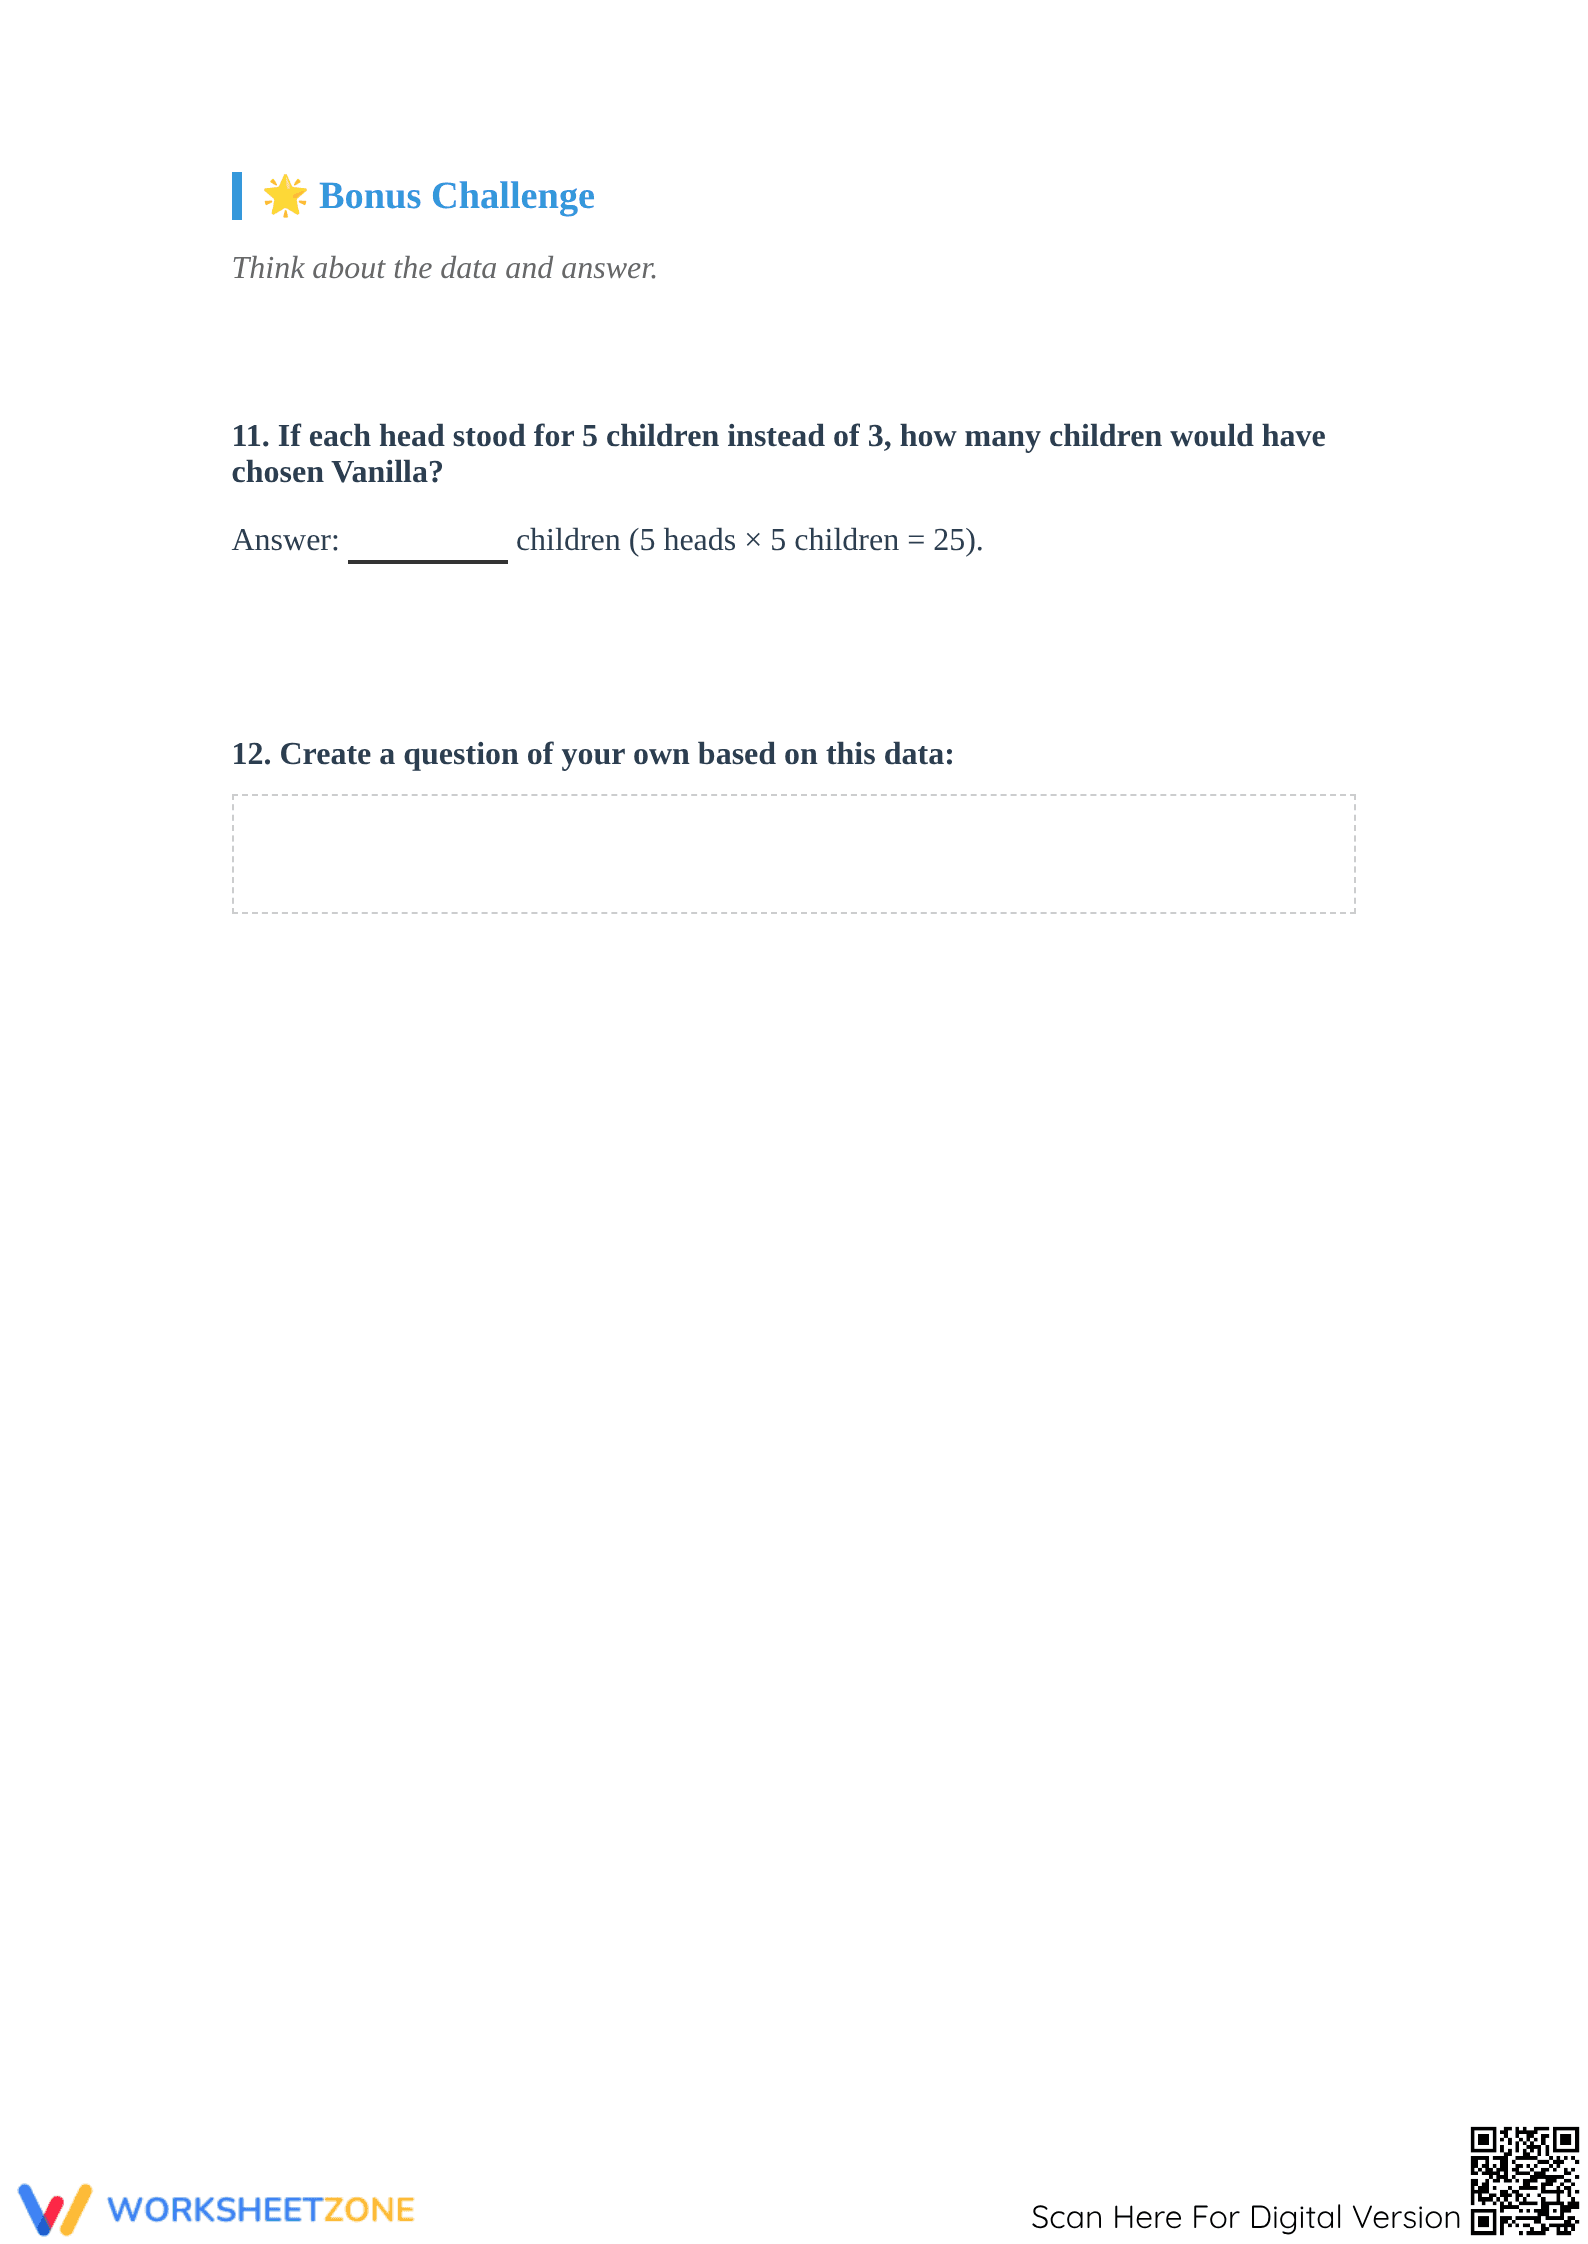
This resource provides focused practice for third and fourth-grade students on interpreting and creating bar graphs and picture graphs. Through a series of five scaffolded activities, learners will strengthen their ability to represent data, analyze information presented in graphs, and solve one- and two-step problems based on the data.
At a Glance
- Grade: 3–4 · Subject: Math
- Standard:
CCSS.MATH.CONTENT.3.MD.B.3— Draw and interpret scaled bar and picture graphs to represent data.- Skill Focus: Bar Graphs, Picture Graphs, Data Interpretation
- Format: 5 pages · 5 core tasks · Answer key included · PDF
- Best For: Skill reinforcement, math centers, or homework
- Time: 25–40 minutes
What's Inside
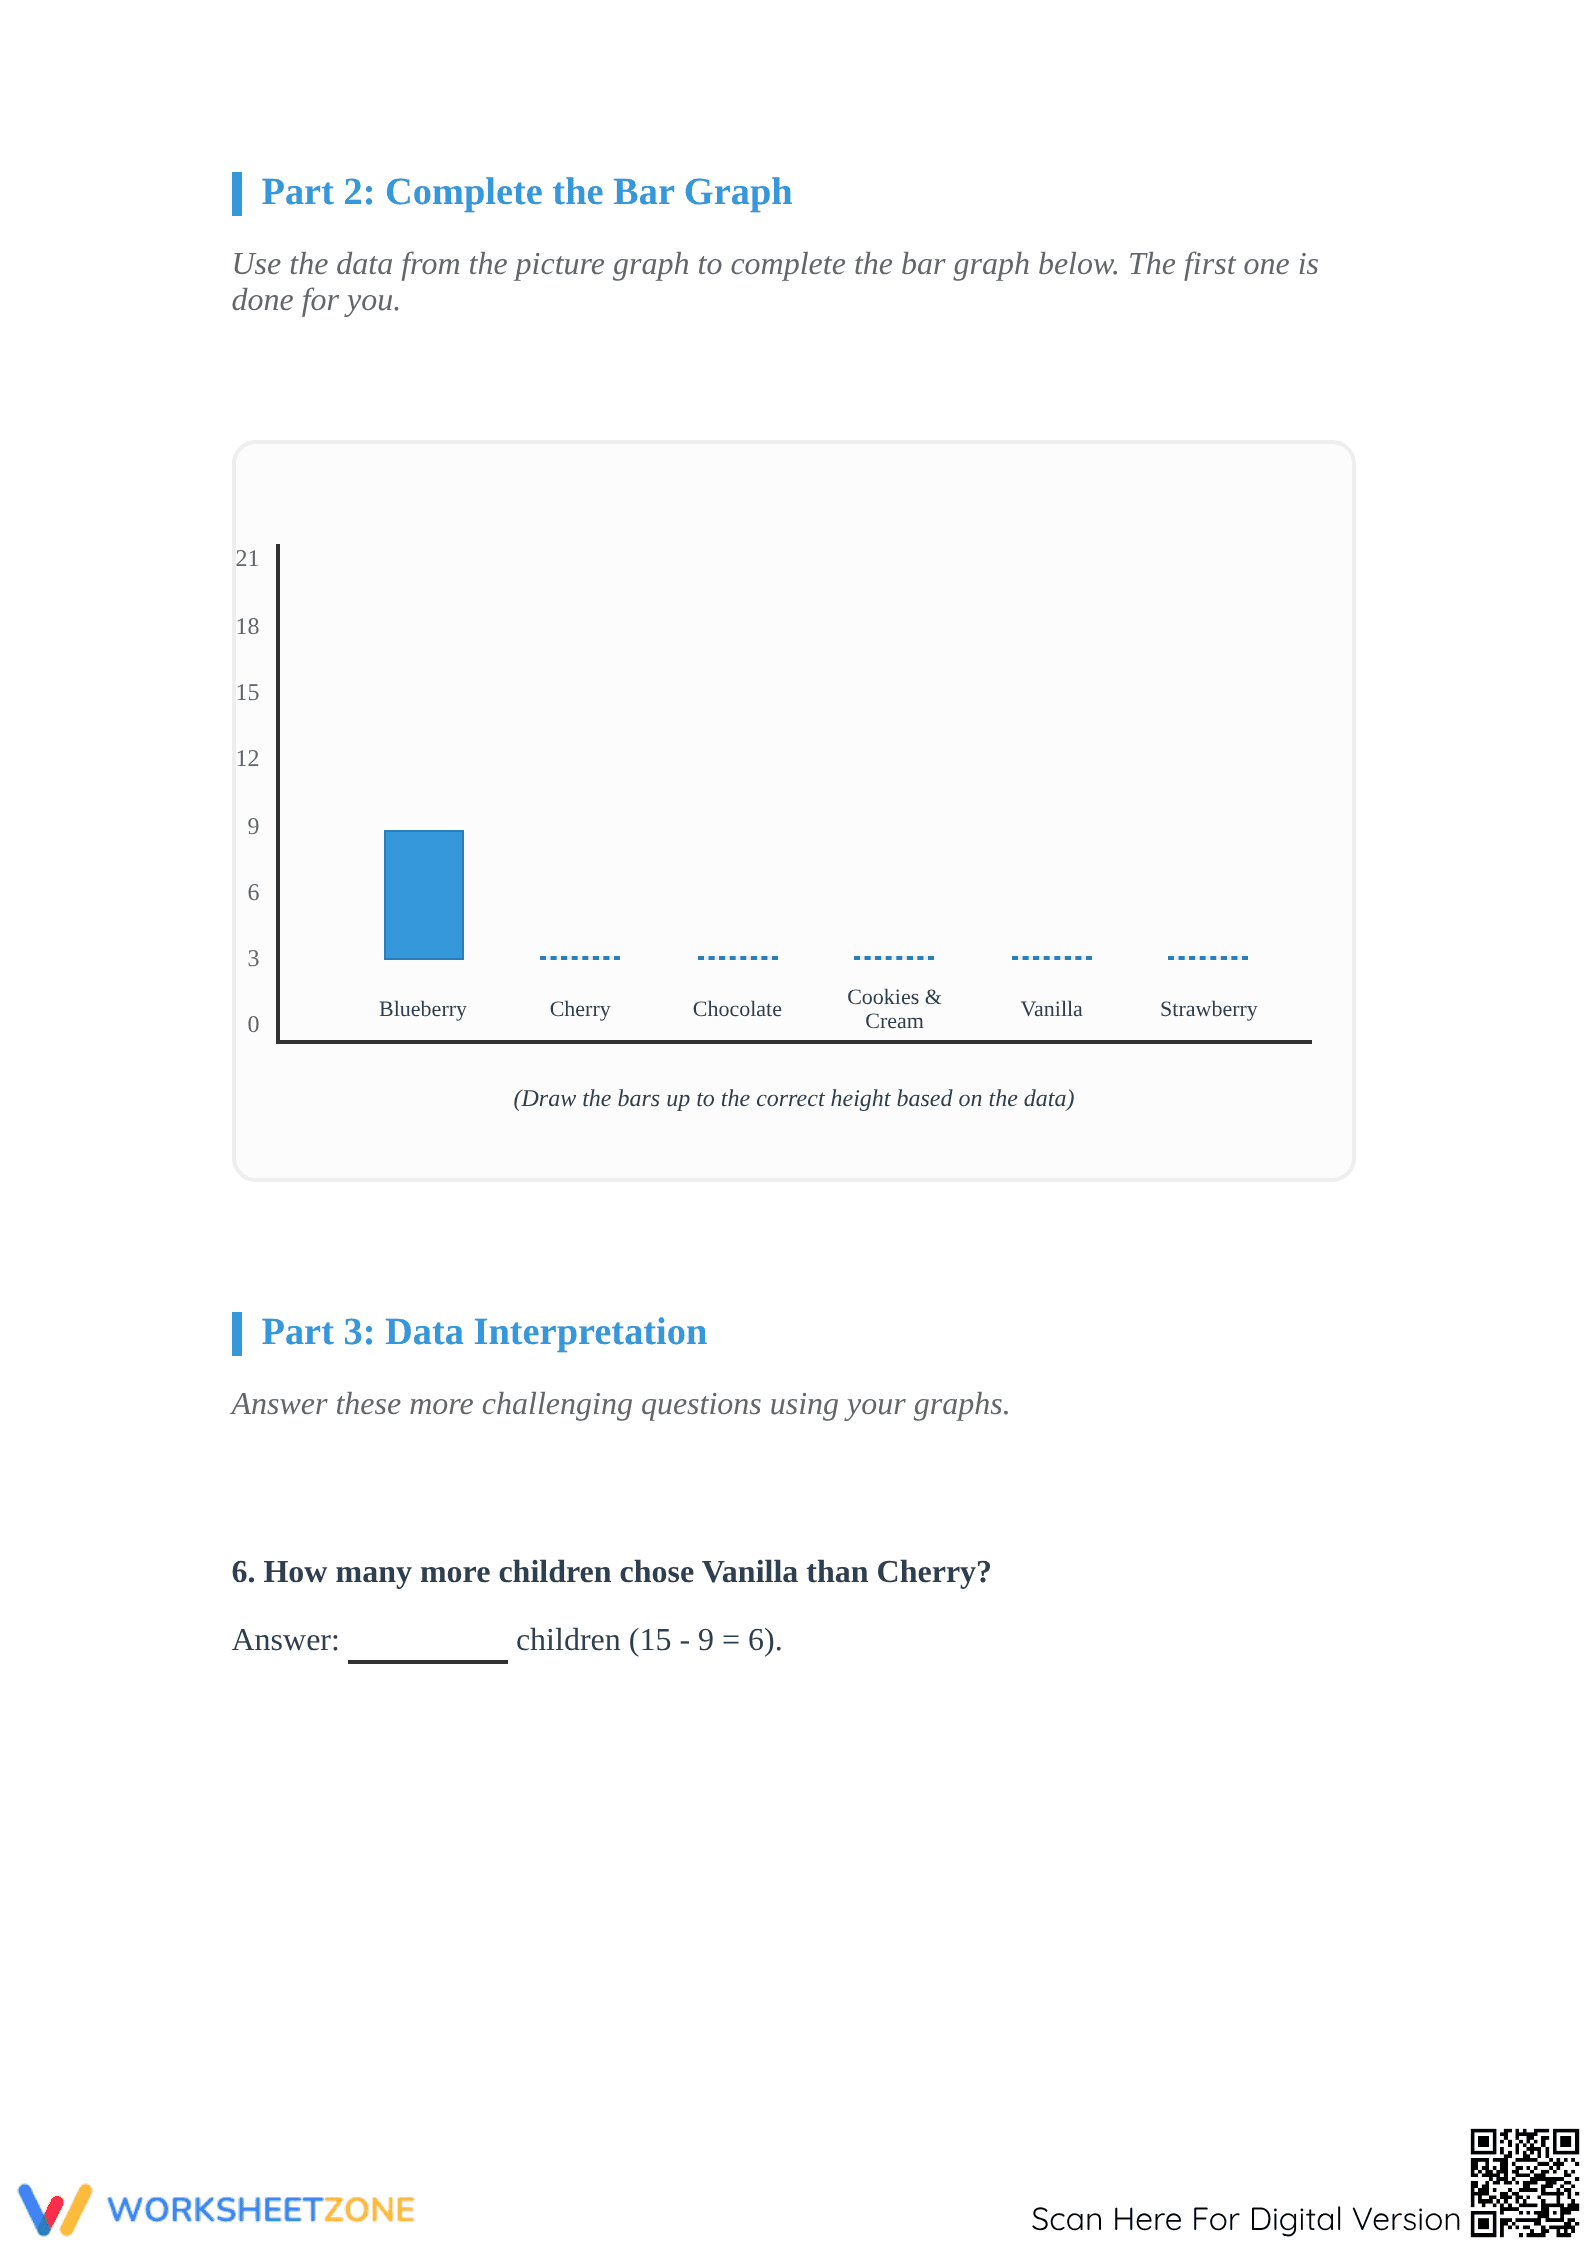
This five-page PDF includes four student activity pages and a full answer key. It starts with converting a picture graph to a bar graph, then features two pages of interpreting existing bar graphs. The final task requires students to build their own bar graph from a tally chart, assessing the skill comprehensively.
Skill Progression
The worksheet is structured to support a gradual-release model of instruction, moving students from guided to independent practice.
- Guided Practice: The first task provides a direct model, asking students to transfer data from a pictograph to a bar graph, reinforcing the one-to-one correspondence of data representation.
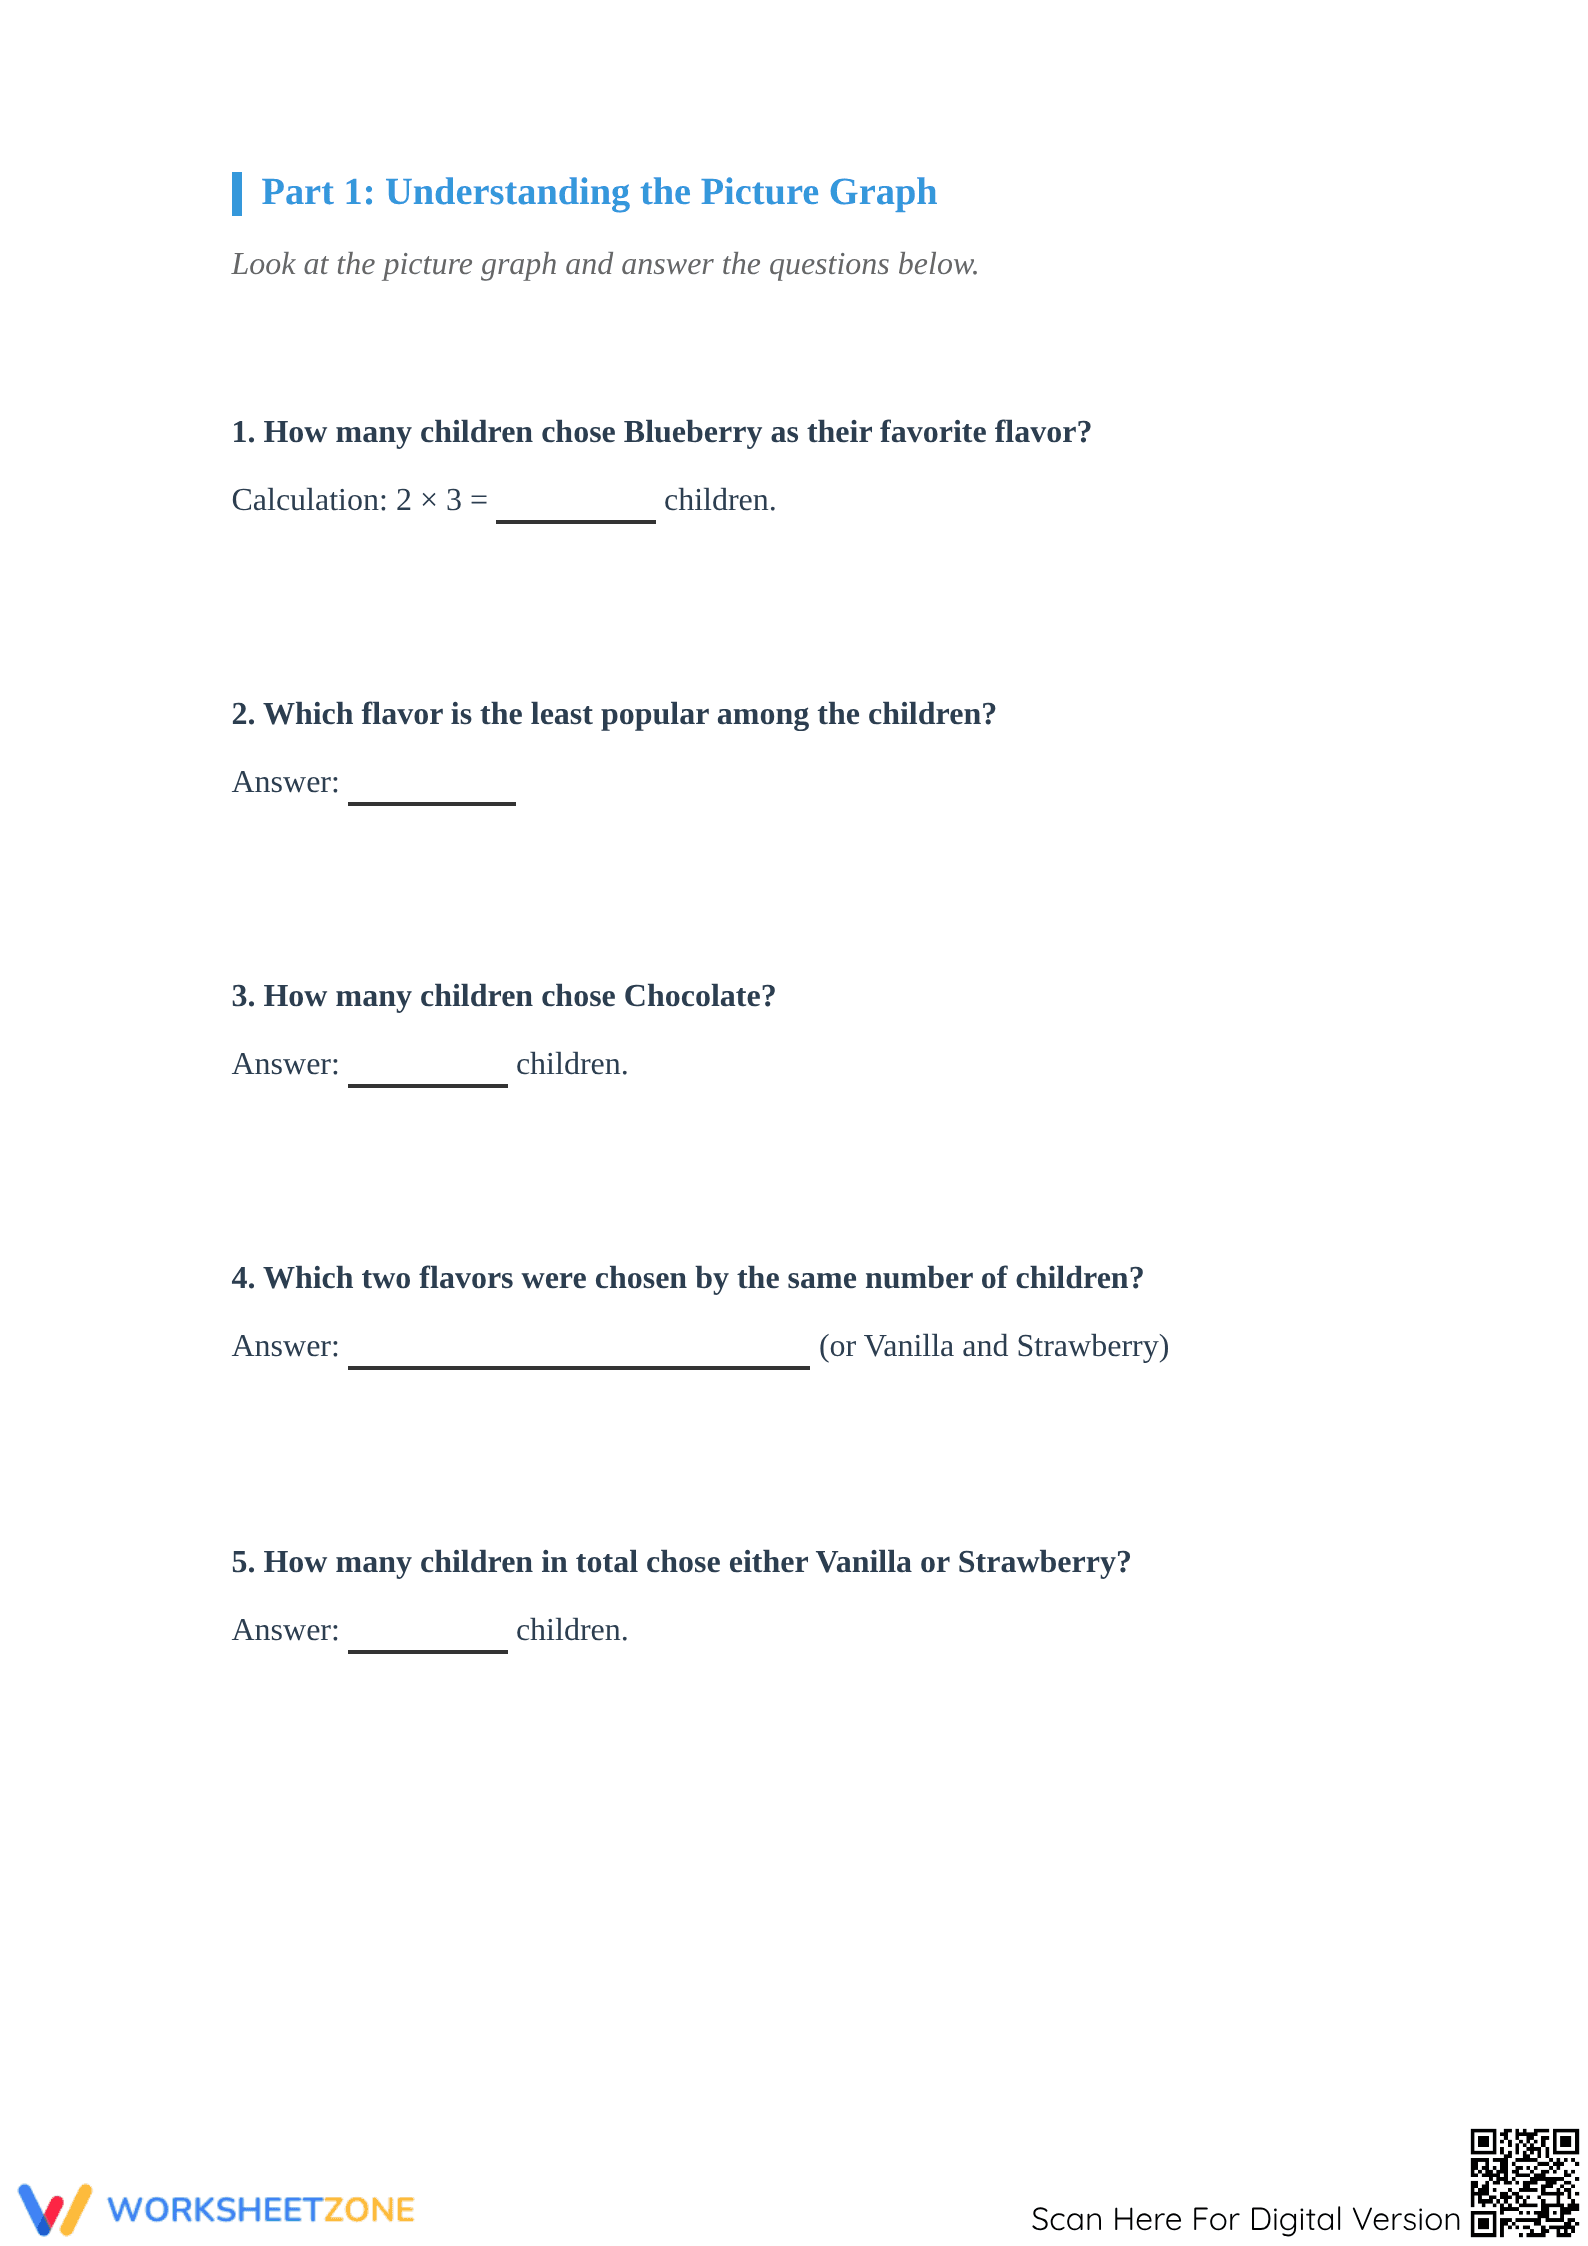
- Supported Practice: The next two sections provide structured practice in reading and interpreting existing bar graphs, with targeted questions that guide students to key data points.
- Independent Practice: The final task challenges students to synthesize their skills by creating a complete bar graph from a raw data set (a tally chart), demonstrating mastery of the concept.
Standards Alignment
This worksheet is aligned with Common Core standard CCSS.MATH.CONTENT.3.MD.B.3, which requires students to draw and interpret scaled bar graphs to represent data. The tasks provide multiple opportunities to meet this benchmark. The standard code can be copied directly into lesson plans, IEP goals, or curriculum maps.
How to Use It
This worksheet works well for independent practice after a lesson on graphing (allow 25-40 minutes). Alternatively, use it as a formative assessment. While students work, circulate to check if they are correctly labeling axes and using a consistent scale, which offers a quick check for understanding.
Who It's For
Designed for Grade 3 and Grade 4 students learning or reviewing bar graphs. It's ideal for whole-class work, small groups, or homework. This worksheet pairs well with an introductory anchor chart on the parts of a graph.
This worksheet provides practice in data representation, a foundational mathematical skill. Aligned with CCSS.MATH.CONTENT.3.MD.B.3, it asks students to organize and interpret categorical data. Research from Fisher & Frey (2014) supports moving students from guided to independent work. This resource follows that principle, starting with data translation and ending with graph construction. By engaging with these tasks, students build the fluency to use graphs for answering questions, a key component of quantitative reasoning critical for success in later grades. This targeted practice prepares them for more complex data analysis.