


























Views
Downloads




Printable Bar Graph Worksheet | Grade 3 Math
Paste this activity's link or code into your existing LMS (Google Classroom, Canvas, Teams, Schoology, Moodle, etc.).
Students can open and work on the activity right away, with no student login required.
You'll still be able to track student progress and results from your teacher account.
Strengthen essential data analysis skills with this focused bar graph worksheet for Grade 3 students. Through a series of clear and engaging visual problems, learners will practice reading, interpreting, and comparing data presented in bar graphs. This resource provides targeted practice to build a foundational understanding of data representation.
At a Glance
- Grade: 3 · Subject: Math
- Standard:
CCSS.MATH.CONTENT.3.MD.B.3— Solve problems using information from scaled bar graphs.- Skill Focus: Interpreting Bar Graphs
- Format: 4 pages · 16 problems · Answer key included · PDF
- Best For: Independent practice, station work, formative assessment
- Time: 20–30 minutes
What's Inside
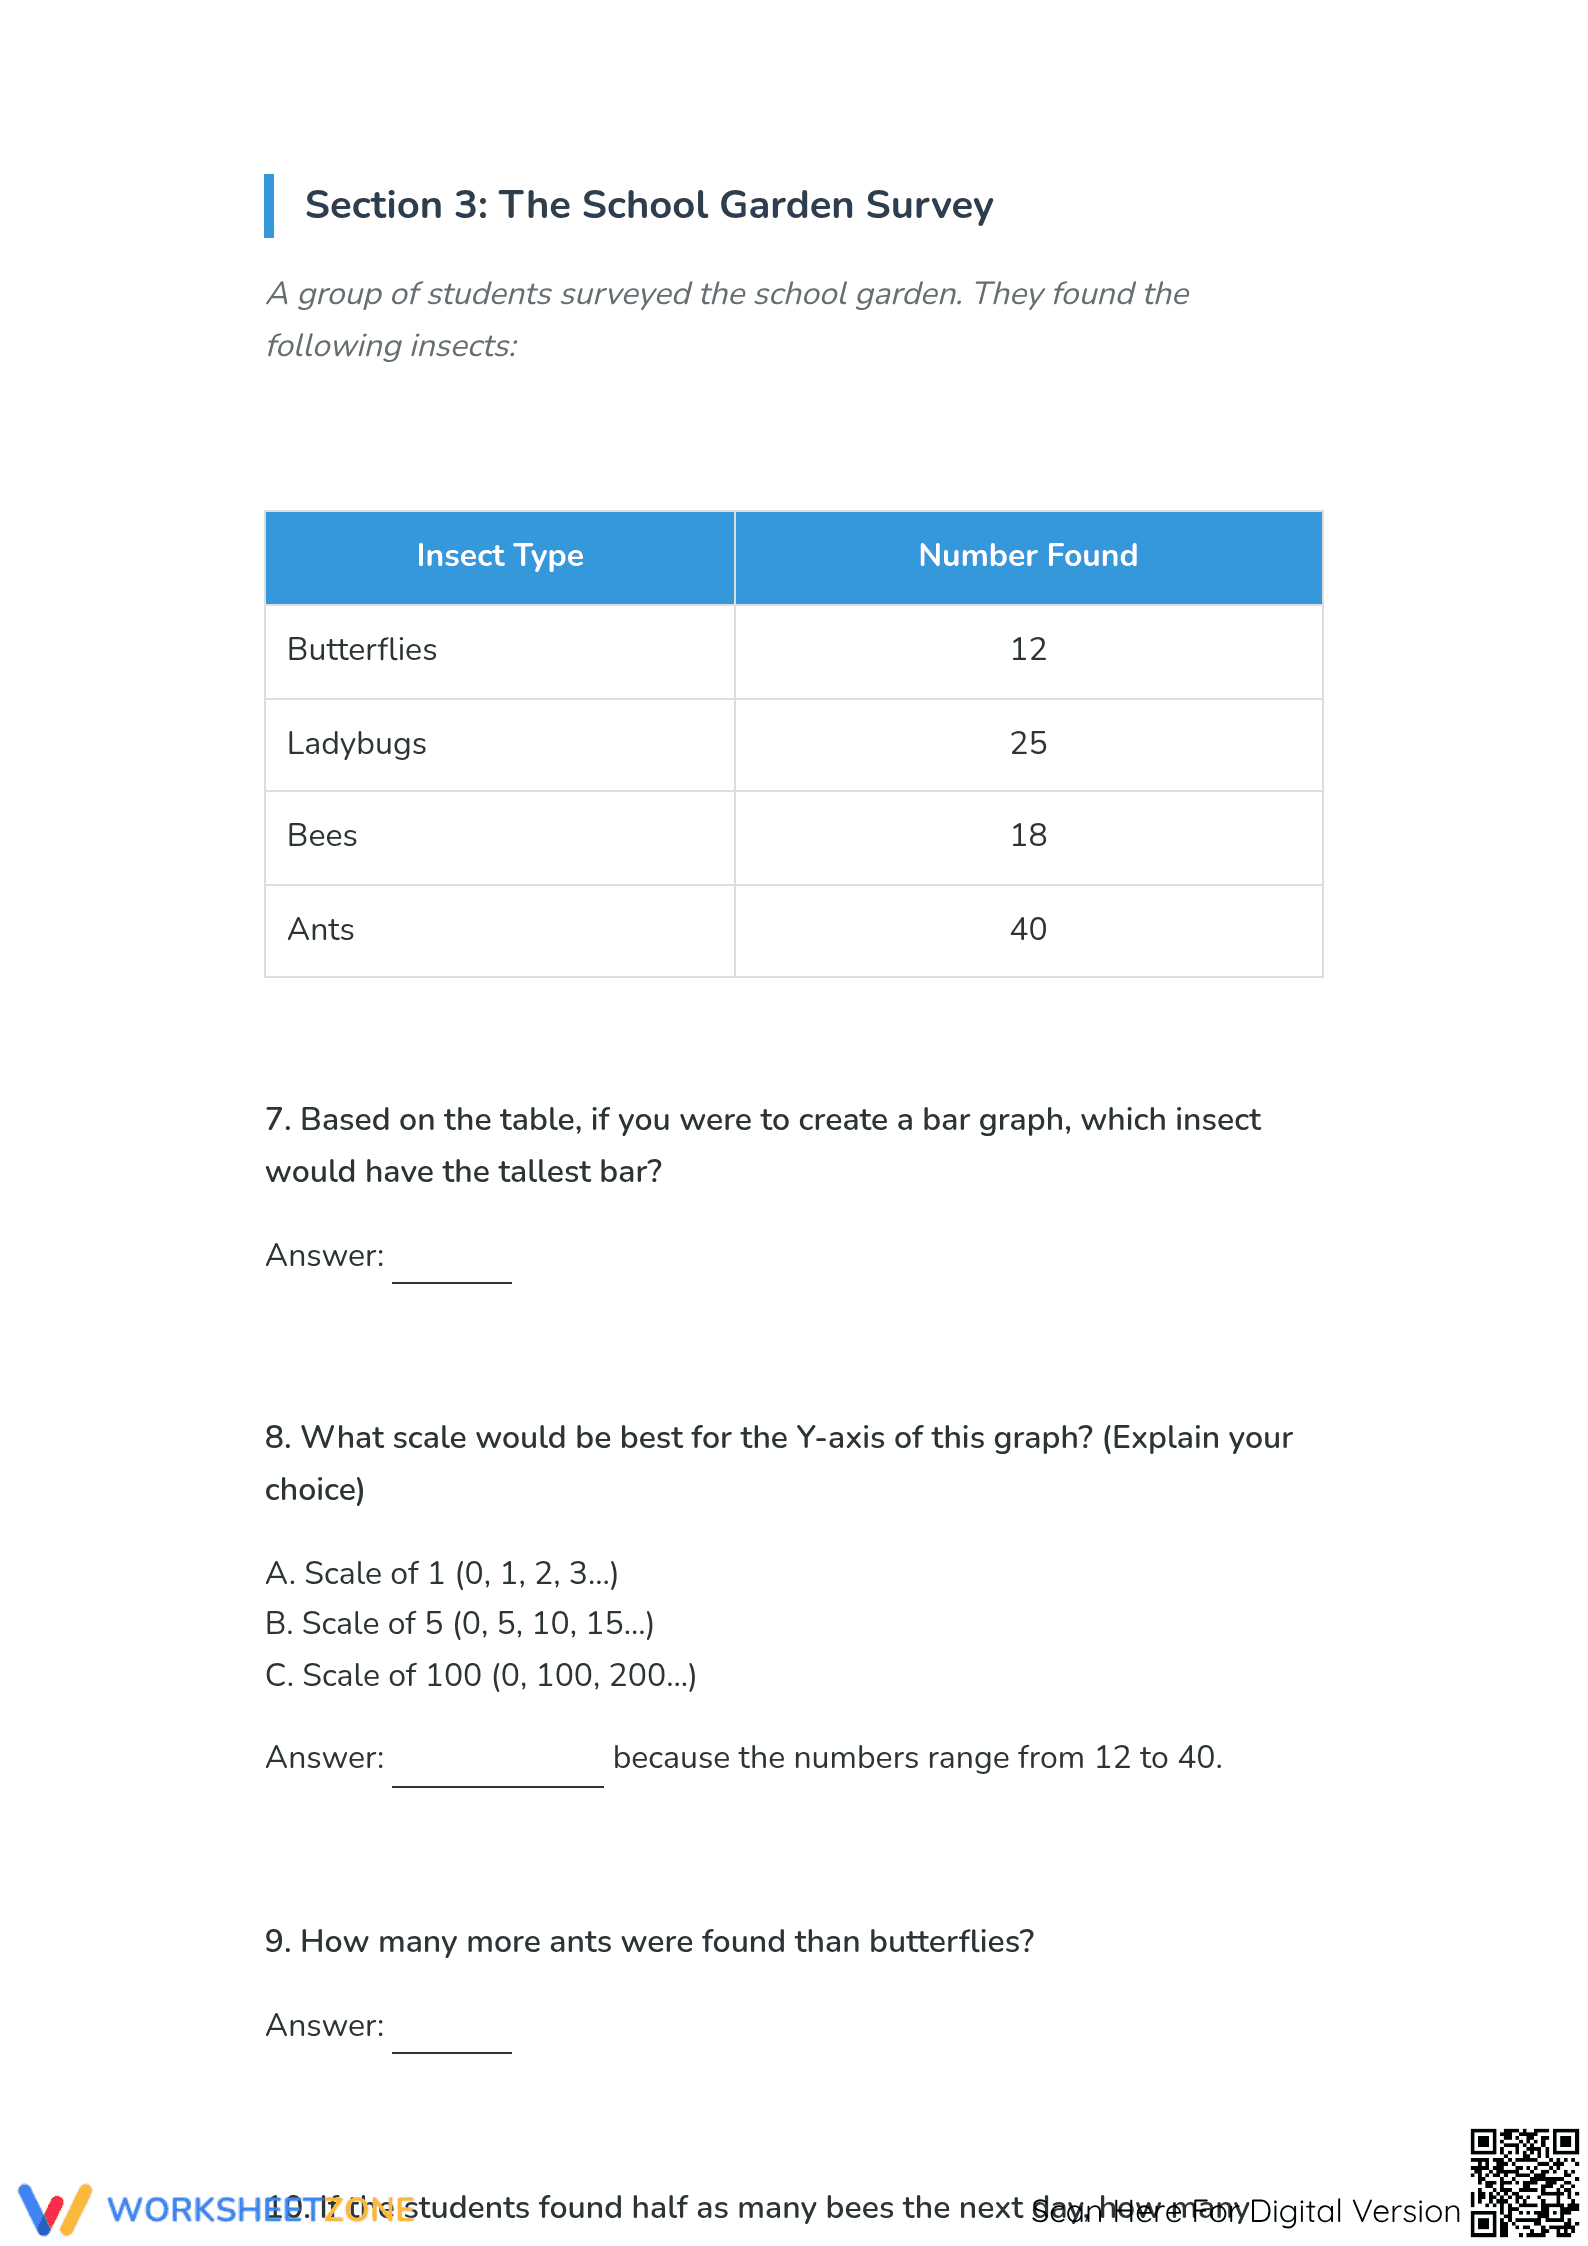
This four-page worksheet packet contains four distinct bar graph exercises, each with its own data set and four corresponding questions. The topics—favorite fruits, farm items, ways to get to school, and favorite sports—are designed to be relatable for young learners. A complete, four-page answer key is also provided for quick and easy grading.
Skill Progression
- Guided Practice: The first worksheet, 'Favorite Fruit,' can be used as a guided practice activity. The teacher can model how to read the x and y-axis and answer the first one or two questions with the class, ensuring all students understand how to locate the correct information on the graph.
- Supported Practice: The next two worksheets, 'Items on a Farm' and 'Ways of Getting to School,' serve as supported practice. Students can work in pairs or small groups to discuss their answers, providing peer support as they tackle similar 'how many more/less' and 'total' questions.
- Independent Practice: The final worksheet, 'Favorite Sport,' is ideal for independent practice or a formative assessment. By this point, students should be able to apply their skills independently. This gradual-release model ensures students build confidence and competence.
Standards Alignment
This worksheet is directly aligned with Common Core standard CCSS.MATH.CONTENT.3.MD.B.3, which requires students to draw and interpret scaled bar graphs to solve problems. The tasks specifically target the problem-solving component of the standard, asking students to perform one- and two-step calculations based on the data presented. Both standard codes can be copied directly into lesson plans, IEP goals, or district curriculum mapping tools.
How to Use It
This resource is flexible for various instructional moments: a follow-up activity after direct instruction, or a math station rotation. For a quick formative check, observe student understanding of y-axis values and comparison questions. Expect completion in 20 to 30 minutes.
Who It's For
This worksheet is designed primarily for third-grade students learning about data and graphing. The clear layout and relatable topics make it accessible for most learners in a general education classroom. For students needing extra support, pair this worksheet with a physical set of counting cubes to help them visualize the quantities. It's a natural companion to an anchor chart that defines key terms like 'axis,' 'scale,' and 'bar graph.'
Foundational data literacy, targeted by CCSS.MATH.CONTENT.3.MD.B.3, is critical for later statistical reasoning. This worksheet provides focused practice on interpreting scaled bar graphs, a skill essential for developing quantitative thinking. Students solve one- and two-step problems using graphical information, moving beyond simple data retrieval to applied analysis. According to Fisher & Frey (2014), structured, independent practice within a gradual-release framework solidifies learning. The 16 problems offer a concise yet effective tool to assess understanding of representing and interpreting data, a core competency for Grade 3. This builds robust understanding for more complex data challenges ahead.


