12th Grade Graphs of Polar Equations Worksheets Printable
These 12th grade graphs of polar equations worksheets give precalculus teachers a structured, printable set for building the skills students need to move from equation form to accurate sketch — recognizing curve families, applying symmetry tests, selecting strategic angles, and producing a defensible graph on a polar grid. The worksheets are designed around the specific sequence of decisions a student must make before putting pencil to grid.
What's Inside the Set
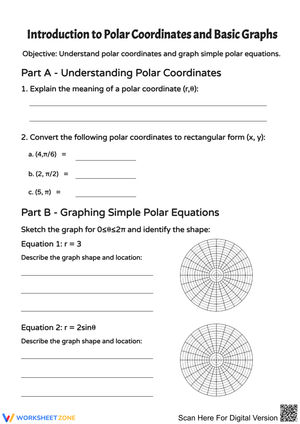
Each worksheet targets a distinct stage of the polar graphing process rather than asking students to do everything at once. The early worksheets focus on plotting: students evaluate r at selected angles, including values where r is negative, and place those points on a labeled polar grid. Negative r gets explicit attention here because it is where a large share of graphing errors originate — a student who skips those values will produce a rose missing half its petals or a limacon without its inner loop.
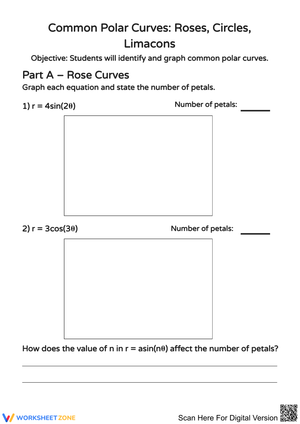
Later worksheets move into curve-family identification and parameter analysis. Students classify an equation as a circle, rose, cardioid, limacon, or lemniscate, then connect specific coefficients and constants to visual properties: petal count in rose curves of the form r = a cos(nθ), the ratio of a to b in limacons (which governs whether an inner loop appears), and the orientation of a lemniscate axis. The final worksheets in the set are mixed review — no labels, no scaffolding — where students decide which strategy fits each equation and produce a complete graph from scratch.
- Guided plotting worksheets with angle tables and blank polar grids for building coordinate fluency
- Symmetry worksheets asking students to test for symmetry about the polar axis, the line θ = π/2, and the pole before sketching
- Curve-family classification worksheets requiring written justification alongside the label
- Parameter analysis worksheets connecting equation constants to petal count, loop presence, and shape dimensions
- Graph-to-equation matching worksheets where students explain why a given graph fits one equation and not another
- Mixed review worksheets for quiz prep, station rotations, or end-of-unit independent practice
Standard Alignment
These worksheets align to the precalculus expectations addressed in the Common Core State Standards for Mathematical Practice, particularly MP.7 (Look for and make use of structure) and MP.8 (Look for and express regularity in repeated reasoning), which govern how students are expected to work with families of functions. More specifically, the polar graphing content aligns to the CCSS-M functions domain's treatment of trigonometric and parametric representations, as well as to the precalculus-level expectations in state frameworks that include polar coordinates as a Pre-AP or calculus-preparatory topic. In AP Precalculus (College Board), polar equations appear in Unit 3, and the curve-family identification and symmetry skills practiced in these worksheets directly support that unit's learning objectives. Students who can move fluently between equation form and graph shape in 12th grade precalculus arrive at AP Calculus BC — where polar area and arc length require exactly this fluency — with one less conceptual gap to close.
Frequent Student Errors Worth Watching For
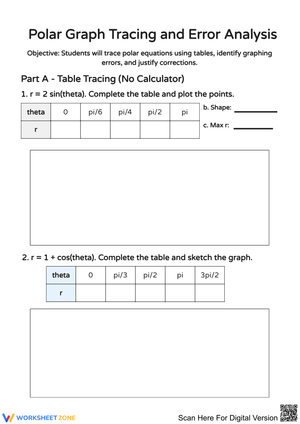
The most persistent mistake in polar graphing is not computational — it is procedural. Students who can evaluate r = 2 + 3 cos θ at any angle correctly will still produce an incomplete or distorted graph if they treat the process as random point-plotting rather than structured investigation. A student who plots only the quadrantal angles on a four-petal rose will connect those four points into a vague blob because the curve's maximum and zero values fall at multiples of π/4, not π/2. The worksheets build in angle-selection prompts specifically to break that habit.
A second predictable error is misreading the limacon family. Students often know that r = a + b cos θ produces a limacon, but they do not automatically register that the a/b ratio determines inner loop presence. A student who sketches r = 1 + 2 cos θ (inner loop) the same way as r = 3 + 2 cos θ (convex limacon) has learned the name without learning the structure. Worksheets in this set include side-by-side comparison problems that force students to notice what changes and what stays the same across the family. A third error — plotting negative r values on the wrong side of the origin — is common enough that it warrants its own brief worksheet before students attempt full family sketching.
How to Build These Worksheets Into Your Lesson Plans
The recognition-before-sketching split is worth building into the weekly routine explicitly. When a student sits down to sketch r = 3 cos(4θ), she is simultaneously trying to identify the family, recall petal-count rules, decide which angles matter, handle negative r, and produce a clean graph — a genuine cognitive load problem. One practical structure is to use a short recognition-and-features worksheet as an opener on the day new curve families are introduced, and reserve the full sketching worksheet for the following day or for guided practice. Students who enter the graphing task already knowing the family and expected shape make meaningfully fewer errors than students who try to determine family and sketch simultaneously.
For the 10 minutes before the block ends, a single mixed equation works well as an exit check: classify it, state one symmetry, sketch it, name one defining feature. That four-part prompt produces more diagnostic information than "graph this equation" alone, and it takes under five minutes to scan a class set for patterns. For homework, six to eight problems across three or four curve families reveals more about fluency than a longer list of the same type — and asking students to write one sentence explaining how they identified the family gives stronger evidence of understanding than the sketch does on its own.
Station rotations work particularly well with this material. One station can run teacher-led sketching for the students who still need modeling; a second can assign independent plotting on blank polar grids; a third can use error analysis, where students receive a partially completed graph containing a specific mistake — an inner loop plotted in the wrong orientation, or petals truncated because negative r was ignored — and correct it with annotations.
Adjusting the Worksheets for a Range of Learners
Students who still need support with the polar coordinate system itself can use the plotting worksheets independently while the rest of the class works on family recognition. The plotting pages require no prior knowledge of curve families and build the coordinate fluency that underpins everything else. For students who have that fluency but struggle with mixed review, removing the family-classification step — providing the curve name and asking only for features and sketch — reduces the task to a manageable size without removing the graphing demand.
On the other end, students who move quickly through standard sketching respond well to the graph-to-equation matching worksheets, especially when asked to write a proof-style argument for why their chosen equation fits the shown graph. Asking a student to argue why r = 2 + 2 cos θ produces the shown cardioid and r = 2 + 3 cos θ does not — using specific values and symmetry evidence — pushes into the kind of analytical writing that AP Calculus BC and college mathematics courses expect.
Frequently Asked Questions
Which curve families should come first in the sequence?
Start with circles and simple roses before introducing cardioids and limacons. Circles (r = a or r = 2a cos θ) give students a polar-grid reference point they can verify easily. Roses with an even number of petals are visually distinctive and introduce the petal-count rule in a low-stakes context. Cardioids make a natural transition into limacons since a cardioid is the a = b case of the limacon family — that relationship gives students a structural anchor rather than a new rule to memorize. Lemniscates are typically best introduced last.
How many problems per worksheet is appropriate for a 12th grade class?
For sketching practice, four to six problems on a single worksheet is usually the right range. Polar graphing is slower than Cartesian graphing — students testing symmetry, selecting angles, computing values, and plotting carefully can spend five to eight minutes per equation. A worksheet with twelve problems sounds thorough but often produces rushed, careless graphs on problems seven through twelve. Shorter, focused sets produce better work and clearer evidence of what students actually understand.
Do these worksheets work as a substitute-teacher assignment?
The guided worksheets — plotting, symmetry checks, and family identification — work well for sub days because they include enough structure for students to work independently without needing a teacher to model. The full mixed-review worksheets are better reserved for days when the classroom teacher is present to catch early errors before they compound across a full set of problems.
What is the best way to use the answer keys for student self-correction?
Have students self-correct using the key before turning the worksheet in, and require them to annotate any incorrect graph with a specific note: what was wrong, and what the correct feature should be. A student who writes "missed inner loop — negative r values at angles between π/2 and 3π/2 were plotted in the wrong direction" has done more useful repair work than one who simply traces over the correct graph in red pen.
Clear All