10th grade cladogram worksheets give biology teachers a focused set of tools for one of the trickier analytical skills in evolutionary biology — reading branching diagrams, building character matrices, and tracing lineages back to a common ancestor. The set targets both morphological and molecular approaches, so students encounter the same categories of evidence that working systematists actually use when classifying organisms. Each worksheet is standalone, which means teachers can pull one into a lesson without committing to the full sequence.
The Specific Skills Each Worksheet Targets
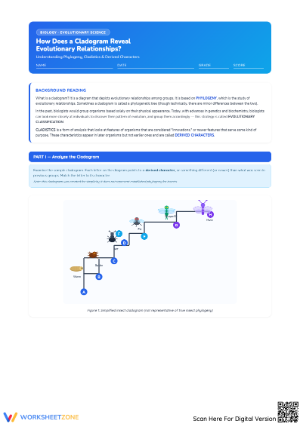
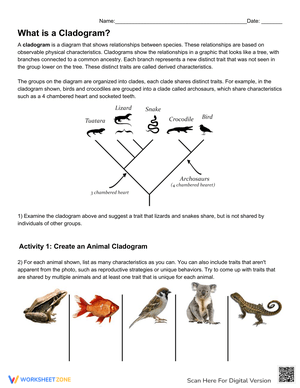
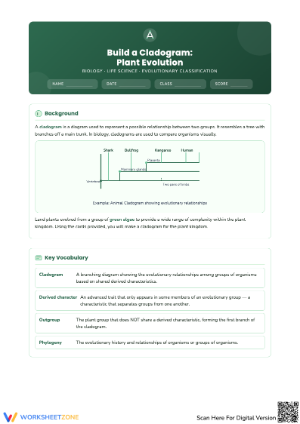
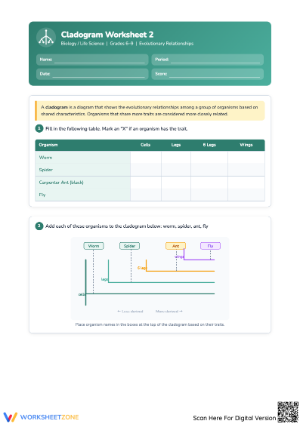
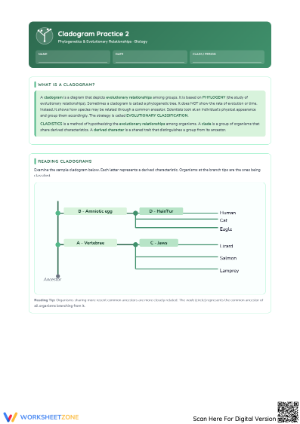
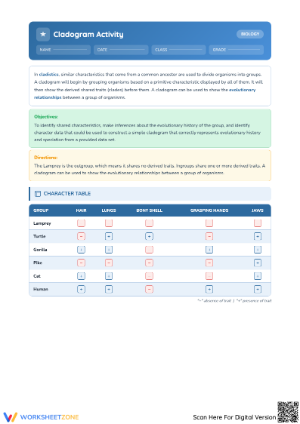
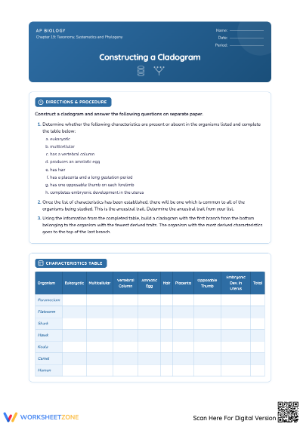
The introductory worksheets focus on diagram literacy: identifying nodes as hypothetical common ancestors rather than living species, naming the most recent common ancestor shared by a specified pair of taxa, and correctly marking complete clades by including the ancestor and every one of its descendants. That last task is genuinely difficult for most students at first. When asked to circle a clade, many students circle only the labeled tip organisms and leave out the node itself.
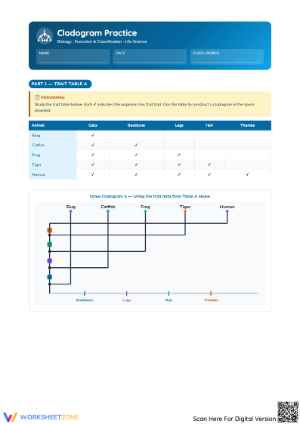
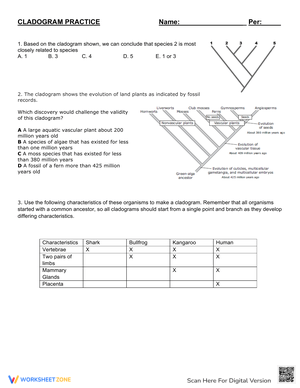
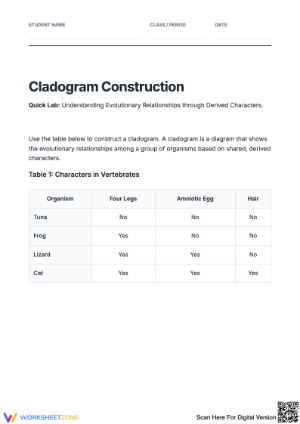
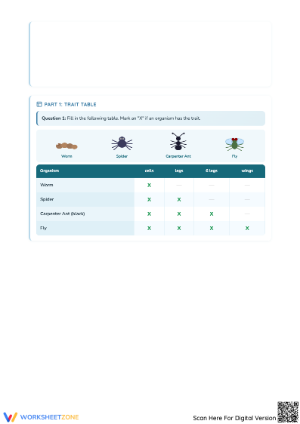
Mid-set worksheets introduce the character matrix. Students receive a table of organisms and derived traits, each cell marked for presence or absence, and they apply the principle of parsimony to determine the branching arrangement that requires the fewest independent evolutionary events. A few worksheets swap morphological traits for simplified amino acid sequences — students count mismatches between sequences and use those totals to determine relative evolutionary distance. This connects directly to any genetics content students have already covered and previews the molecular evidence that dominates professional systematics today.
One worksheet specifically addresses cladogram rotation: the same evolutionary relationships drawn three different ways, with students confirming equivalence before answering interpretation questions. This exercise exists to preempt the single most persistent misconception in cladistics at this level, which is the belief that organisms positioned on the right side of a diagram are somehow more advanced than those on the left.
Student Errors Worth Anticipating Before the Unit Ends
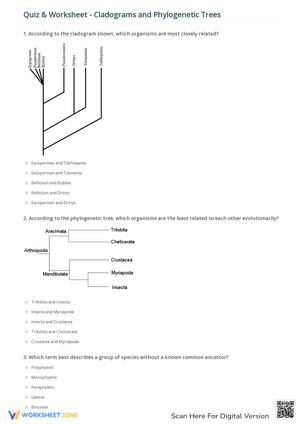
The most common analytical error is reading the diagram horizontally across the tips. Two taxa sitting side by side at the end of adjacent branches look related, and students default to proximity as a proxy for evolutionary closeness. The correct approach is to trace each lineage down through the branches to find where those paths converge — but students skip that step unless they're required to do it. Worksheets that make tracing explicit, asking students to draw the path rather than simply name the ancestor, build the habit faster than direct instruction alone does.
Trait loss trips up a consistent subset of students. If a character matrix lists "four limbs" as a derived trait and snakes appear among the taxa, many students place snakes outside the tetrapod clade entirely rather than inside it as a lineage that subsequently lost limbs. The assumption is that traits, once evolved, persist permanently. Worksheets that include a trait-loss scenario — and ask students to explain in one or two sentences why that organism still belongs to the clade — are the ones that actually dislodge this assumption.
A third predictable problem is outgroup selection. Students sometimes designate the outgroup by appearance ("it looks the most different from everything else") rather than by identifying which organism possesses the fewest shared derived traits. A worksheet that marks outgroup identification as a discrete, labeled step — separate from the branching steps that follow — makes the logic visible and harder to shortcut.
Fitting These Worksheets Into Your Biology Unit
These resources work best introduced after students have seen a complete cladogram at least once and understand at a surface level what nodes represent. The first two worksheets function well as guided practice the day after an initial lecture — students working in pairs will quickly disagree about which taxa share a node, and those disagreements produce more useful discussion than most whole-class follow-up questions manage to generate.
The character matrix worksheets belong at the midpoint of an evolution unit, after homologous structures and before natural selection takes over the focus. Leaving 10 to 12 minutes at the end of class for students to compare their completed matrices in small groups consistently works well. Students who arrived at different trees have to articulate their parsimony reasoning aloud, which is the scientific argumentation practice that NGSS targets at this level.
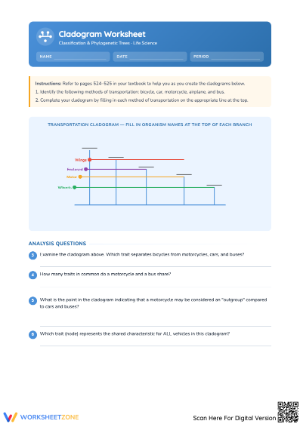
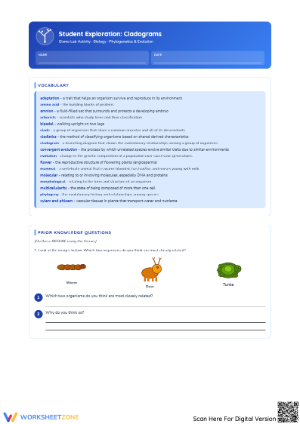
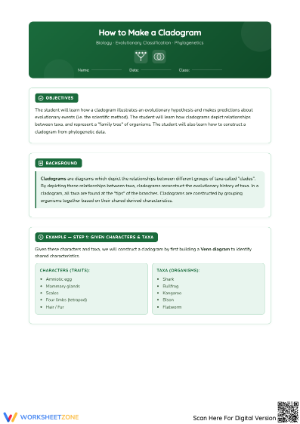
A hands-on setup activity pairs well with the introductory portion of the set: give students a collection of hardware items — screws, bolts, nails, hooks — and ask them to identify shared characteristics, build a character matrix, and draw a branching diagram before any biological taxa appear. When students then move to the first 10th grade cladogram worksheets in the set, the diagram format already feels familiar, and the biological content becomes the challenge rather than the diagram structure itself.
Adjusting the Set for a Range of Learner Levels
For students who freeze when confronted with a full character matrix, start by removing several trait columns and asking them to complete the analysis with three or four traits instead of the full set. The reduction in information lowers the cognitive load of the initial sorting decision without changing the branching logic students need to apply. The diagram step stays the same; they're just working from a smaller dataset.
Students who move through the morphological worksheets quickly can be directed to the molecular sequence comparisons in the set. Counting amino acid differences across five or six species and constructing a tree from those counts introduces a level of quantitative reasoning that extends capable students without requiring separate materials. It also opens a productive question: do the morphological and molecular trees always agree? That question doesn't have a clean answer, which makes it worth asking.
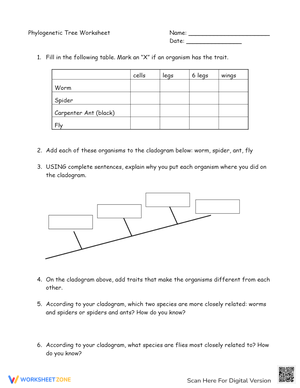
For students who need more direct support, one modification that consistently helps is having them write the name of each derived trait directly on the branch where it first appears, rather than tracking it only in the matrix. The diagram becomes self-annotating, students can audit their own reasoning at a glance, and errors are much easier to spot during a quick walkthrough.
Standard Alignment
NGSS HS-LS4-1 requires students to communicate scientific information establishing that common ancestry and biological evolution are supported by multiple lines of empirical evidence — anatomical similarities, molecular sequences, and the fossil record. Each worksheet in this set places students in direct contact with that evidence: they analyze character data, count molecular differences, and construct branching diagrams that represent their interpretation of what that evidence shows. That is the science practice of analyzing and interpreting data applied to a specific disciplinary core idea, with no artificial separation between the content standard and the analytical process. The 10th grade cladogram worksheets in this set fit naturally at the intersection of the Heredity and Biological Evolution strands, typically landing in 10th grade biology during the first half of an evolution unit — before instruction shifts toward natural selection mechanisms and speciation.
Frequently Asked Questions
How do I get students unstuck when they don't know where to start on a character matrix?
Teach them to work sequentially rather than scanning the full matrix at once. Step one: identify the outgroup — the organism with the fewest derived traits. It branches off first. Step two: find the one trait that appears in every remaining organism. That trait marks the first node above the outgroup. Step three: repeat — find the next trait shared by all remaining organisms and add a node. Each step adds one branch point, and students only have to look at one column at a time. The 10th grade cladogram worksheets in this set build that sequence directly into the task structure, so students have a procedural reference they can return to when they lose their place.
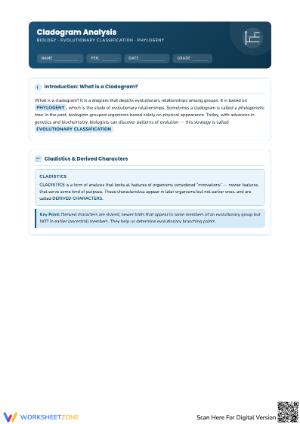
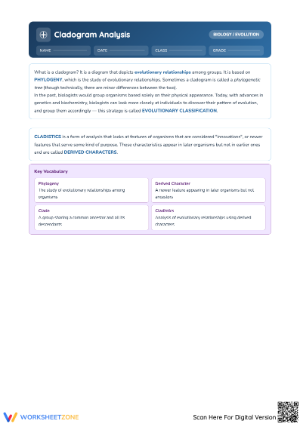
What's the difference between a cladogram and a phylogenetic tree, and do I need to address both in 10th grade?
A cladogram shows branching order based on shared derived traits; branch lengths carry no specific quantitative meaning. A phylogenetic tree assigns branch lengths proportional to evolutionary time or genetic divergence. For 10th grade, cladograms are the right focus. Students need to work through parsimony reasoning and character-based branching before branch lengths add interpretive value rather than confusion. These worksheets stay in cladogram territory throughout, though a brief teacher note in the set acknowledges phylogenetic trees as a related tool students will likely encounter in AP Biology or college coursework.
My students keep saying organisms on the right side are "more evolved." How do I correct that?
The rotation worksheet in this set exists specifically for this. When students confirm that the same taxon can appear on either the left or the right depending on how the diagram is oriented — and that neither position implies hierarchy — the spatial assumption loses its grip. It helps to follow the worksheet with a brief class conversation about what "evolved" actually means: every living organism at the tips of a cladogram is equally distant from the common ancestor at the root. The misconception comes from mapping a narrative of progress onto a diagram that encodes only shared ancestry, and naming that explicitly tends to unstick it.
Can I use the molecular worksheets with students who haven't had genetics yet?
Yes, with minimal setup. The molecular worksheets present amino acid sequences as letter strings. Students count mismatches between pairs of sequences — they do not need to understand codons, protein synthesis, or gene expression to do this. A single sentence of context is enough: fewer differences between two sequences suggests a more recent shared ancestor. That said, these worksheets land with more depth later in the year, after students have encountered the terms DNA and gene in a biology context. Sequence comparison reinforces the genetics unit rather than front-loading it, so the timing matters even when the prerequisite knowledge is minimal.