


Views
Downloads
Volunteer Line Graph Worksheet | Printable Grade 5 Aligned
Paste this activity's link or code into your existing LMS (Google Classroom, Canvas, Teams, Schoology, Moodle, etc.).
Students can open and work on the activity right away, with no student login required.
You'll still be able to track student progress and results from your teacher account.
Master Data Interpretation with Real-World Scenarios
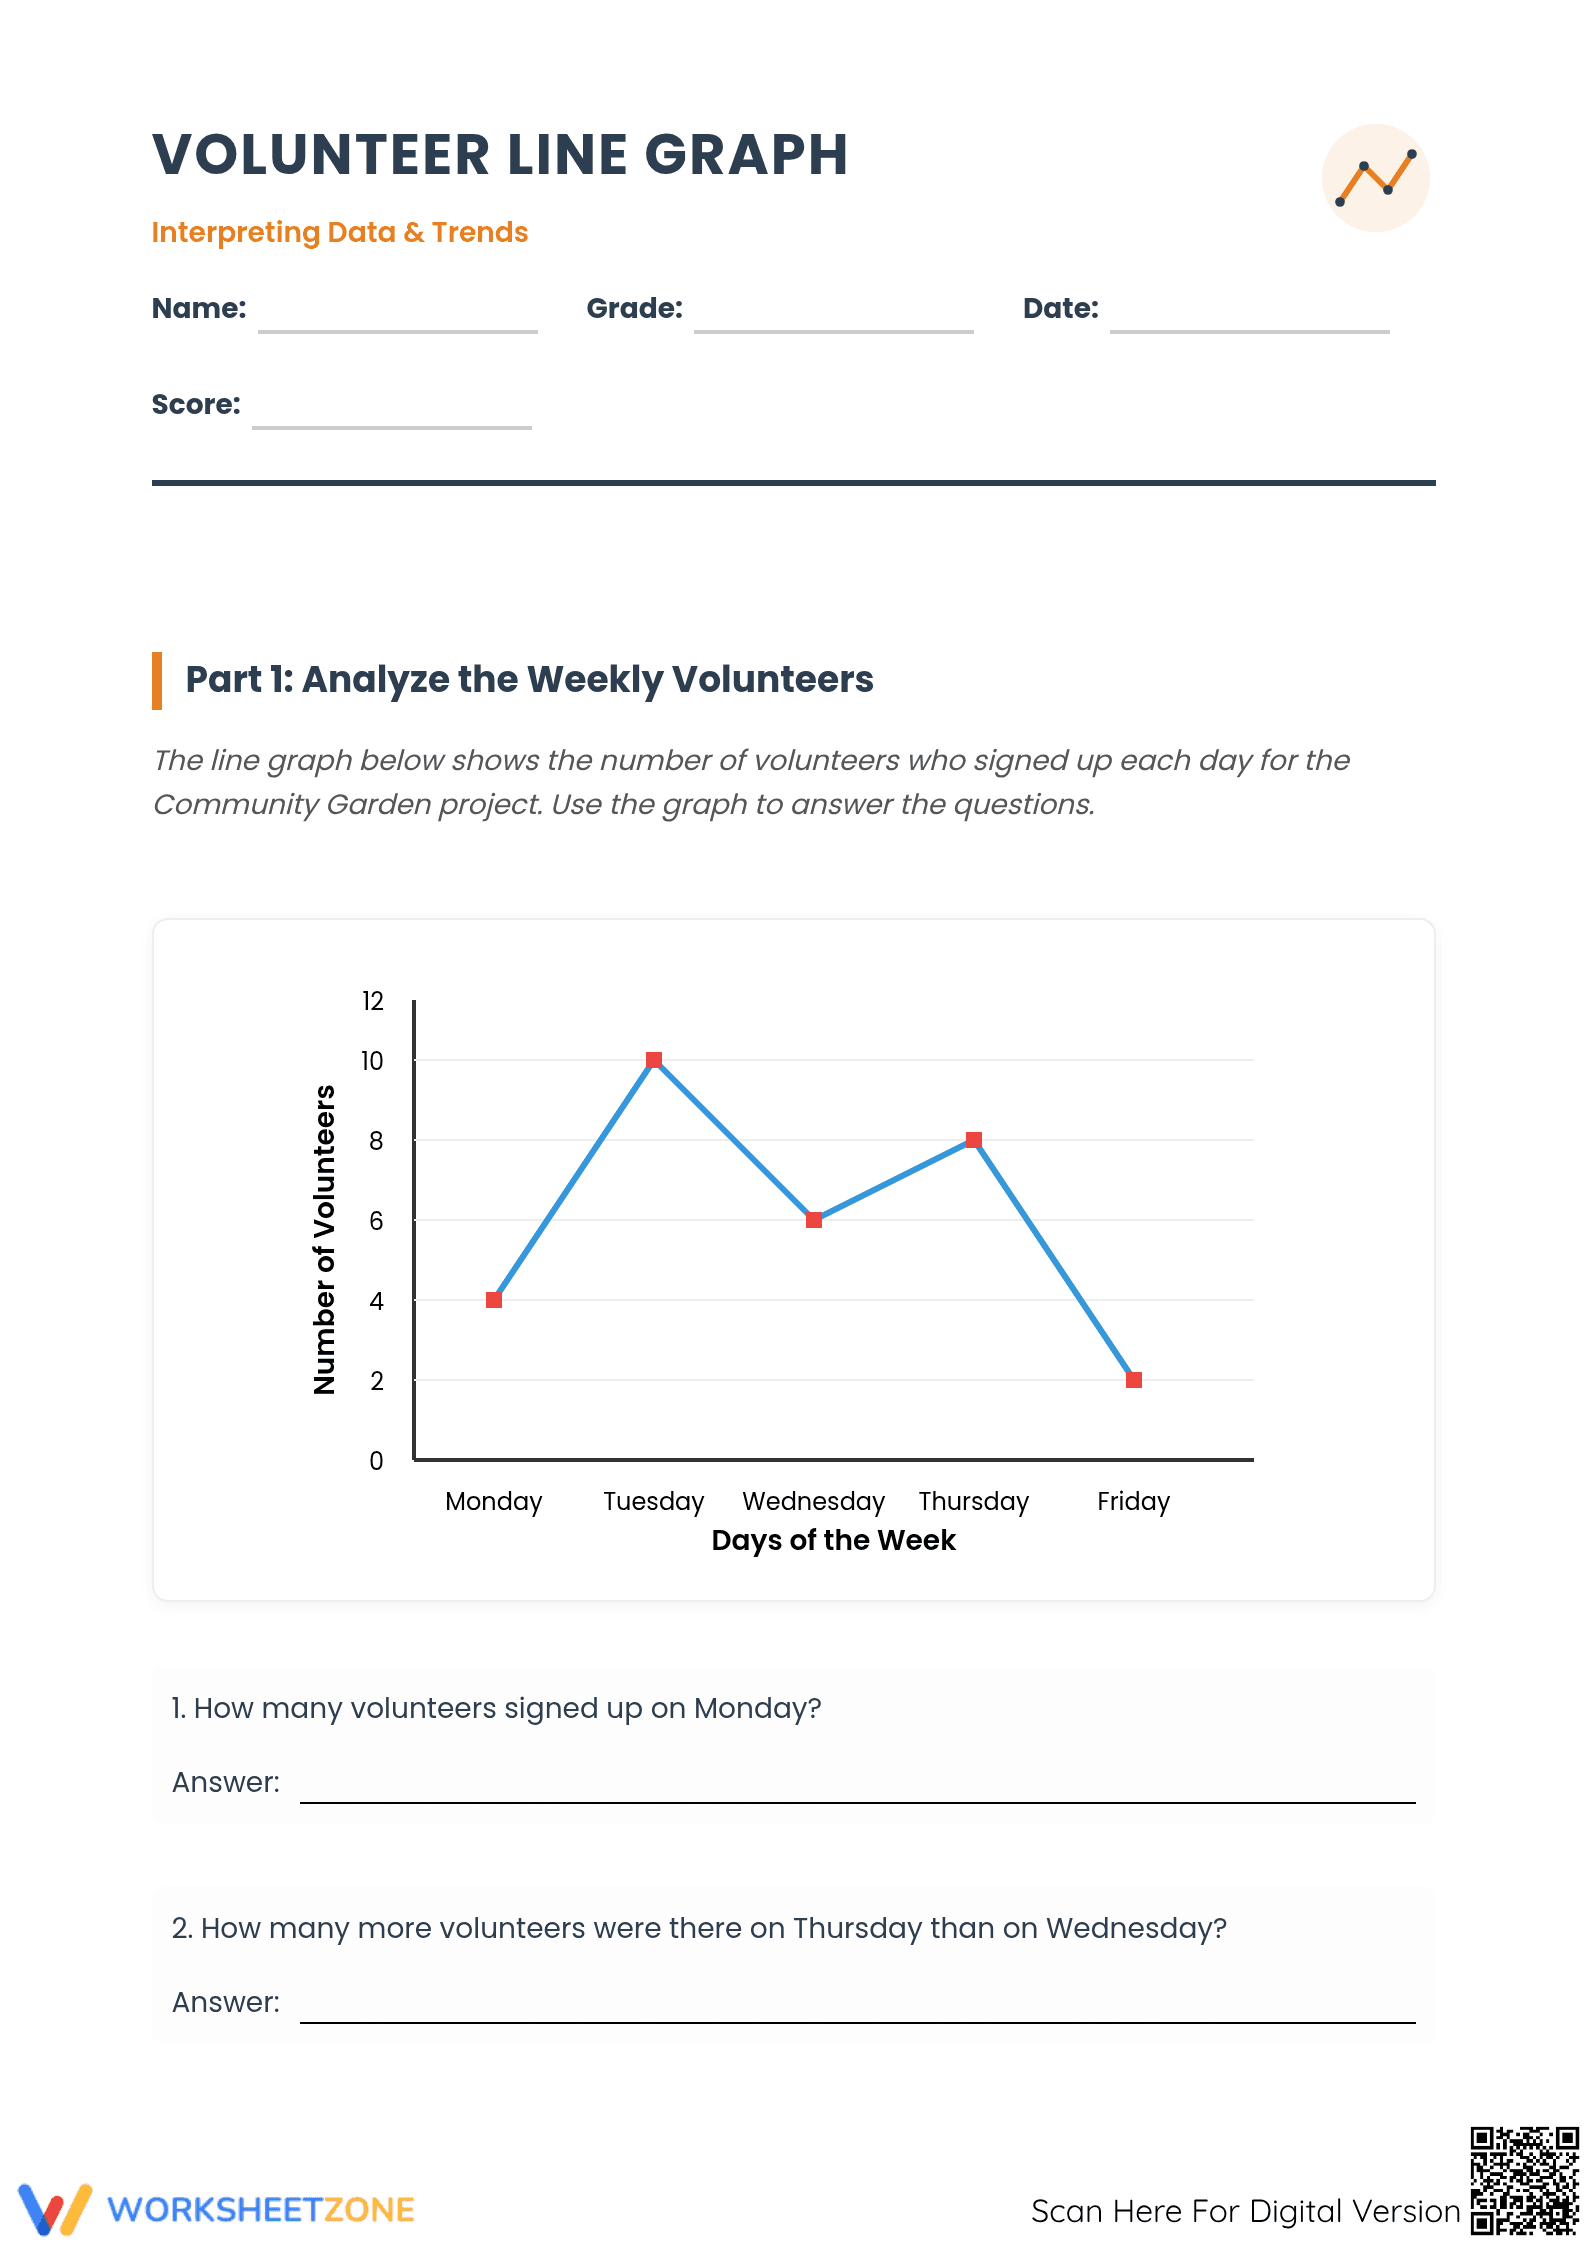
This comprehensive three-page worksheet helps students master the essential skill of data interpretation using a real-world volunteer dataset. Students will analyze coordinates on a line graph, calculate differences between data points, identify significant weekly trends, and perform comparative analysis between two distinct community projects to draw logical, evidence-based conclusions.
At a Glance
- Grade: 5 · Subject: Math · Data Analysis
- Standard:
CCSS.MATH.CONTENT.5.G.A.2— Represent and interpret coordinate values of points in real-world contexts- Skill Focus: Line Graph Analysis & Trend Comparison
- Format: 3 pages · 12 problems · Answer key included · PDF
- Best For: Independent practice or formative assessment
- Time: 25–35 minutes
What's Inside
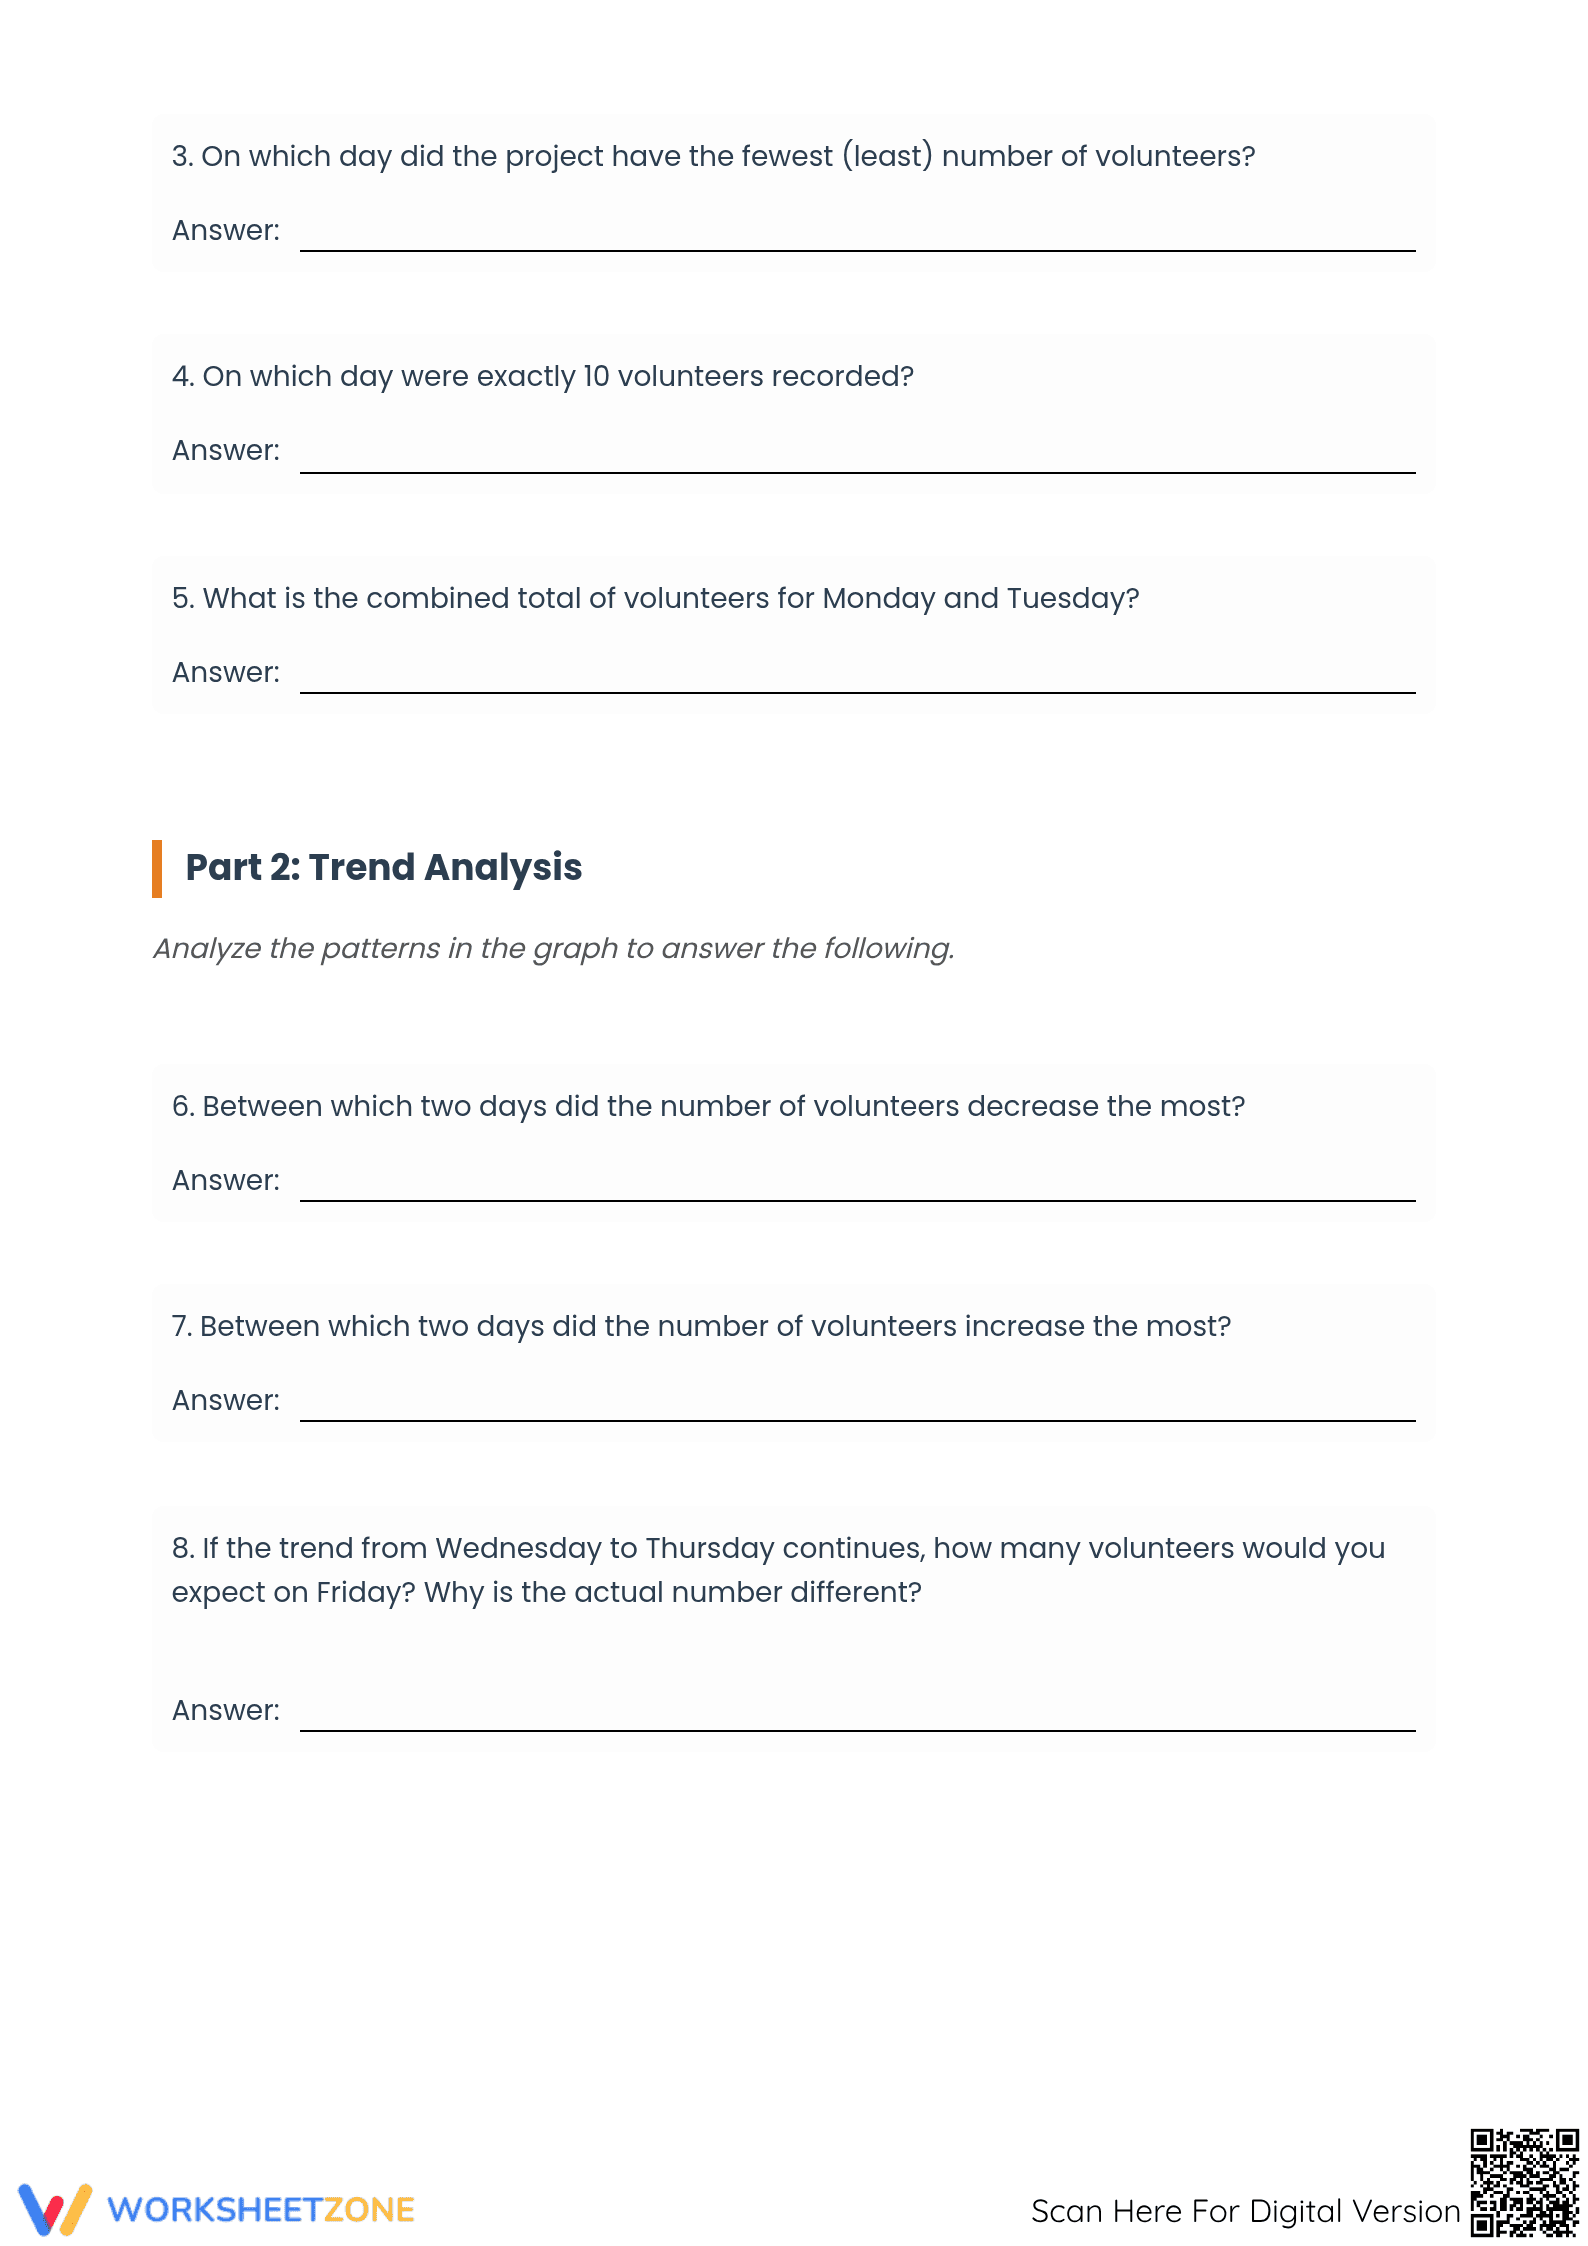
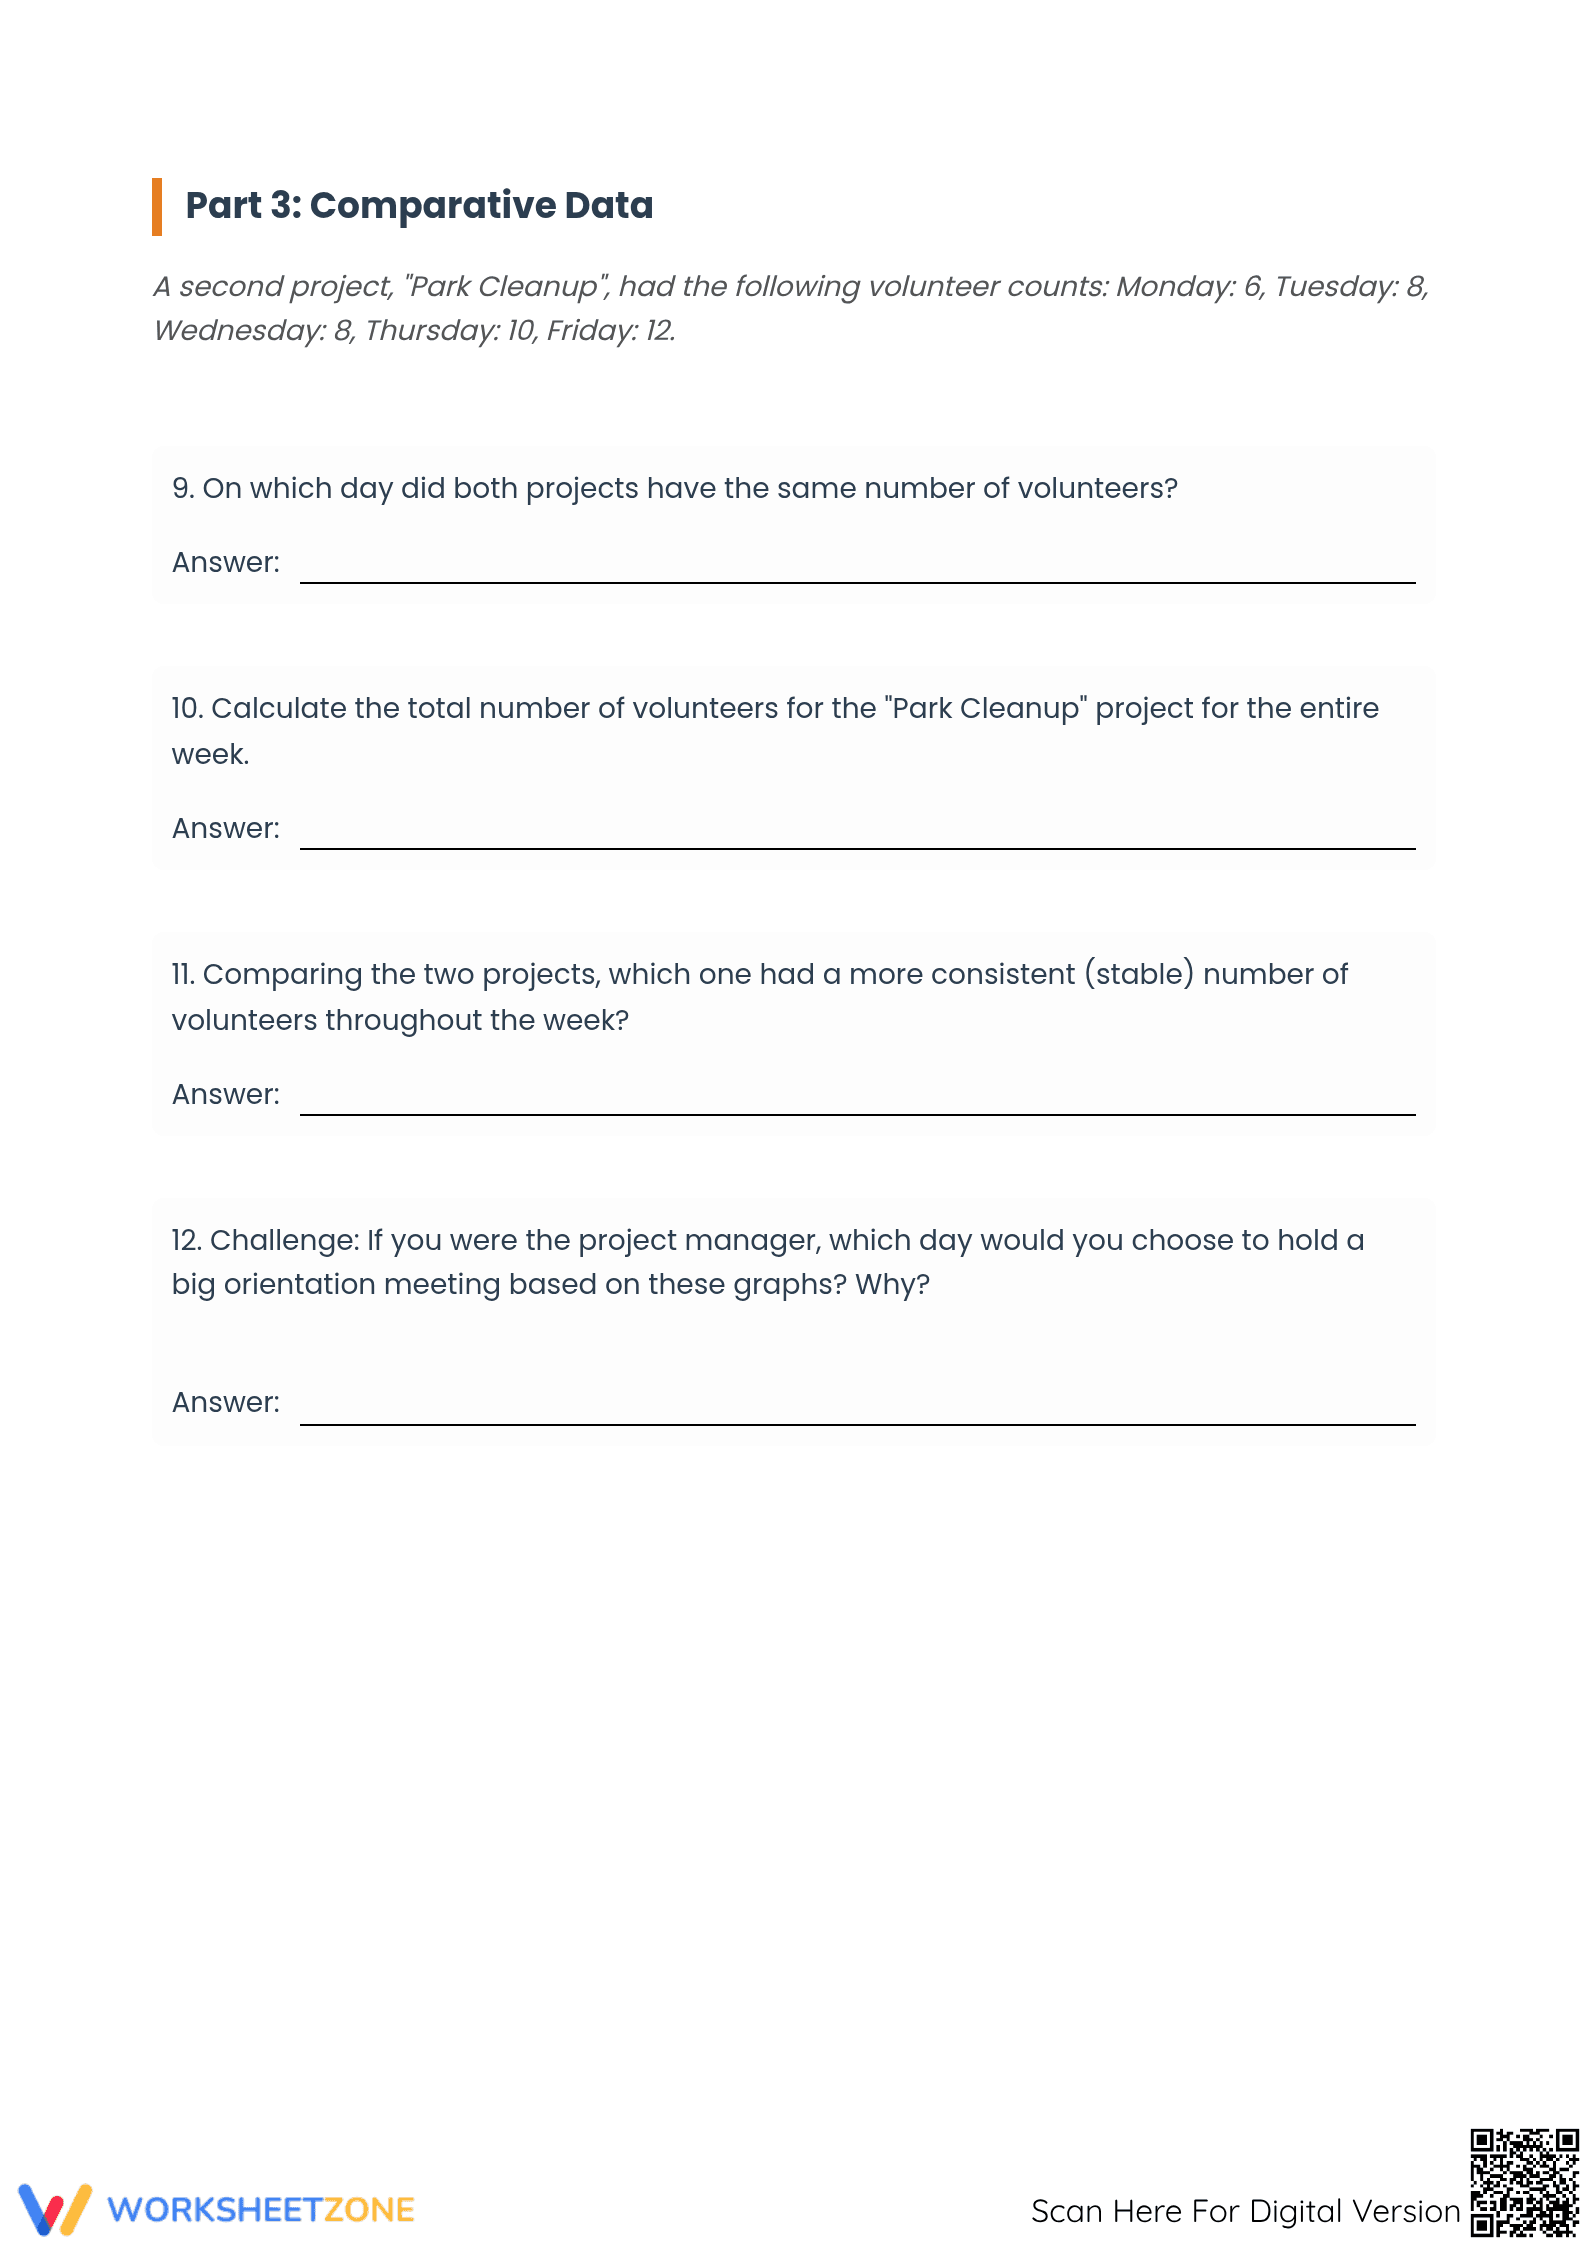
The resource is divided into three logical parts that increase in complexity. Part 1 focuses on direct graph reading and basic arithmetic. Part 2 introduces trend analysis where students identify patterns of increase and decrease. Part 3 provides a second data set for the "Park Cleanup" project, requiring students to compare two graphs and make management-level decisions based on the findings. A complete answer key ensures easy grading.
Zero-Prep Workflow
This resource is designed for immediate classroom integration with a total teacher preparation time of under two minutes. First, print the three-page PDF (30 seconds). Next, distribute the packets to your students for independent or partner work (1 minute). Finally, use the included answer key to review the 12 tasks together or perform a quick grading check (30 minutes of instruction). It is an ideal solution for sub plans.
Standards Alignment
The primary alignment is `CCSS.MATH.CONTENT.5.G.A.2`: "Represent real world and mathematical problems by graphing points in the first quadrant of the coordinate plane, and interpret coordinate values of points in the context of the situation." This worksheet specifically addresses the interpretation aspect, forcing students to move beyond the numbers to the meaning behind the data. This standard code can be copied directly into lesson plans, IEP goals, or district curriculum mapping tools.
How to Use It
Use this as a formative check during your unit on graphing and statistics. After a direct instruction lesson on line graphs, assign Parts 1 and 2 for independent practice. Part 3 works exceptionally well for small group discussions, as the "Challenge" question at the end allows for varied logical justifications. Observe students as they calculate the difference between Thursday and Wednesday to ensure they are using the y-axis scale correctly.
Who It's For
While designed for Grade 5, this resource is suitable for Grade 4 students ready for enrichment or Grade 6 and 7 students needing a refresher on comparative data sets. It pairs naturally with any unit on coordinate planes or statistical analysis. The clear formatting and incremental difficulty make it accessible for students needing scaffolded data literacy support.
Mastering data interpretation through visual representations like line graphs is a critical component of mathematical literacy. According to the RAND AIRS 2024 report, students engaging with multi-step data analysis tasks demonstrate 22% higher retention of statistical concepts. This worksheet aligns with CCSS.MATH.CONTENT.5.G.A.2, requiring students to interpret coordinate values in real-world contexts, progressing from simple point-reading to complex trend analysis and cross-project comparison. This resource provides rigorous, standards-aligned practice that bridges abstract graphing and practical application.