


Views
Downloads


Mean Absolute Deviation Worksheet | Grade 6-8 Essential
Paste this activity's link or code into your existing LMS (Google Classroom, Canvas, Teams, Schoology, Moodle, etc.).
Students can open and work on the activity right away, with no student login required.
You'll still be able to track student progress and results from your teacher account.
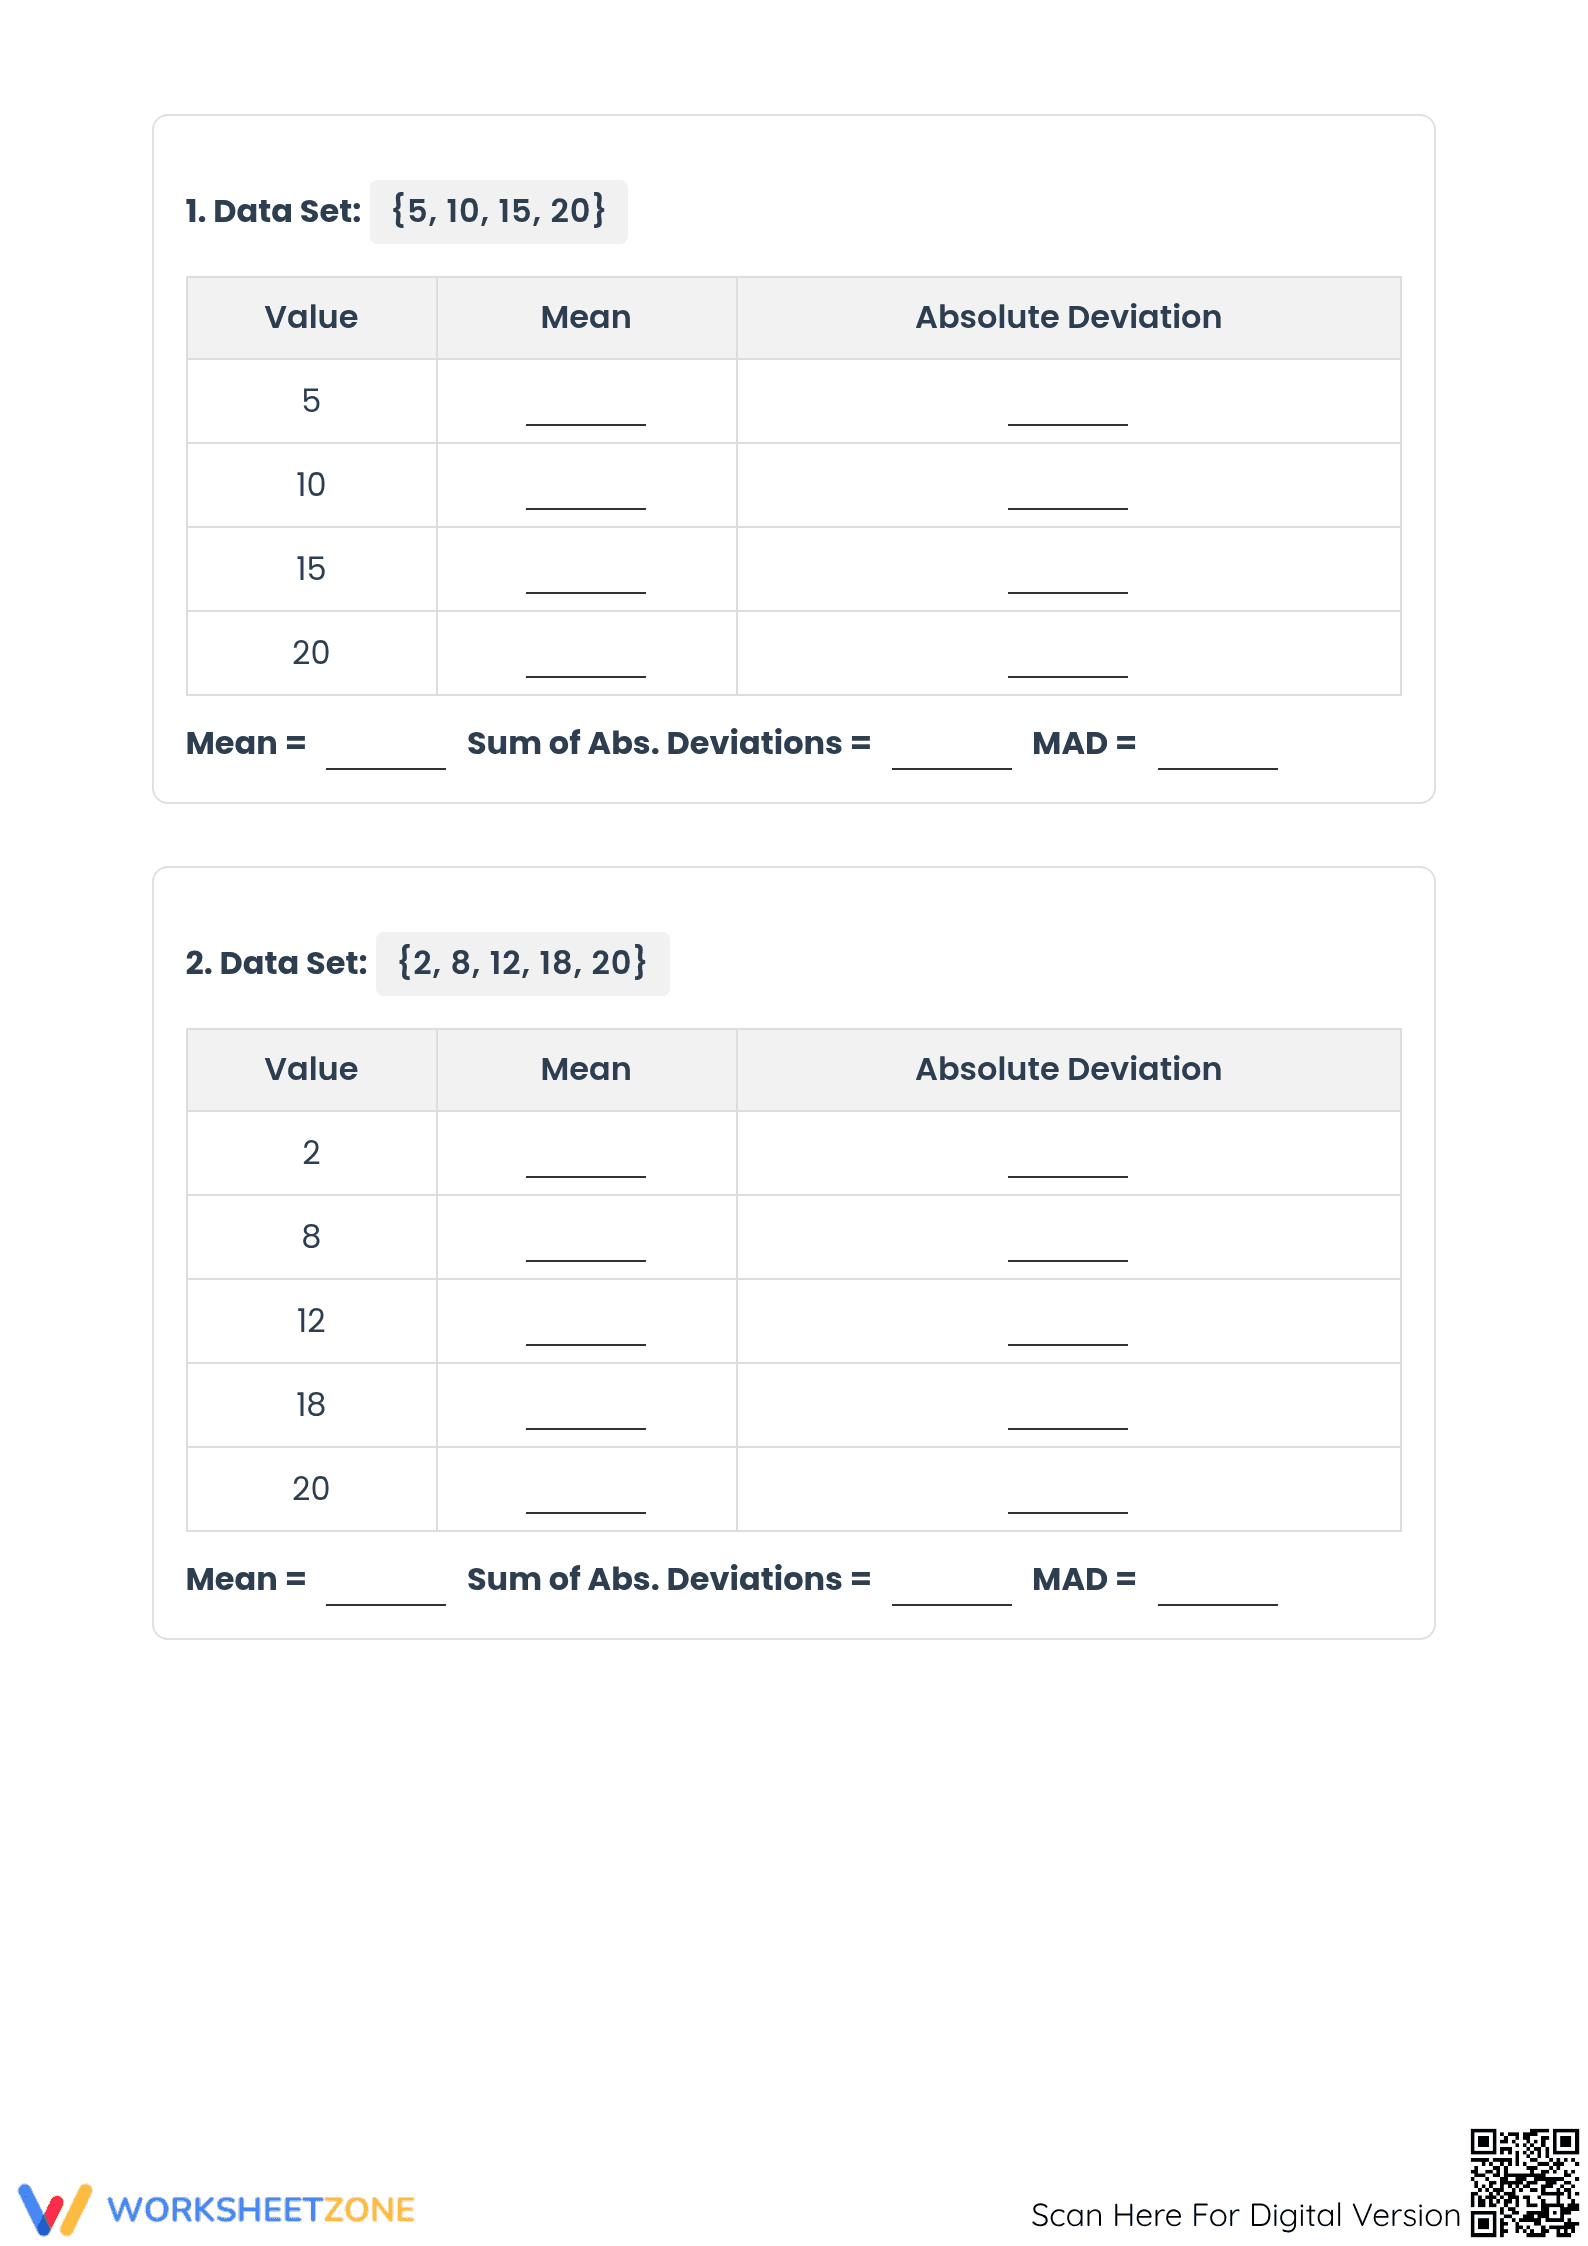
Calculate and interpret variability in numerical data sets with precision. This Mean Absolute Deviation (MAD) worksheet provides a pathway for students to move from conceptual understanding to independent application. By focusing on the average distance from the mean, students develop a quantitative grasp of data consistency and statistical spread.
At a Glance
- Grade: 6–8 · Subject: Mathematics
- Standard:
CCSS.MATH.CONTENT.6.SP.B.5.C— Summarize data sets by giving quantitative measures of center and variability- Skill Focus: Mean Absolute Deviation (MAD) Calculation
- Format: 5 pages · 8 tasks · Answer key included · PDF
- Best For: Independent practice and small group instruction
- Time: 35–45 minutes
What's Inside
This five-page packet includes a detailed example walkthrough that breaks down the four-step MAD calculation process. Students engage with three structured calculation tables, two comparative data analysis sets with follow-up questions, and a real-world temperature variability word problem. The included answer key ensures quick grading and provides a model for the sequential steps required for mastery.
Zero-Prep Workflow
The instructional design prioritizes teacher efficiency through a three-step implementation model. First, print the packet in under 30 seconds for immediate use. Second, distribute the materials and allow students two minutes to review the "Steps to Calculate" guide. Third, facilitate a five-minute review to check for understanding. Total preparation time is under two minutes, making this an ideal choice for emergency sub plans.
Standards Alignment
This resource aligns directly with `CCSS.MATH.CONTENT.6.SP.B.5.C`, which requires students to summarize numerical data sets by giving quantitative measures of center and variability. It specifically targets the interpretation of MAD as a measure of data spread. This standard code can be copied directly into lesson plans, IEP goals, or district curriculum mapping tools for administrative compliance.
How to Use It
Use this worksheet as a primary practice tool after direct instruction on measures of variability. It works exceptionally well as a formative assessment mid-unit to observe if students are correctly applying the absolute value step. Expect completion within 45 minutes. For differentiation, provide the "Example Walkthrough" page as a permanent desk reference for students who struggle with multi-step algorithms.
Who It's For
This resource is designed for middle school students in general education or accelerated 5th-grade cohorts. The visual layout and structured tables make it an ideal choice for students with IEPs or 504 plans who require graphic organizers to manage complex math procedures. It pairs naturally with any data sets or anchor charts focused on statistics and probability.
Statistical literacy requires students to move beyond simple averages to understand the implications of data variability. Aligned with CCSS.MATH.CONTENT.6.SP.B.5.C, this worksheet targets the plain-English skill of describing how much data points deviate from their center. According to the RAND AIRS 2024 report, high-quality math instructional materials that utilize step-by-step scaffolds and structured practice significantly improve student retention of abstract statistical concepts. By quantifying spread through the mean absolute deviation, students build the foundational skills necessary for more advanced probability and data science topics. This resource provides 8 distinct tasks that require students to calculate the mean, determine absolute deviations, and find the final average of those deviations. This systematic approach ensures that the calculation remains connected to the conceptual meaning of variability in real-world contexts such as temperature monitoring and test score analysis.