


Views
Downloads
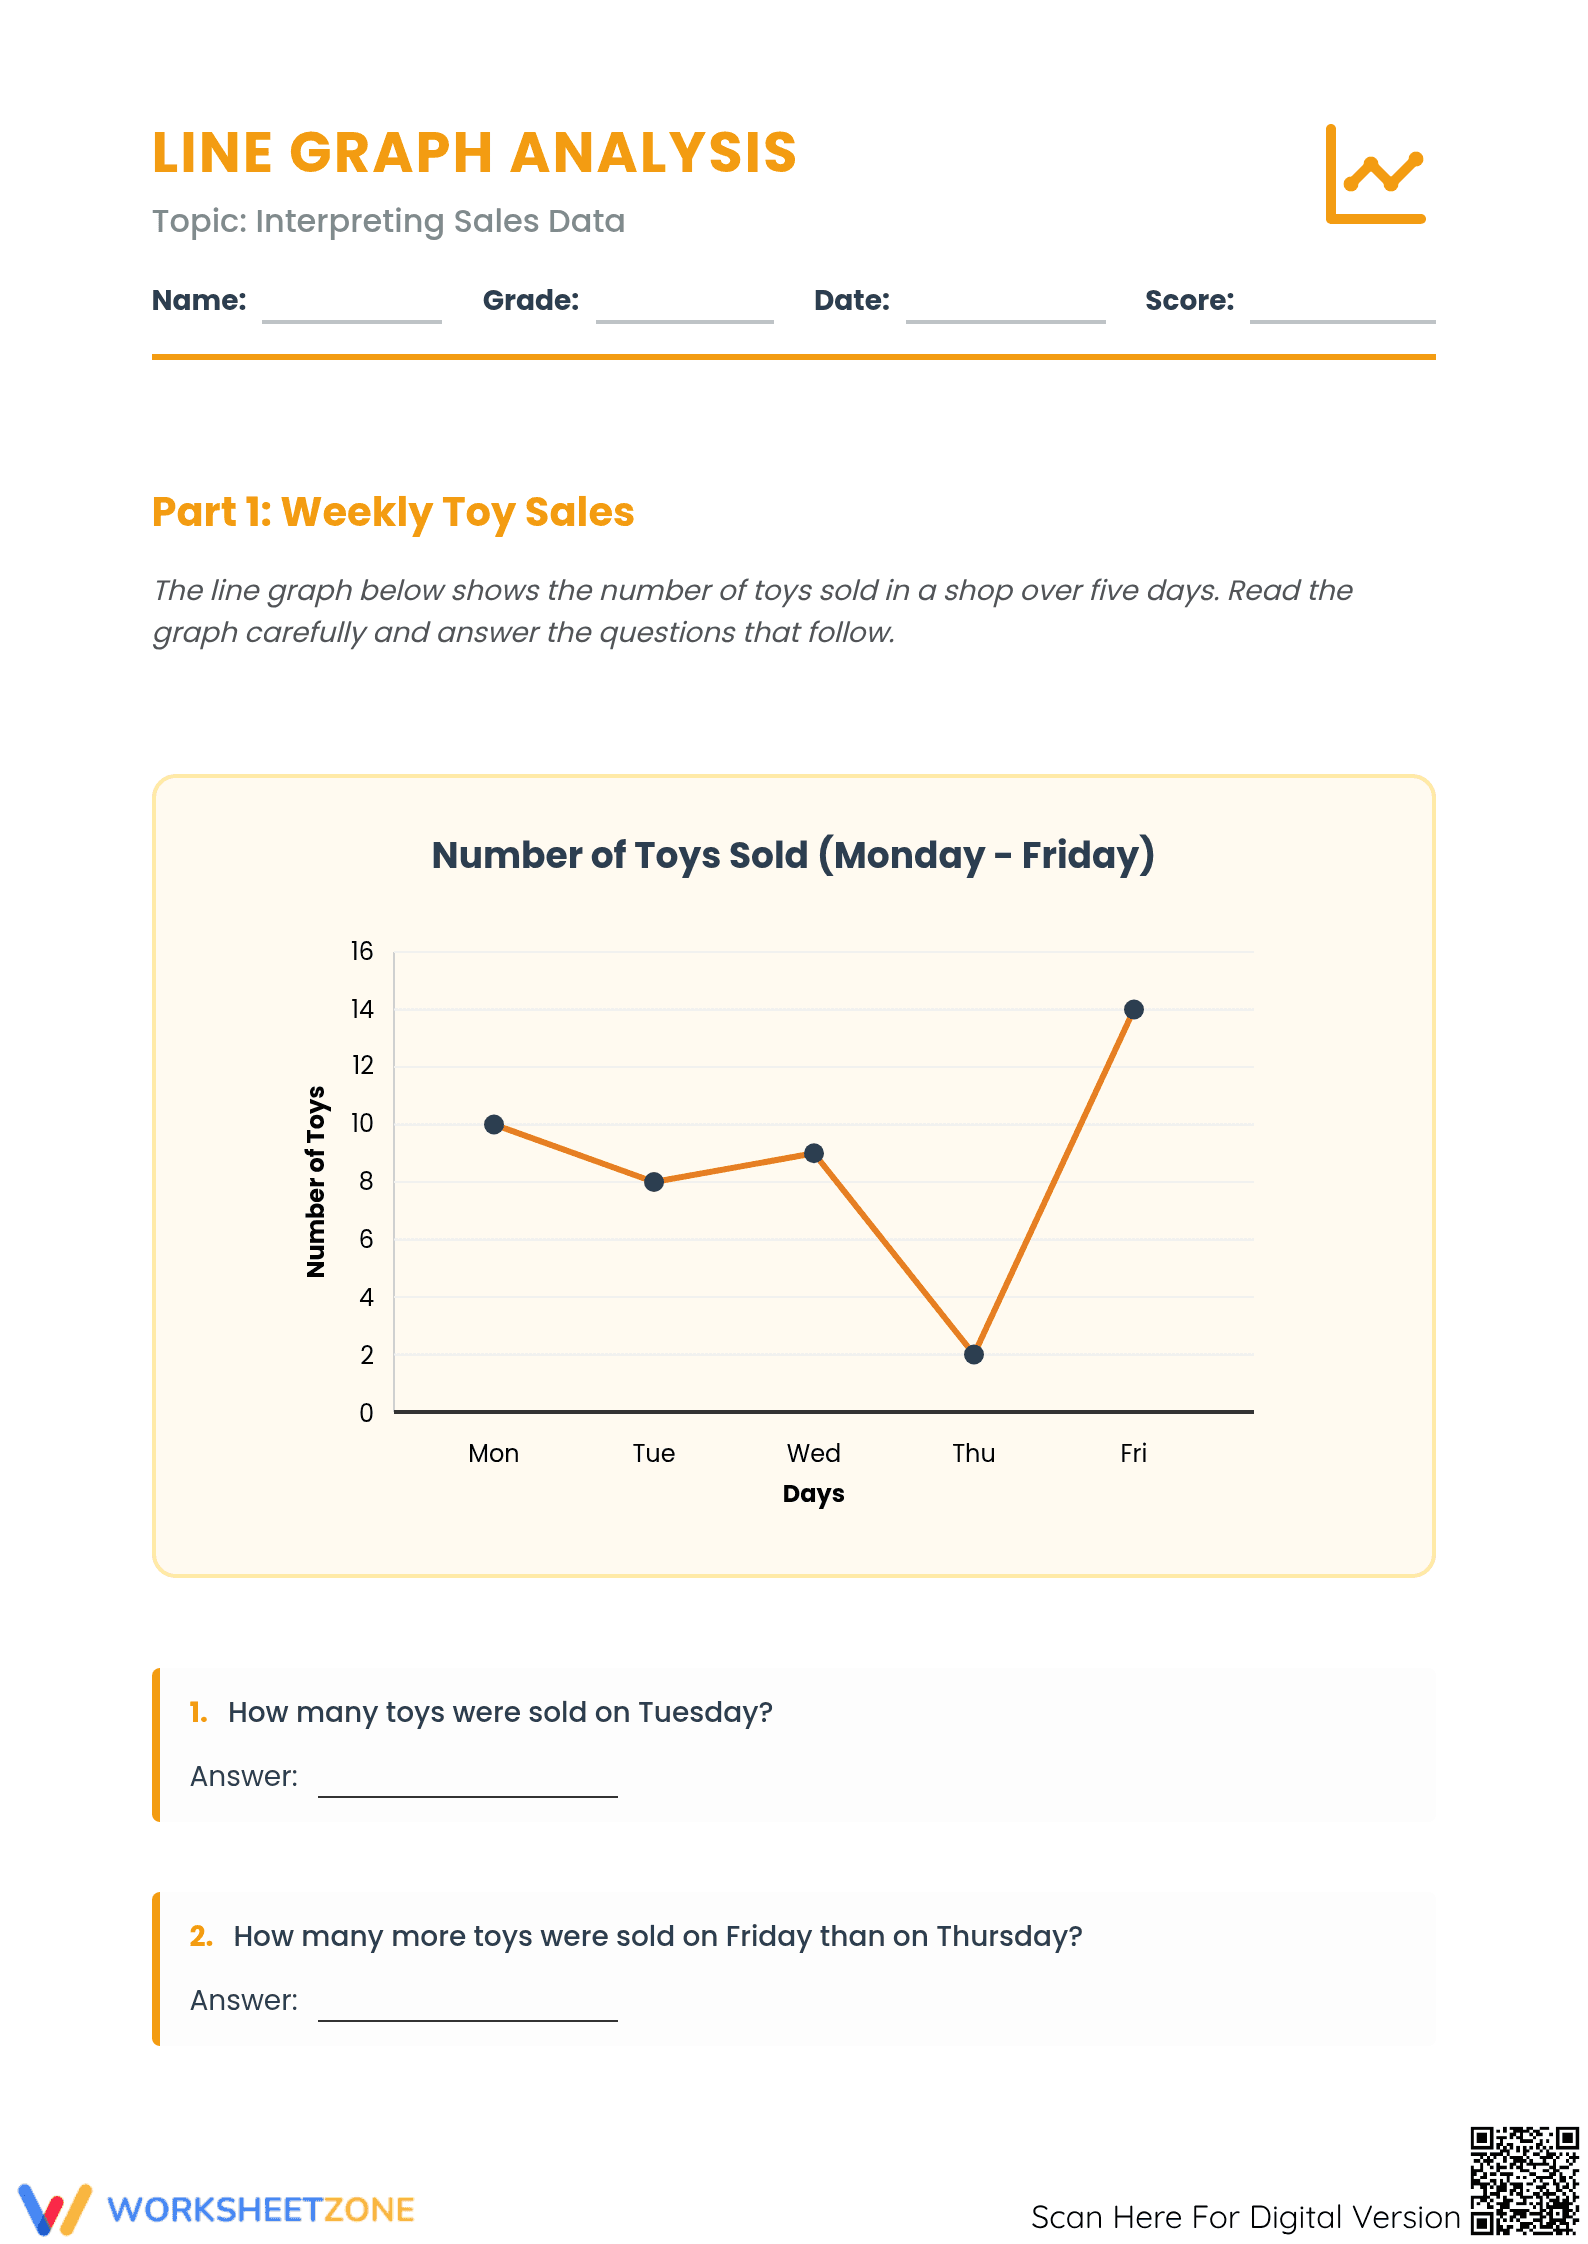


Essential Line Graph Analysis: Toy Sales Data — Grade 5
Paste this activity's link or code into your existing LMS (Google Classroom, Canvas, Teams, Schoology, Moodle, etc.).
Students can open and work on the activity right away, with no student login required.
You'll still be able to track student progress and results from your teacher account.
This comprehensive line graph analysis worksheet provides Grade 5 students with targeted practice in interpreting real-world data sets. By analyzing the 'Toys Sold' sales data, learners move beyond simple observation to perform multi-step calculations including sums, differences, and averages. Students will successfully demonstrate their ability to translate visual trends into actionable mathematical conclusions.
At a Glance
- Grade: 5 · Subject: Math
- Standard:
CCSS.MATH.CONTENT.5.MD.B.2— Use operations on fractions and whole numbers to solve problems from data.- Skill Focus: Line Graph Interpretation & Trend Analysis
- Format: 3 pages · 10 problems · Answer key included · PDF
- Best For: Independent practice or formative data assessment
- Time: 25–35 minutes
The packet is organized into three distinct parts that increase in cognitive demand. It contains a primary line graph covering weekday sales and a secondary graph for weekend bonus data. Students encounter ten specific tasks including single-point data retrieval, cumulative addition, and comparative subtraction. The resource includes a full answer key, ensuring that teacher grading or student self-correction is efficient and accurate.
Engineered for immediate classroom use, this resource requires less than two minutes of teacher prep. Simply print the three-page packet, distribute it for independent practice, and use the comprehensive answer key for quick review or self-correction. Its self-contained design makes it ideal for emergency sub plans or low-stress formative assessments.
The worksheet is strictly aligned to `CCSS.MATH.CONTENT.5.MD.B.2`, requiring students to make sense of data and use operations to solve problems. It also supports `6.SP.B.5` by asking students to summarize numerical data sets in relation to their context. Both standard codes can be copied directly into lesson plans, IEP goals, or district curriculum mapping tools.
Maximize instructional impact by using this worksheet for 'Station Rotation' or formative assessment. Observe students analyzing trends in Part 2, and note that most will complete the 10-question sequence within 30 minutes.
This resource is designed for upper elementary and middle school students in Grades 5 through 7 who are mastering coordinate planes and data visualization. It is particularly effective for learners who require concrete, relatable contexts—like toy store sales—to grasp abstract statistical concepts. Pair this with a blank graph template to have students extend the weekend data into a full seven-day visualization.
Aligned with CCSS.MATH.CONTENT.5.MD.B.2, this worksheet fosters students' ability to represent and interpret data using line graphs to solve problems involving operations. Through ten structured tasks, learners progress from data retrieval to complex trend analysis and average calculation. Real-world contexts, like the 'Toys Sold' scenario, enhance engagement and retention, aligning with evidence-based instructional practices for upper elementary and middle school mathematics.