


1 / 3
0
Views
0
Downloads


0.0
0
Save
0 Likes
Proportionality: To Be or Not to Be Worksheet
0 Views
0 Downloads
Paste this activity's link or code into your existing LMS (Google Classroom, Canvas, Teams, Schoology, Moodle, etc.).
Students can open and work on the activity right away, with no student login required.
You'll still be able to track student progress and results from your teacher account.
Information
Description
What It Is:
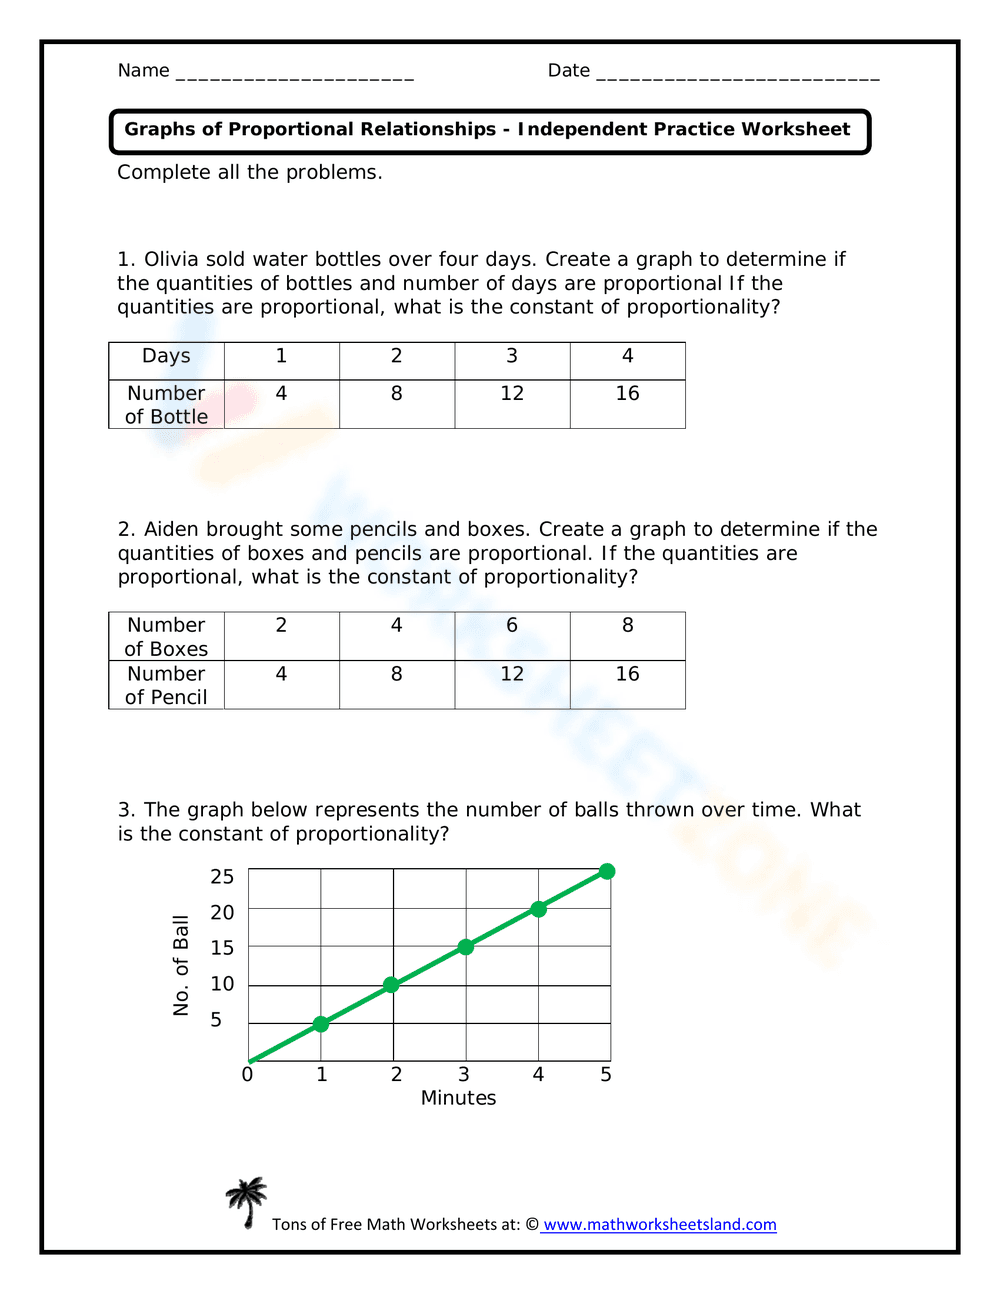
This is an independent practice worksheet focused on graphs of proportional relationships. It contains three problems. The first two problems present data in tables, requiring students to determine if the quantities are proportional and, if so, find the constant of proportionality. The third problem provides a graph of the number of balls thrown over time and asks students to find the constant of proportionality.
Grade Level Suitability:
This worksheet is suitable for 7th and 8th grade students. It aligns with the mathematical concepts of proportional relationships, graphing, and finding constants of proportionality, which are typically taught in these grades.
Why Use It:
This worksheet reinforces the understanding of proportional relationships and the ability to identify the constant of proportionality from tables and graphs. It helps students develop problem-solving skills and apply mathematical concepts to real-world scenarios.
How to Use It:
Students should read each problem carefully and determine if the quantities presented are proportional. For problems 1 and 2, they may need to create a graph to visualize the data. They should then calculate the constant of proportionality. For problem 3, they can analyze the provided graph to determine the constant of proportionality.
Target Users:
The target users are middle school students, specifically those in 7th and 8th grade, who are learning about proportional relationships and linear functions. It is also useful for students who need extra practice in interpreting graphs and tables.