


























Views
Downloads


Printable Making Histograms Worksheet | Grade 9-11 Math
Paste this activity's link or code into your existing LMS (Google Classroom, Canvas, Teams, Schoology, Moodle, etc.).
Students can open and work on the activity right away, with no student login required.
You'll still be able to track student progress and results from your teacher account.
This comprehensive Grade 9-11 math worksheet provides essential practice in creating and analyzing histograms. Students will transform raw numerical data into organized frequency tables and visual representations to identify patterns in distribution. By working through multiple real-world scenarios, learners master the critical skill of representing data on a real number line while developing statistical literacy.
At a Glance
- Grade: 9-11 · Subject: High School Math
- Standard:
HSS-ID.A.1— Represent data with plots on the real number line including histograms- Skill Focus: Creating histograms and frequency tables
- Format: 3 pages · 5 tasks · Answer key included · PDF
- Best For: Secondary statistics units and data analysis
- Time: 45–60 minutes
What's Inside
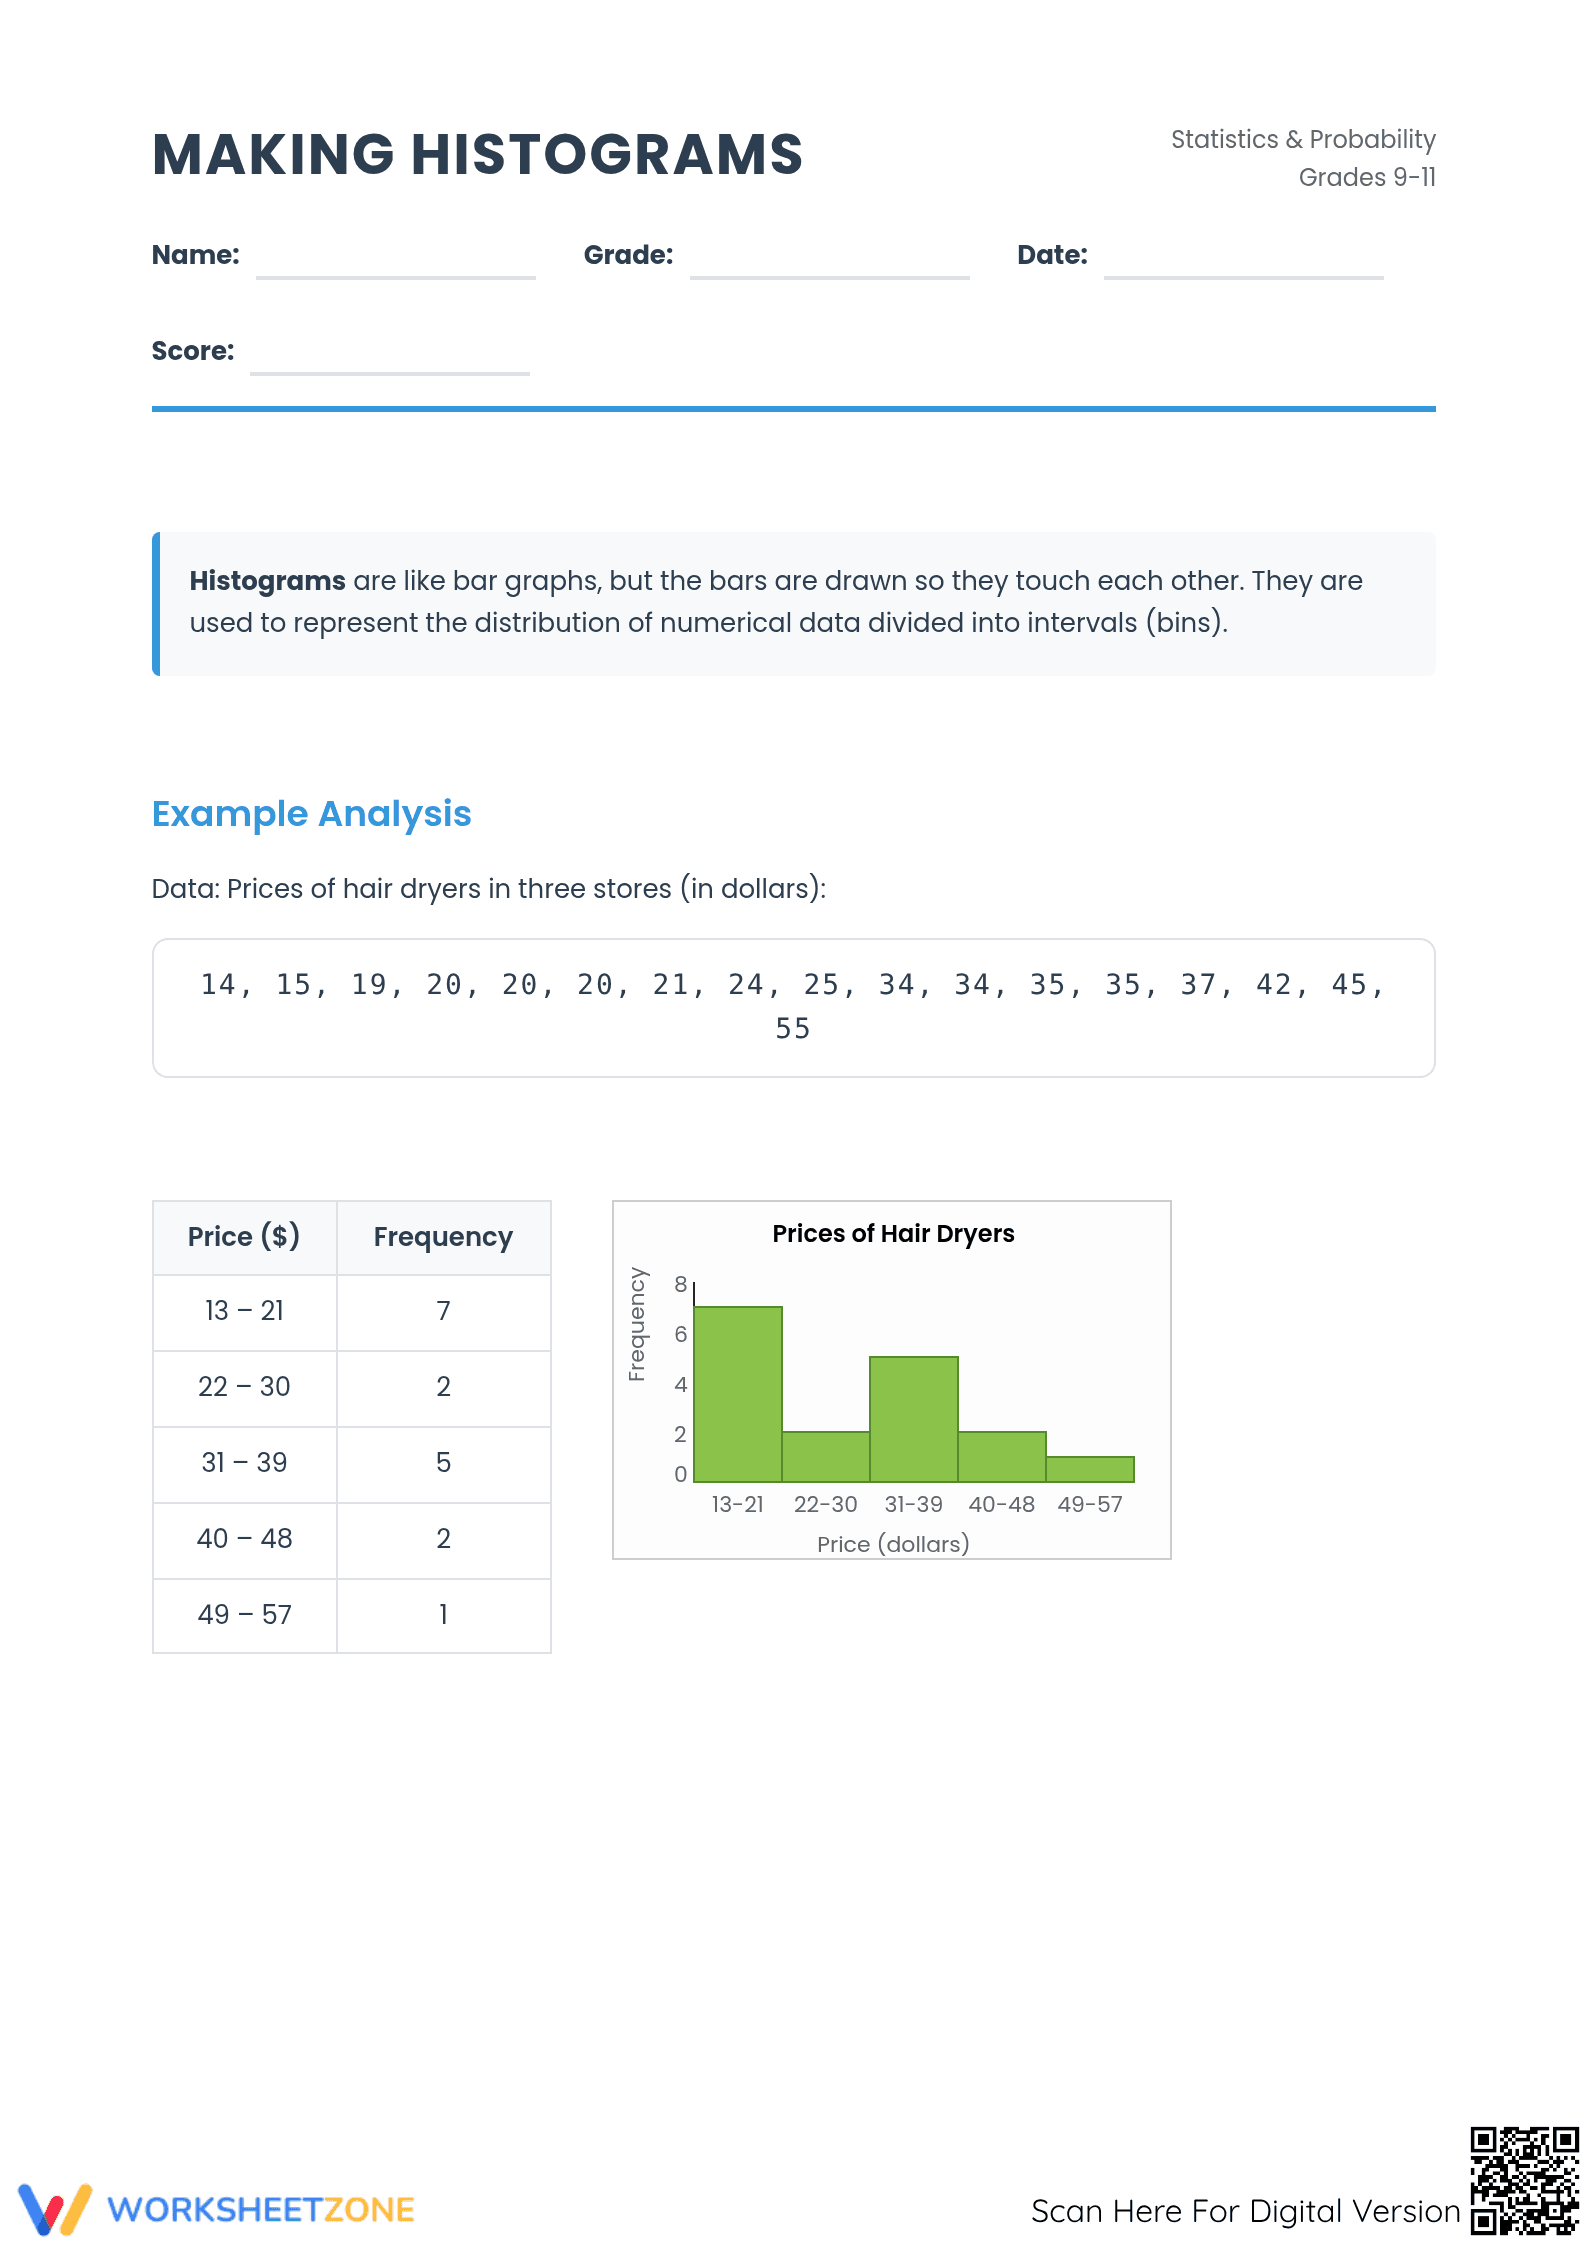
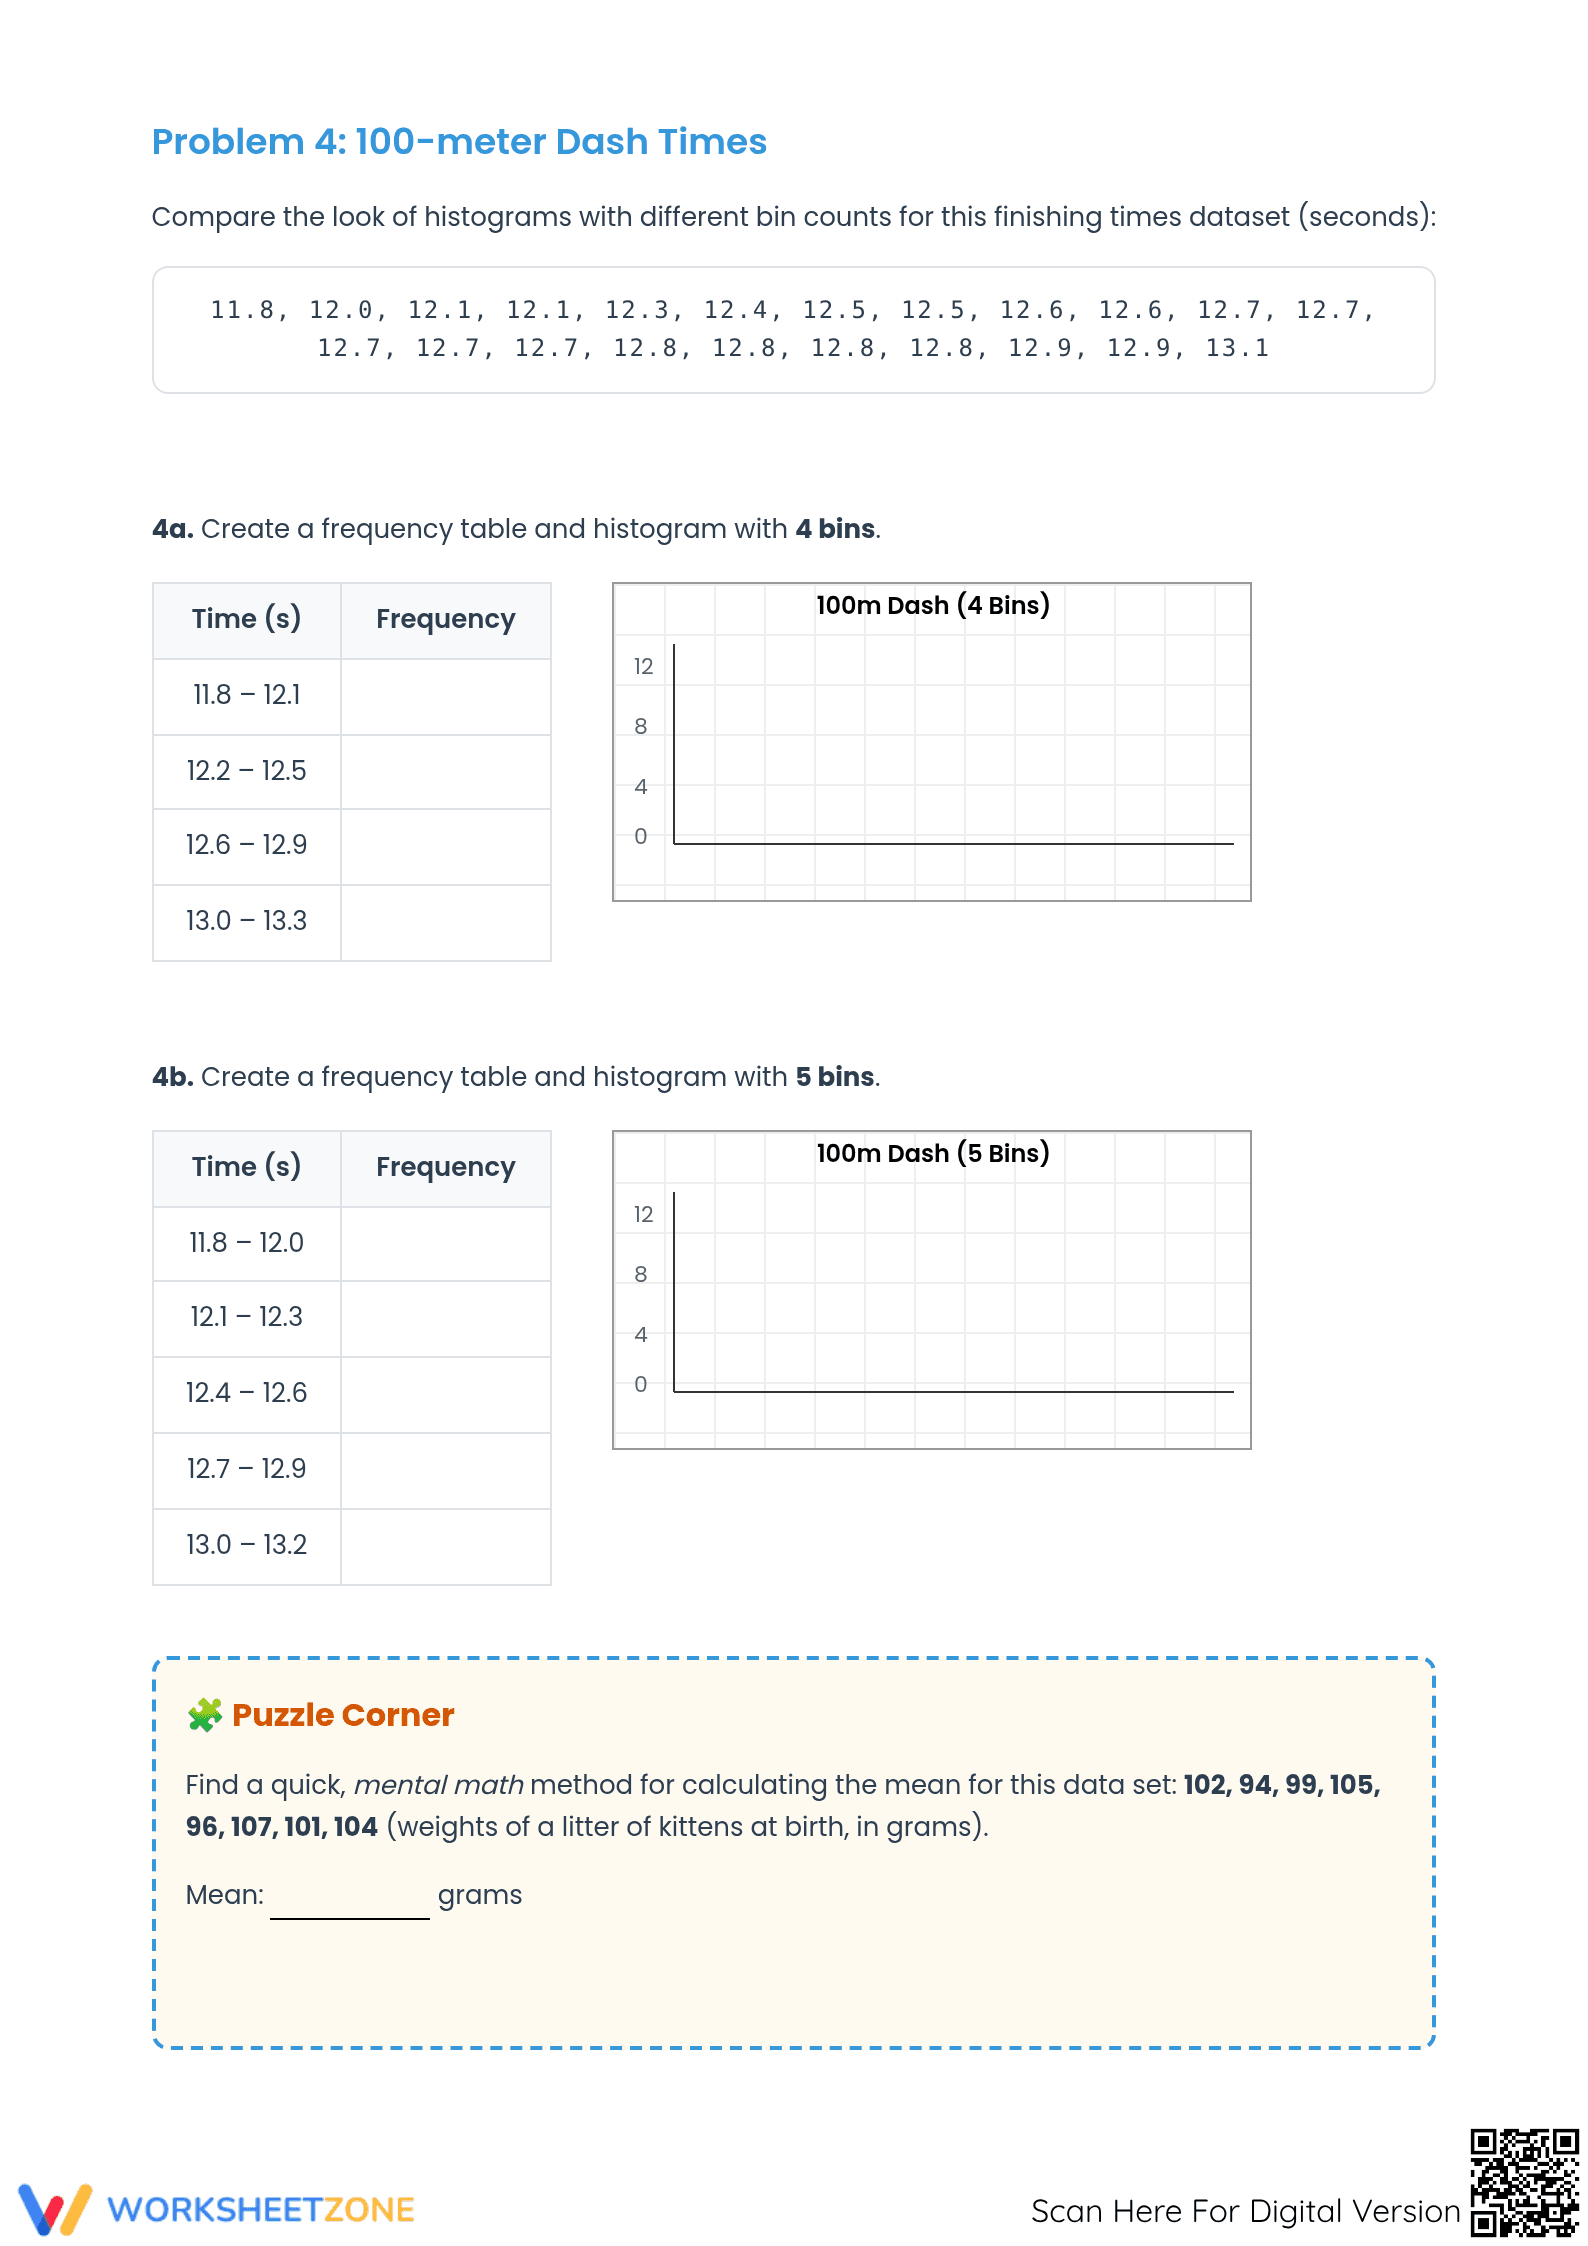
This printable resource consists of three structured pages designed for deep engagement. It includes a clear worked example to establish procedural fluency, followed by four complex data sets involving swimmer heights, basketball scores, and race times. Students are provided with scaffolded frequency tables and labeled grid axes, along with a "Puzzle Corner" for mental math mean calculation and advanced tasks requiring median and interquartile range (IQR) analysis.
Skill Progression
- Guided Practice: An initial example analysis provides a complete model of data intervals (bins) and corresponding frequency counts to build student confidence.
- Supported Practice: Two mid-level problems require students to calculate their own frequencies from raw data and plot them on pre-formatted grids using specific bin counts.
- Independent Practice: The final challenge asks students to compare the visual distribution of the same dataset using different bin counts, promoting higher-order evaluative thinking.
This resource utilizes a gradual-release model to ensure students move from basic plotting to sophisticated comparative data analysis.
Standards Alignment
The primary focus of this worksheet is `HSS-ID.A.1`, which requires students to represent data with plots on the real number line, specifically histograms. It also supports `HSS-ID.A.2` by asking students to use statistics appropriate to the shape of the data distribution to compare center and spread. Both standard codes can be copied directly into lesson plans, IEP goals, or district curriculum mapping tools.
How to Use It
This worksheet is ideal for use during the practice phase of a statistics unit. Assign it after a direct instruction lesson on data distribution to serve as a high-quality formative assessment. Teachers should observe how students handle data that falls on the boundary of two bins, using this as a "teachable moment" to discuss standard interval conventions and ensure precision in mathematical modeling. The included answer key allows for rapid peer-review or self-correction.
Who It's For
Designed for Grade 9 through Grade 11 students, this resource is perfect for Algebra 1 or Statistics courses. It provides necessary scaffolding for struggling learners through pre-drawn axes while offering extension opportunities for advanced students via IQR and median calculations. Pair this worksheet with a probability passage or an anchor chart on data skews for a complete instructional experience in the secondary classroom.
According to research by Fisher & Frey (2014), the use of scaffolded graphic organizers and visual data representations is essential for developing disciplinary literacy in mathematics. This Grade 9-11 worksheet directly addresses the HSS-ID.A.1 standard by providing students with the structured environment needed to master making histograms. By transitioning from raw numerical data to frequency tables and finally to visual plots, students build a mental framework for understanding data distribution and variance. The inclusion of comparative tasks—analyzing the same data through different bin counts—encourages the higher-order thinking skills identified by NAEP as critical for college and career readiness. This resource serves as a robust tool for evidence-based instruction, ensuring that students can not only construct statistical plots but also interpret the underlying narratives within complex datasets for academic success in secondary mathematics and beyond.


