


0
Views
0
Downloads
0.0
0
Save
0 Likes
Solving and Graphing Inequalities Worksheet
0 Views
0 Downloads
Paste this activity's link or code into your existing LMS (Google Classroom, Canvas, Teams, Schoology, Moodle, etc.).
Students can open and work on the activity right away, with no student login required.
You'll still be able to track student progress and results from your teacher account.
Information
Description
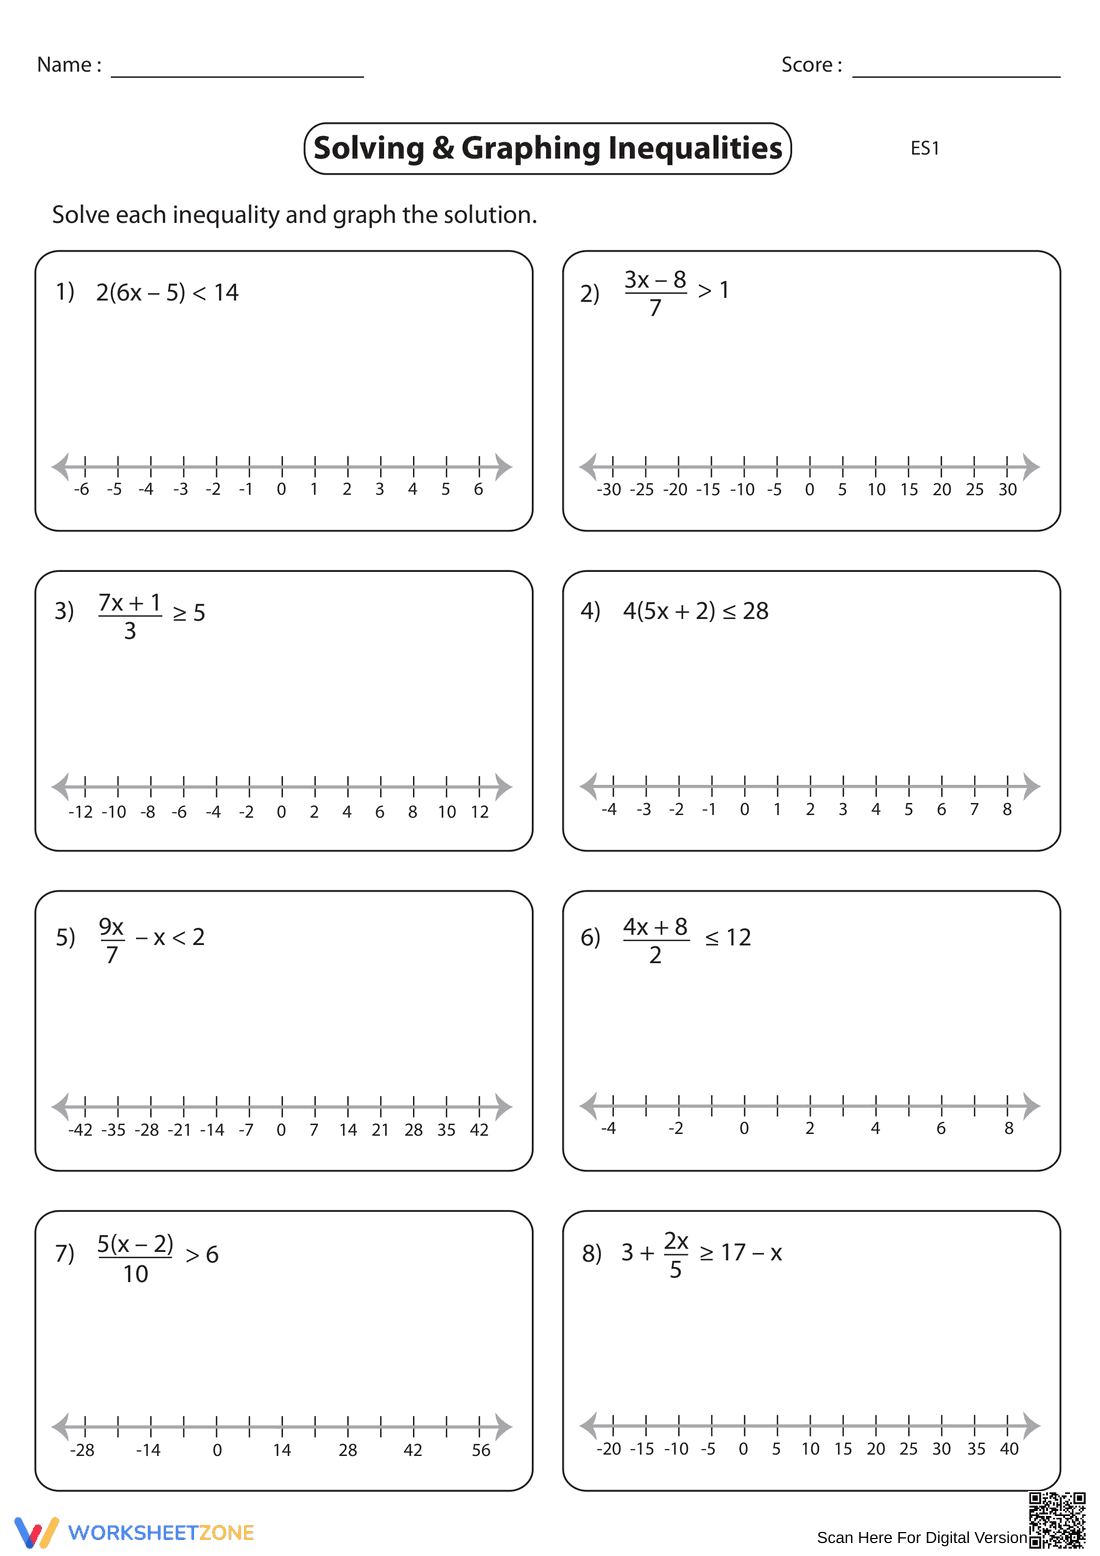
What It Is:
This is a math worksheet titled 'Solving & Graphing Inequalities.' It contains eight problems where students must solve linear inequalities involving expressions with variables (x) and then graph the solution set on a provided number line. The inequalities involve operations like multiplication, division, addition, and subtraction, and some include fractions.
Grade Level Suitability:
This worksheet is suitable for grades 7-9. It requires students to have a solid understanding of solving multi-step equations and inequalities, as well as representing solutions graphically. The presence of fractions and distribution indicates a more advanced level.
Why Use It:
This worksheet reinforces the skills of solving linear inequalities and representing the solution set graphically. It helps students develop a deeper understanding of inequality concepts and their visual representation. It provides practice in applying algebraic manipulation to solve for variables and interpret the solution in the context of a number line.
How to Use It:
Students should first solve each inequality algebraically, showing their steps. Then, they should represent the solution set on the corresponding number line by drawing an open or closed circle at the boundary point and shading the appropriate region to indicate all values that satisfy the inequality.
Target Users:
This worksheet is designed for students who are learning about solving and graphing linear inequalities in algebra. It's beneficial for students who need extra practice with these concepts or for teachers looking for supplementary material to reinforce classroom instruction.