


Views
Downloads
Shoe Sizes Line Plot Worksheet | Grade 4 Printable Math
Paste this activity's link or code into your existing LMS (Google Classroom, Canvas, Teams, Schoology, Moodle, etc.).
Students can open and work on the activity right away, with no student login required.
You'll still be able to track student progress and results from your teacher account.
This Shoe Sizes Line Plot worksheet provides a comprehensive framework for students to master data representation and analysis. By working through real-world scenarios, learners develop the ability to interpret existing line plots and construct their own from raw data tables. This resource ensures students can confidently handle fractional measurements, a critical middle-elementary mathematics requirement.
At a Glance
- Grade: 4 · Subject: Math
- Standard:
4.MD.B.4— Make line plots with fractions and solve related problems.- Skill Focus: Line plot interpretation and construction
- Format: 3 pages · 10 problems · Answer key included · PDF
- Best For: Data unit practice or formative assessment
- Time: 25–35 minutes
What's Inside
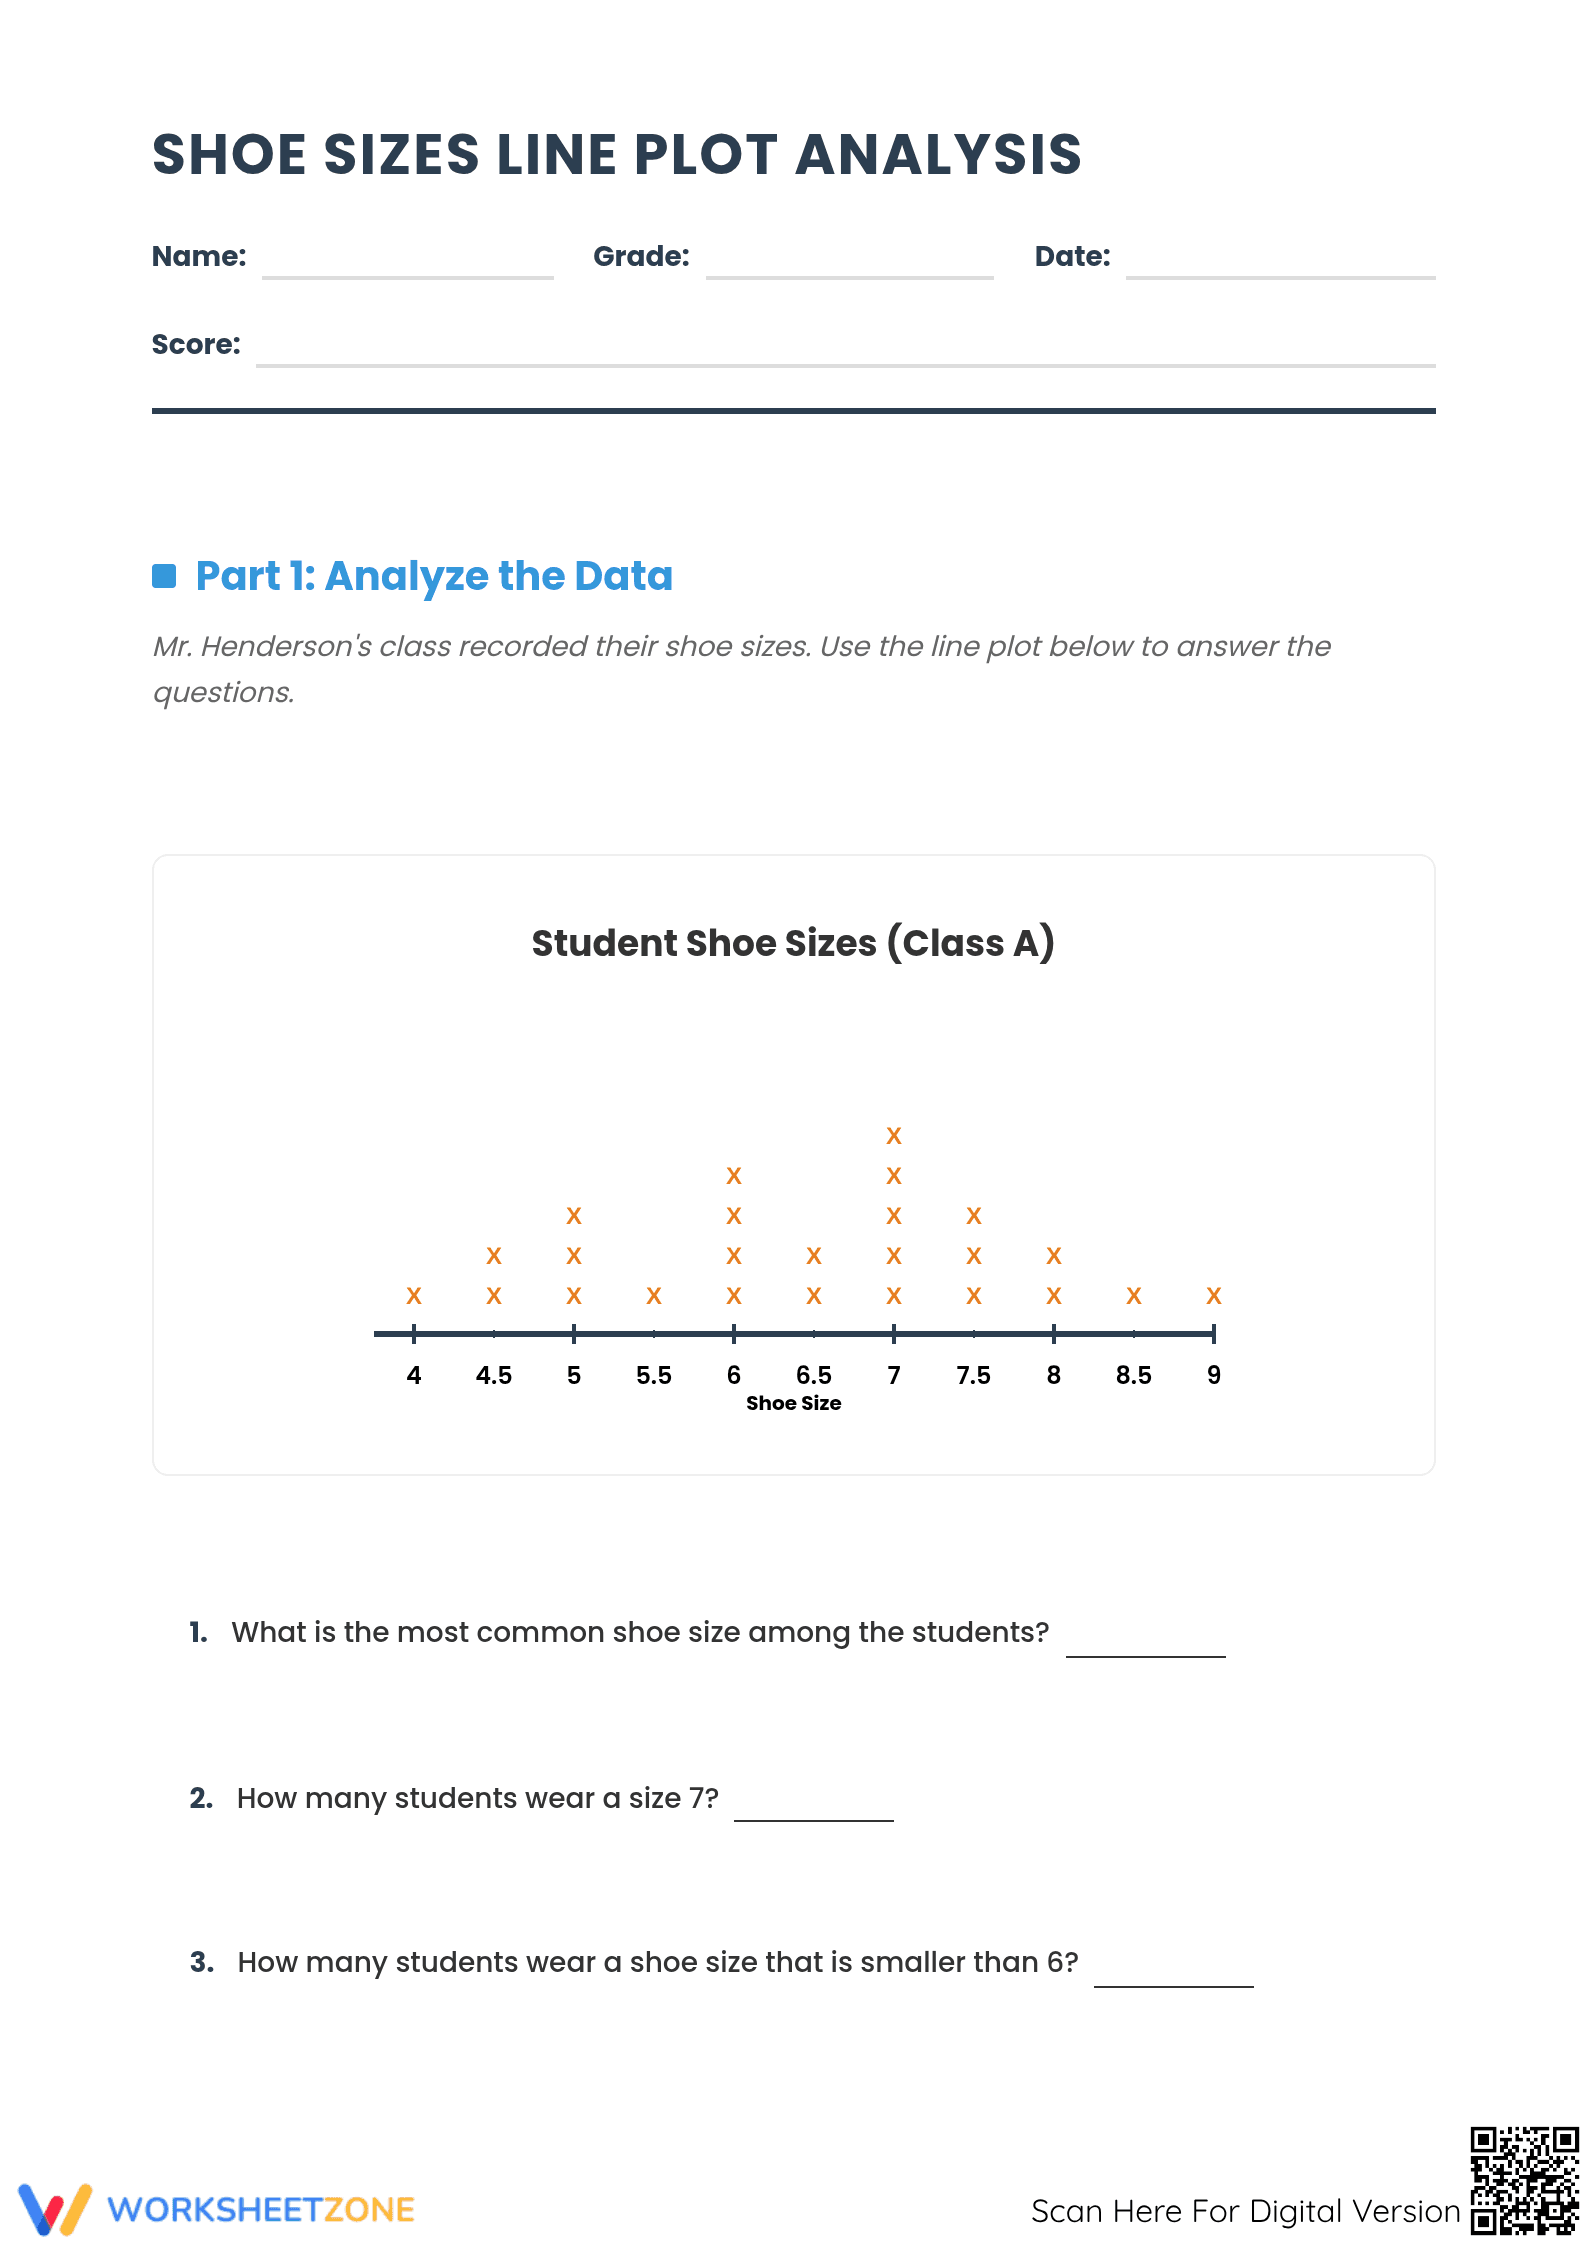
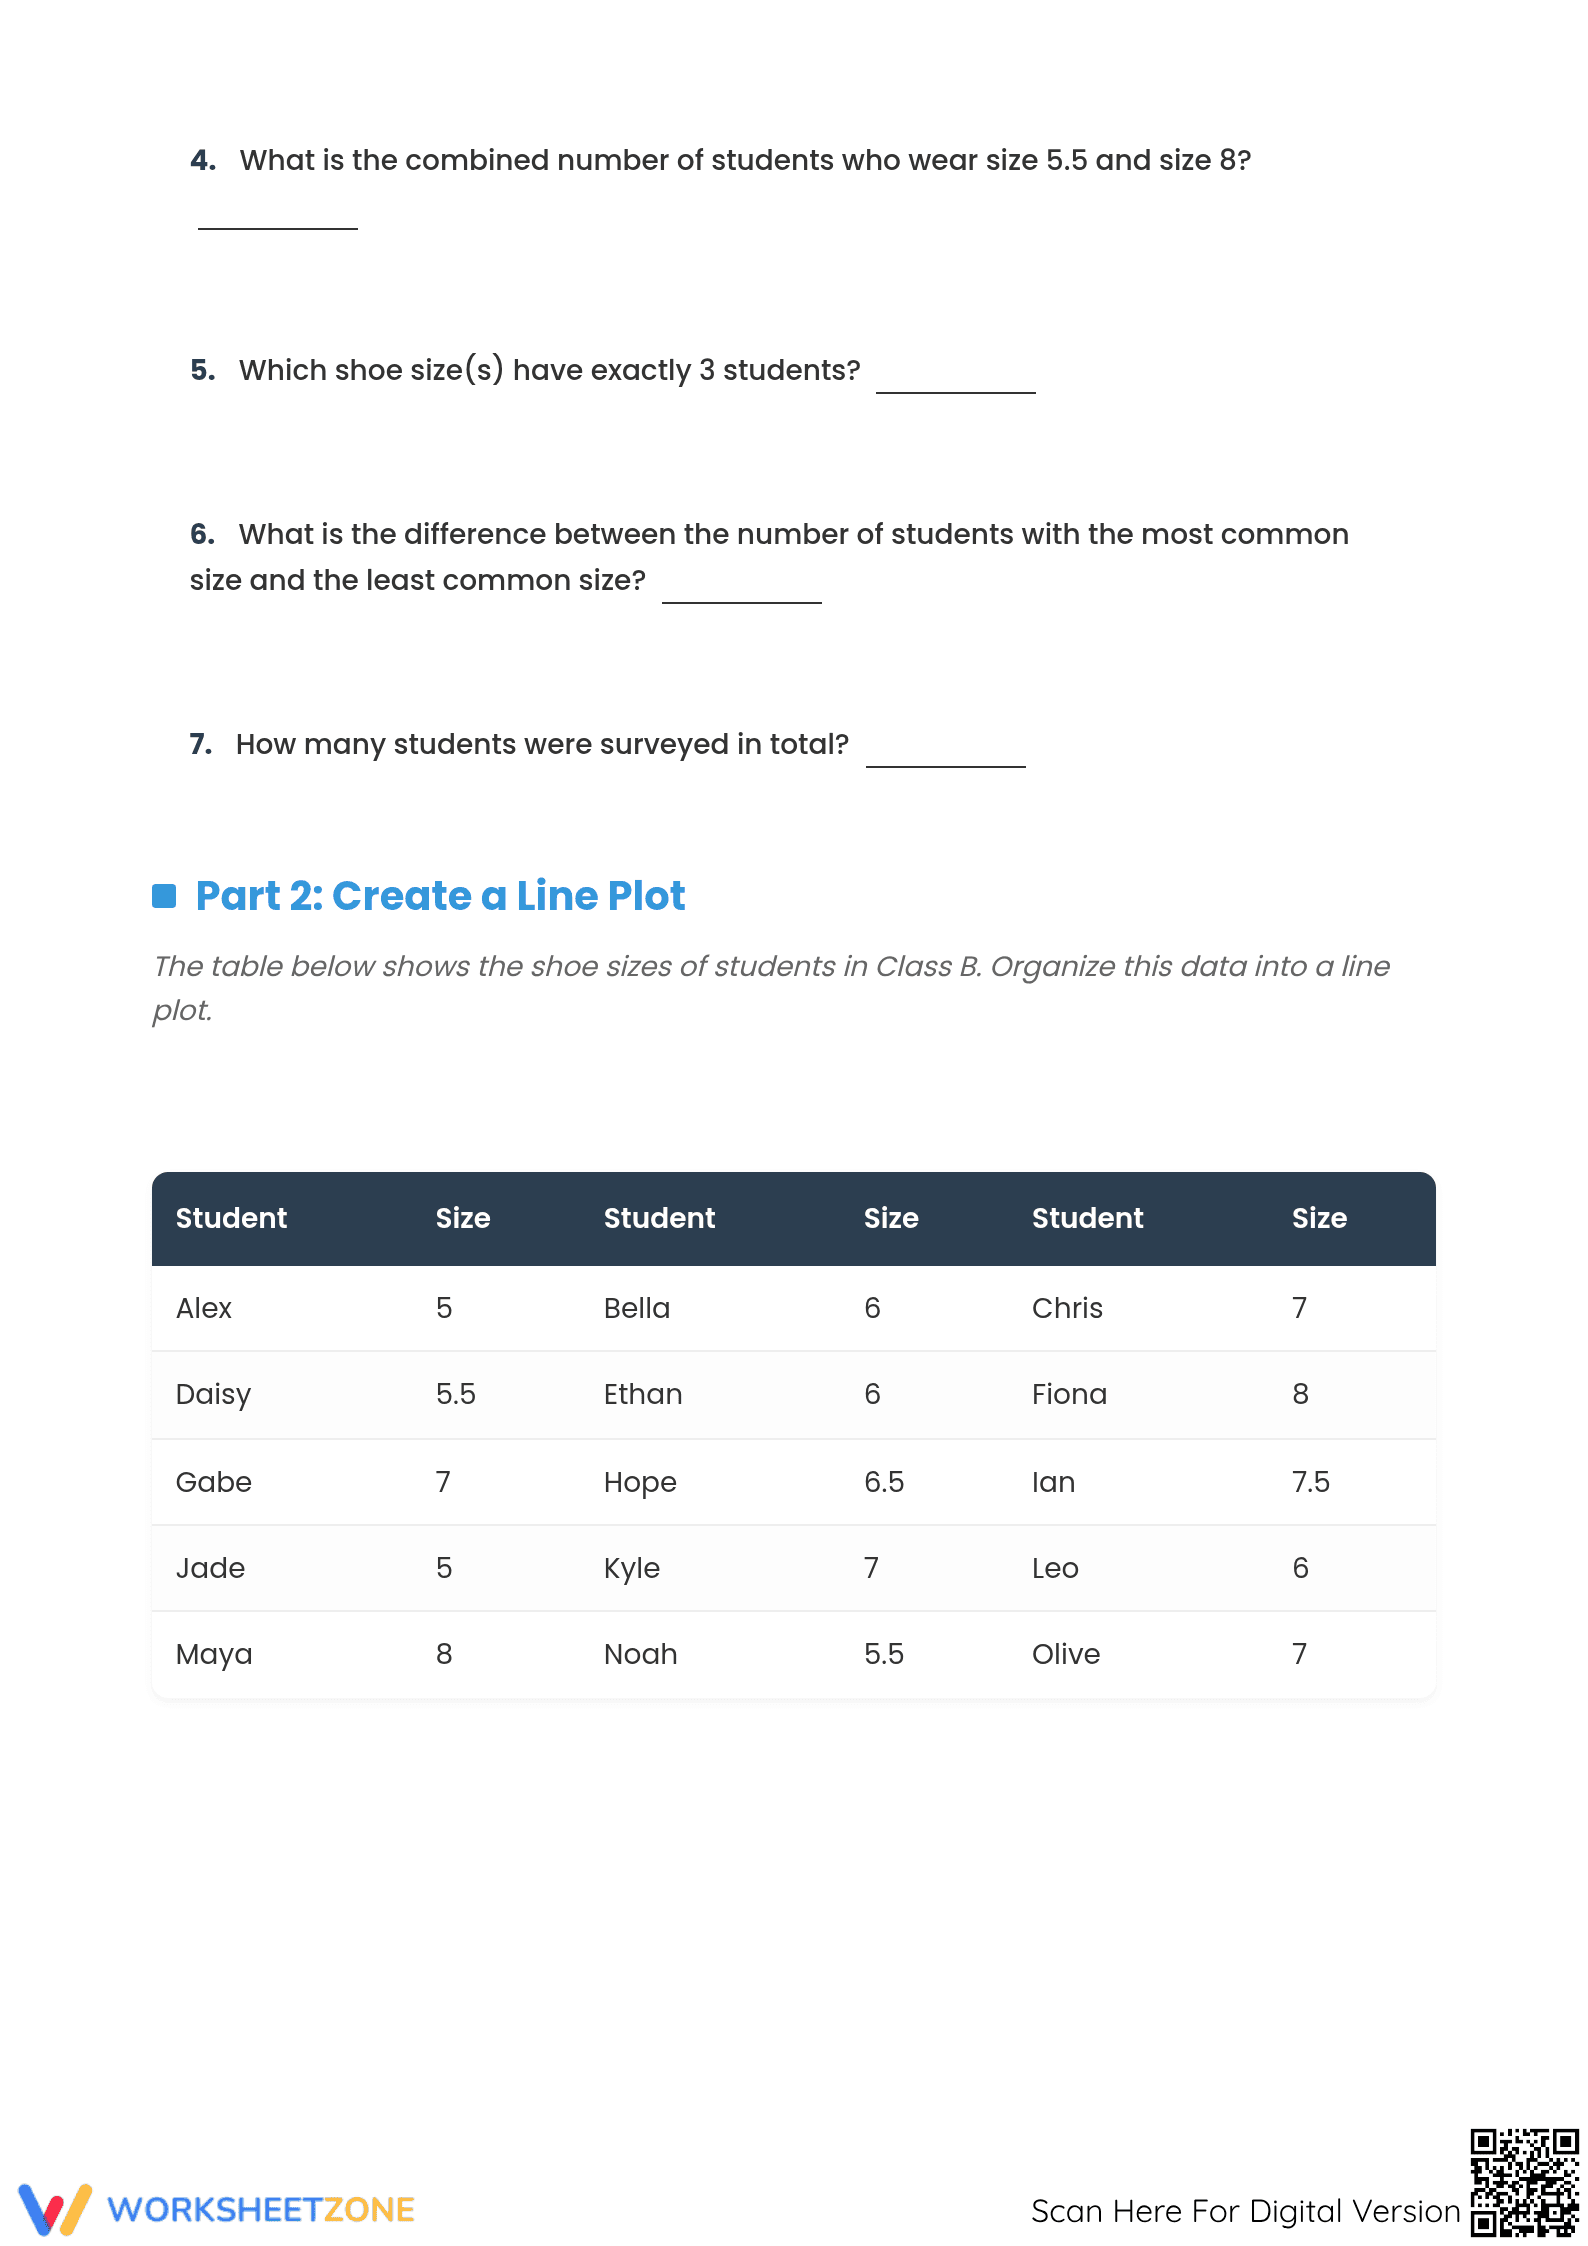
This 3-page instructional packet is divided into two distinct logical segments. Part one features a pre-populated line plot showing Class A's shoe sizes, accompanied by seven analysis questions that require finding frequencies, modes, and performing comparisons. Part two provides a data table for Class B, challenging students to accurately plot 15 data points onto a blank axis and conclude with higher-order comparison questions. A complete answer key is included for rapid grading.
Skill Progression
- Guided analysis: Students begin by identifying specific data points on the Class A plot, answering frequency questions for 7 items to build confidence with the visual format.
- Interpreting relationships: Learners progress to multi-step problems that involve comparing frequencies and calculating differences between the most and least common categories.
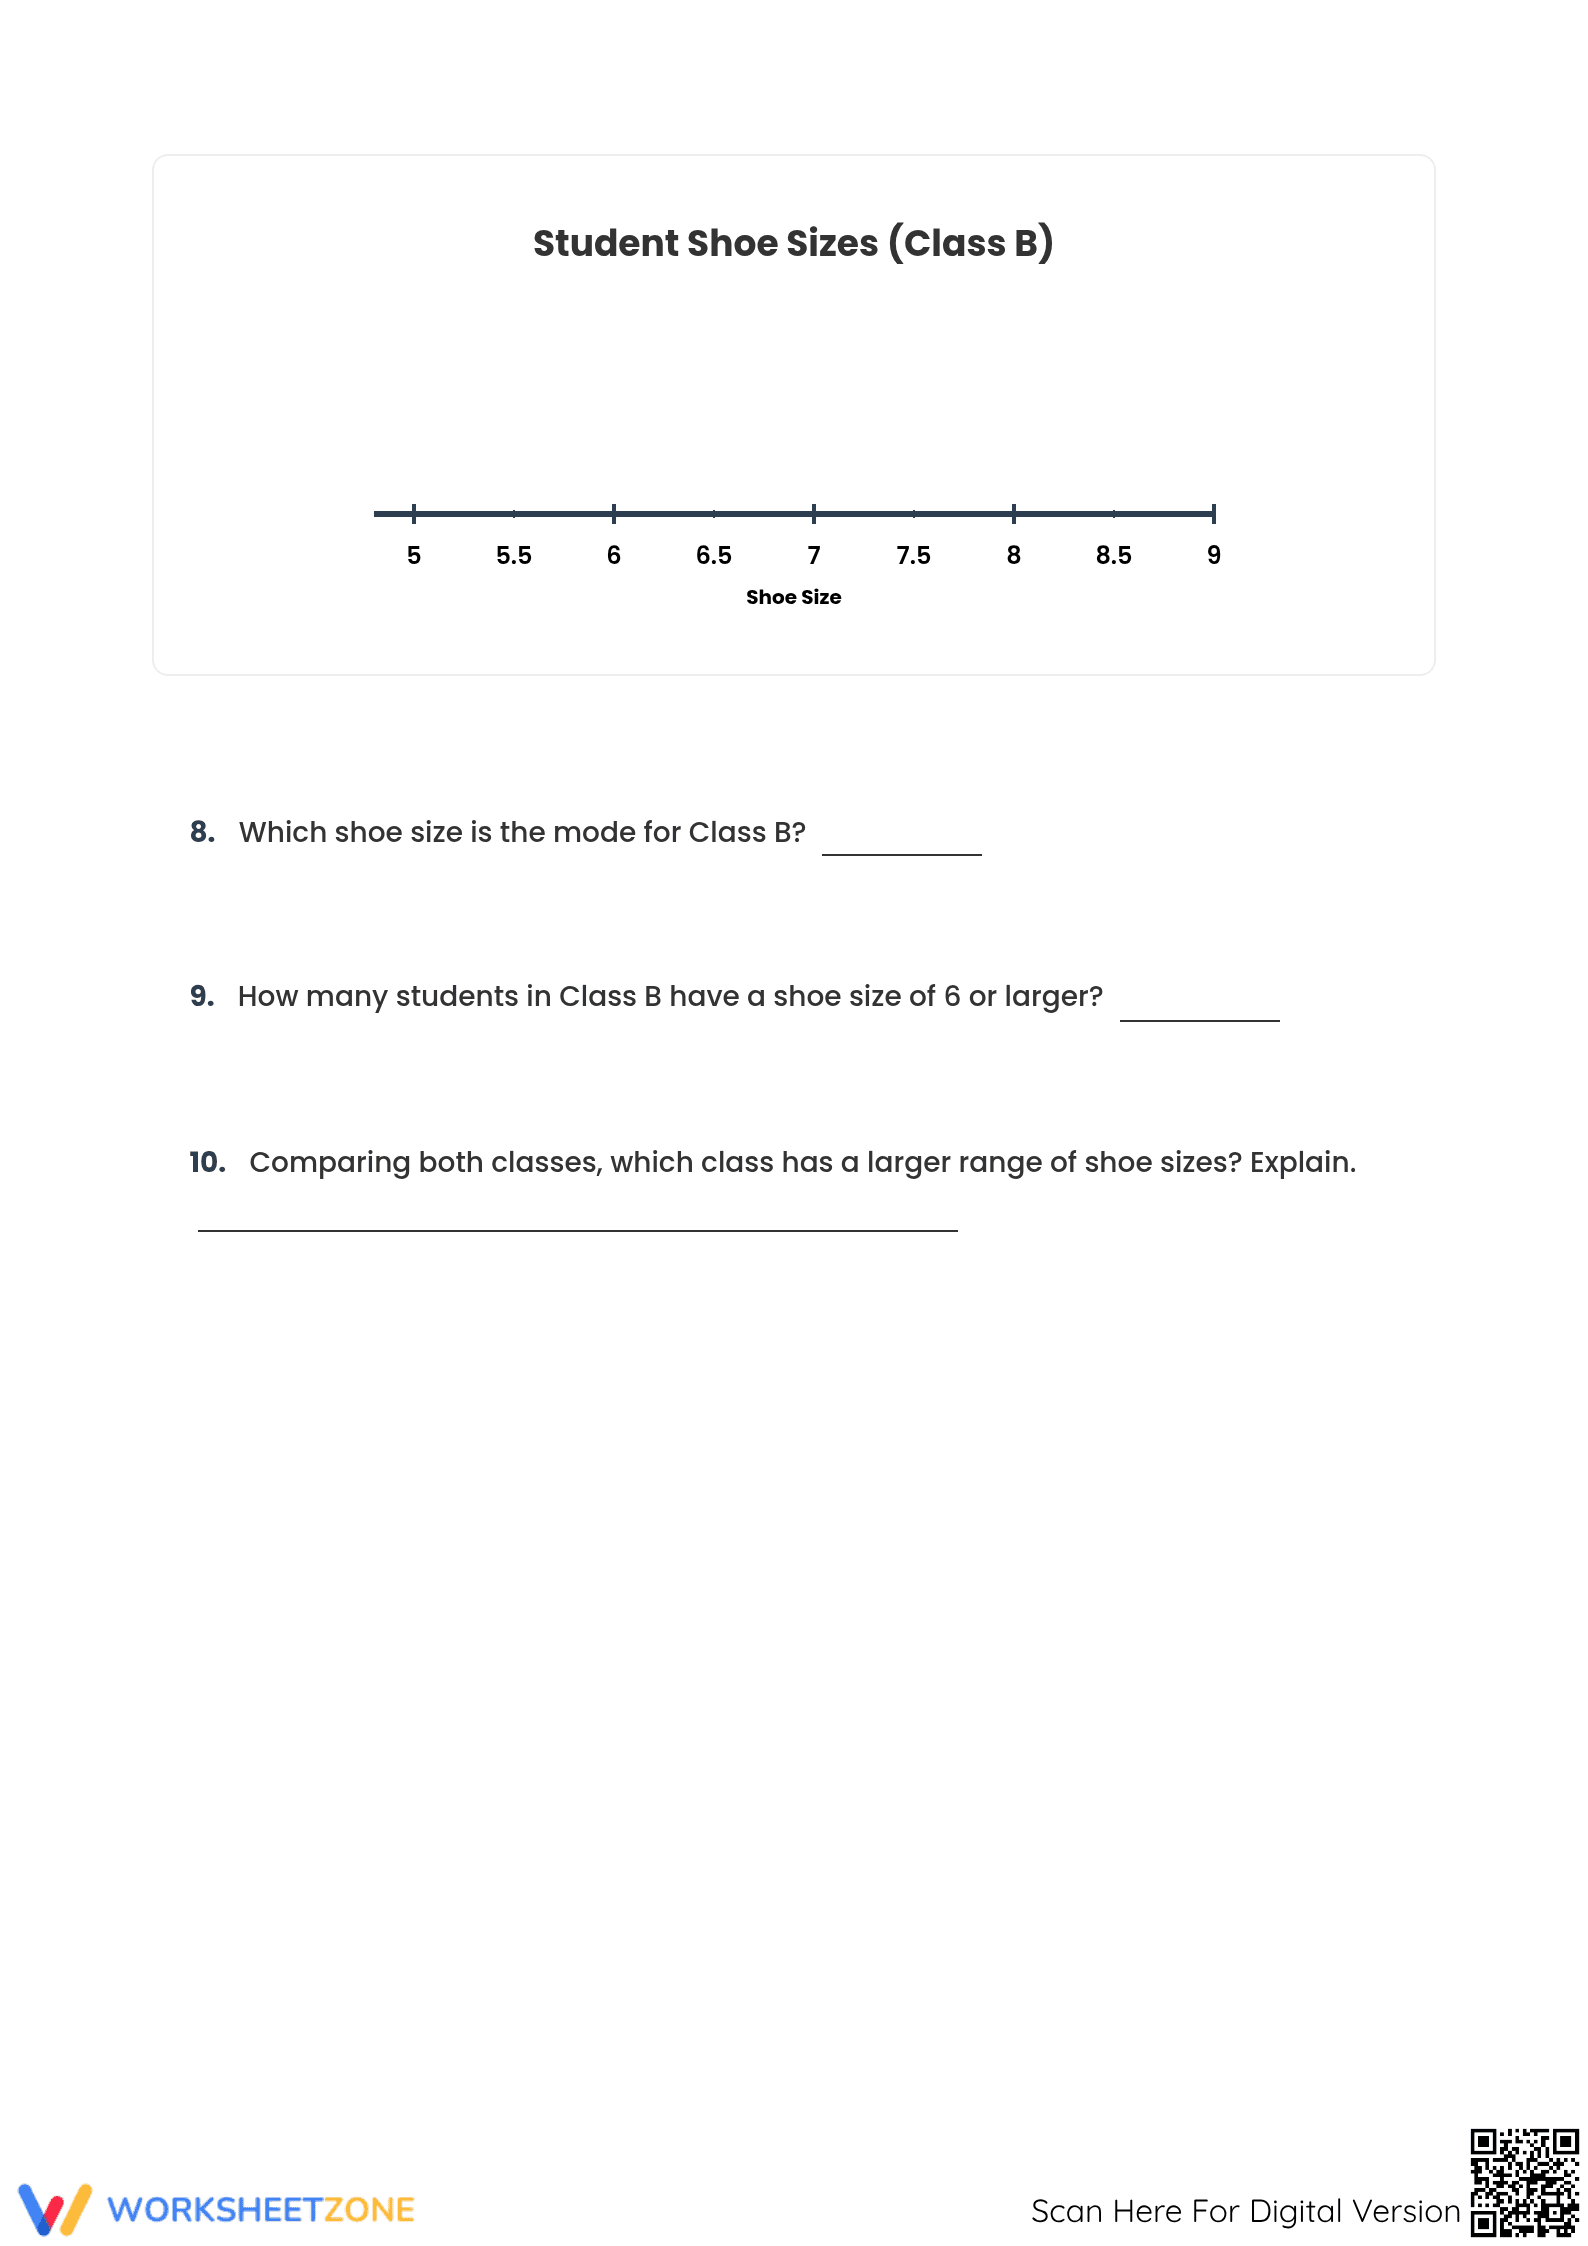
- Independent construction: The final stage requires students to translate a 15-item data table into a finished plot for Class B, demonstrating mastery of scale and labeling.
This sequence follows the gradual-release model, ensuring students have the scaffolding needed before transitioning from the 'I Do' phase to 'You Do' mastery.
Standards Alignment
The primary focus of this worksheet is `4.MD.B.4`, which requires students to make a line plot to display a data set of measurements in fractions of a unit and solve problems involving addition and subtraction of fractions by using information presented in line plots. Additionally, it supports `5.MD.B.2` by extending these skills to more complex data sets. Both standard codes can be copied directly into lesson plans, IEP goals, or district curriculum mapping tools.
How to Use It
This resource is ideal for use during the independent practice portion of a lesson on data displays. After a direct instruction session on how "X" marks represent individual data points, distribute this worksheet to verify student understanding. For a formative assessment observation, watch for students who struggle to correctly place data points on the half-size increments (e.g., 5.5 or 6.5), as this often indicates a need for additional fraction number line support.
Who It's For
Designed primarily for fourth and fifth-grade students, this worksheet is also an excellent remediation tool for sixth graders who require a refresher on data visualization. It pairs naturally with a math journal entry or an anchor chart displaying the steps for creating a line plot. The clear layout and structured questioning make it accessible for diverse learners while providing enough complexity for on-grade mastery.
This worksheet's instructional design aligns with research emphasizing active data visualization for quantitative literacy. Focusing on the 4.MD.B.4 standard and fractional measurements, it helps students transition from rote calculations to mathematical modeling. This approach ensures meaningful practice and long-term skill retention, bridging abstract data and concrete visual representations.