


Views
Downloads
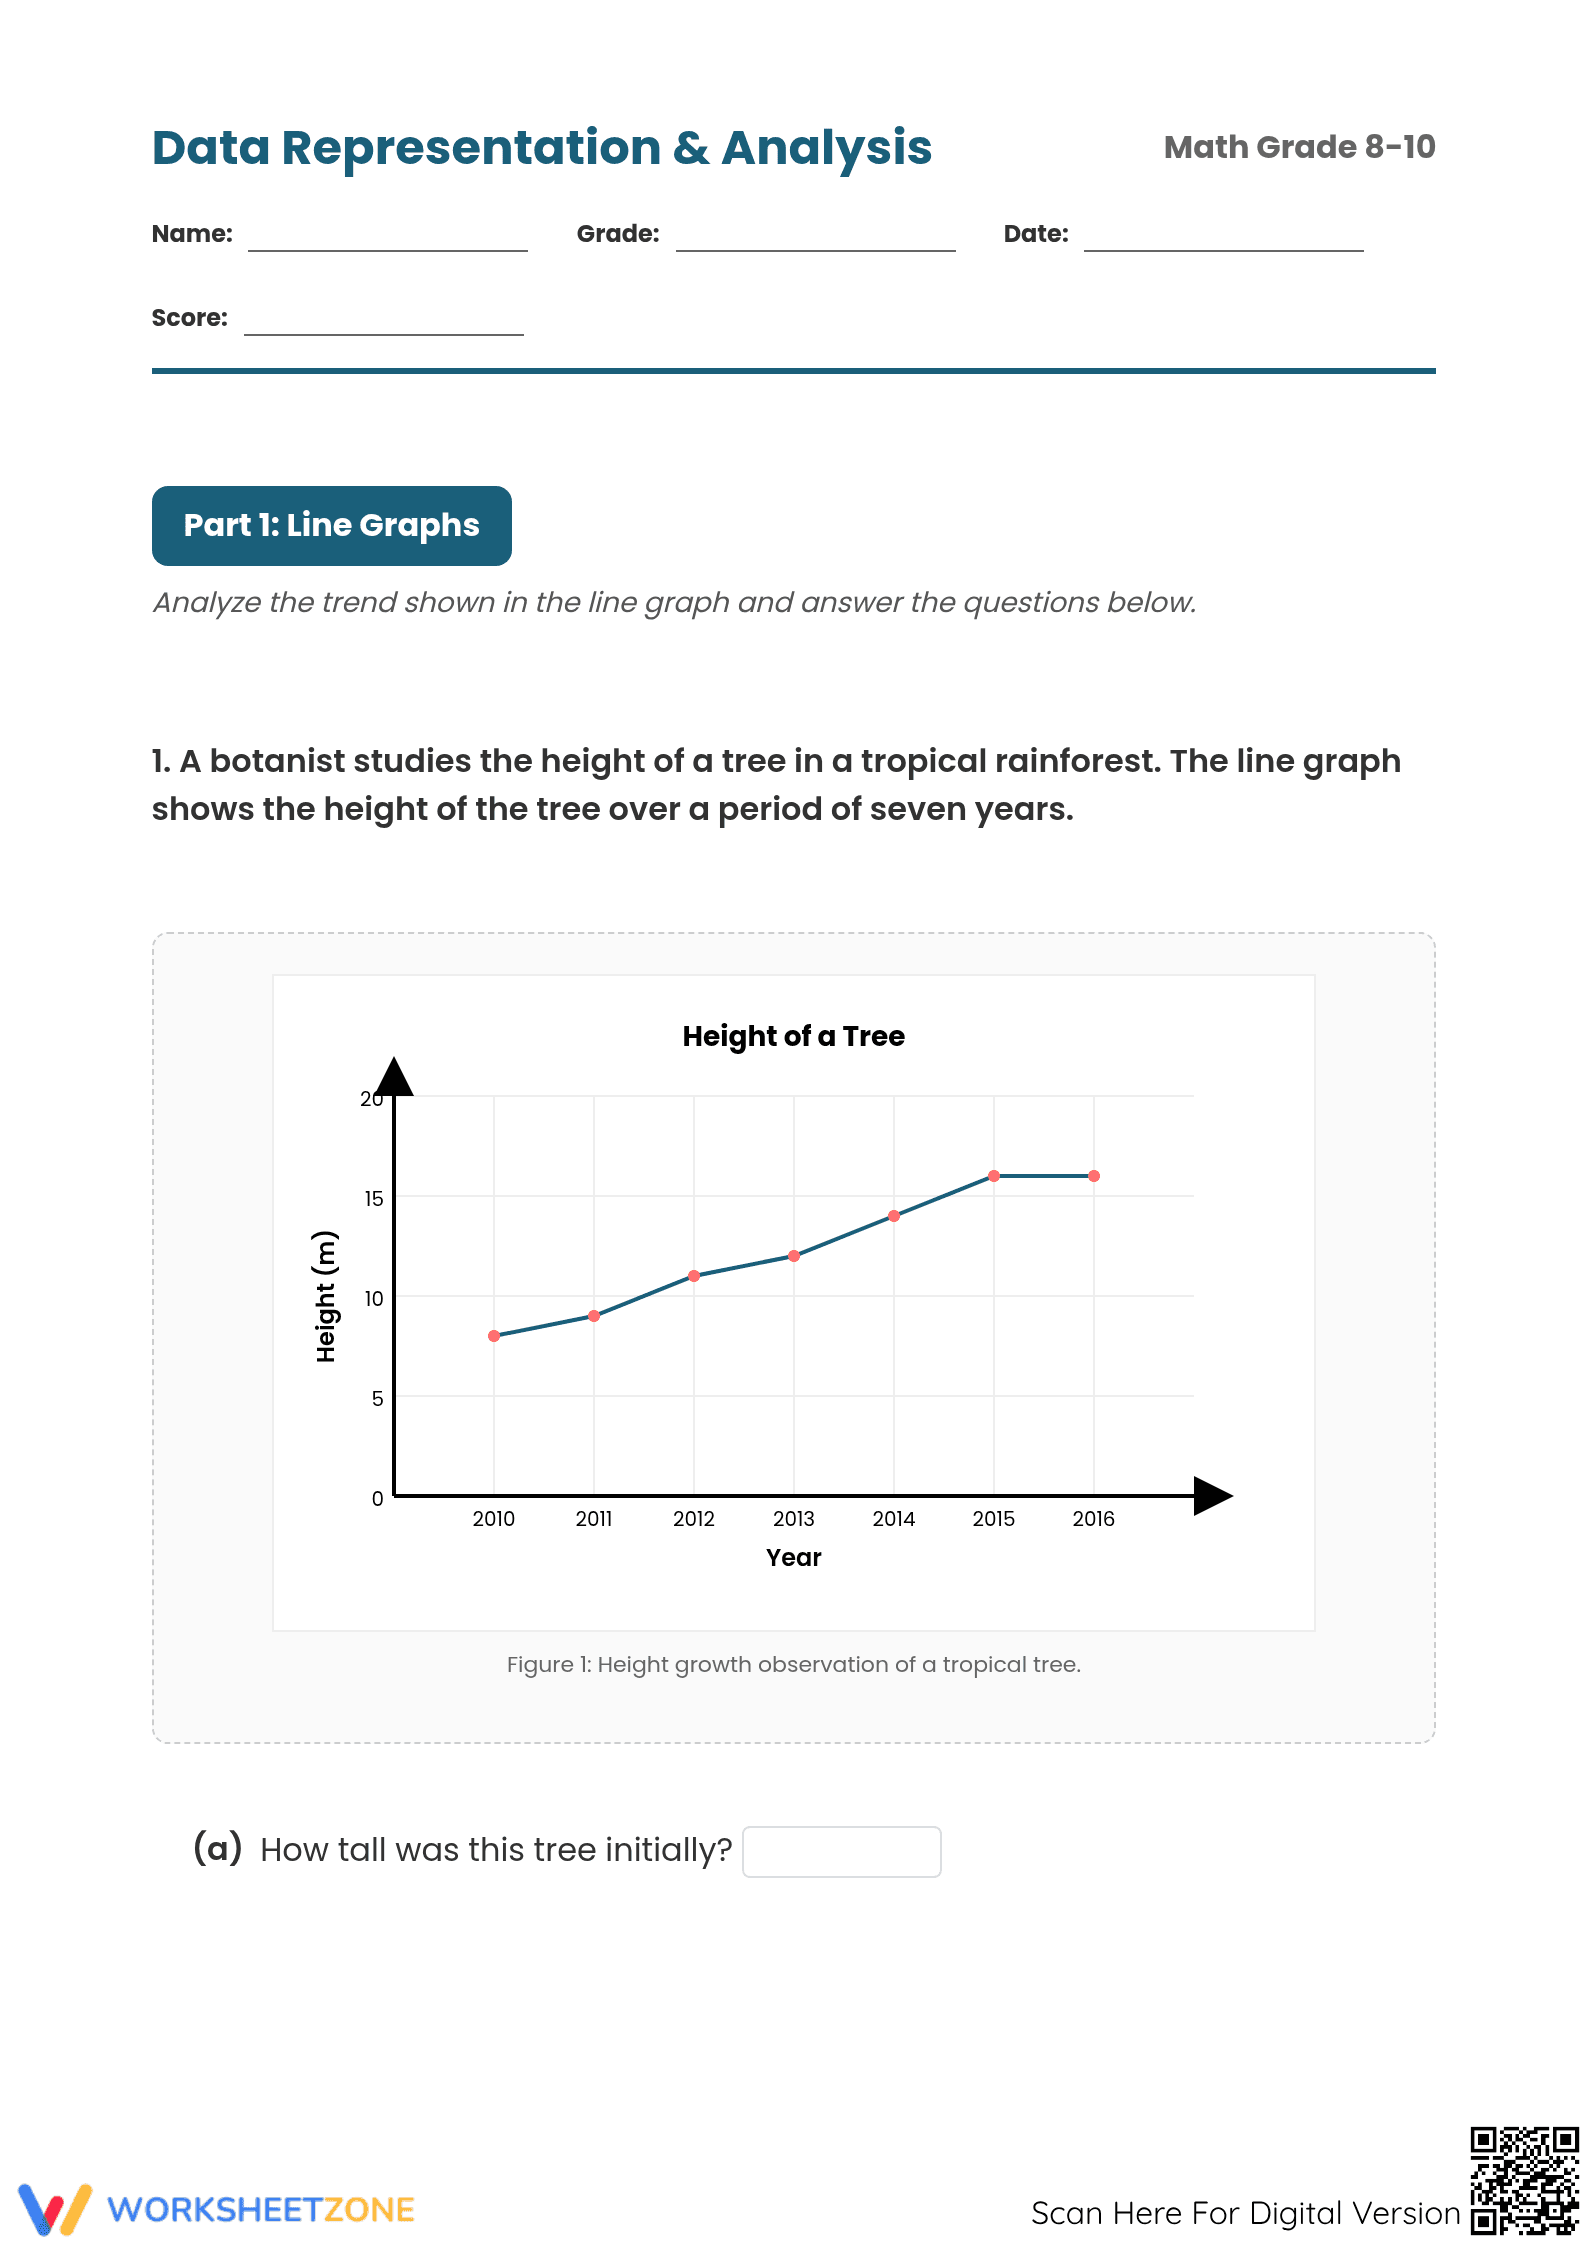
Essential Data & Histograms Worksheet | Grades 8-10 Math
Paste this activity's link or code into your existing LMS (Google Classroom, Canvas, Teams, Schoology, Moodle, etc.).
Students can open and work on the activity right away, with no student login required.
You'll still be able to track student progress and results from your teacher account.
Master Data Analysis with This Essential Worksheet
This essential math worksheet for grades 8-10 provides focused practice on interpreting numerical data. Students will work through problems involving frequency tables and histograms, strengthening their ability to represent and analyze data distributions, a core skill in statistics. The exercises build a solid foundation for understanding center and spread.
At a Glance
- Grade: 8-10 · Subject: Math (Data & Statistics)
- Standard:
HSS-ID.A.1— Represent data with plots on the real number line, including histograms.- Skill Focus: Interpreting Histograms and Frequency Tables
- Format: 5 pages · 24 problems · Answer key included · PDF
- Best For: Independent practice, homework, or formative assessment
- Time: 25–40 minutes
What's Inside
This five-page resource contains 24 problems on data interpretation. Tasks involve analyzing frequency tables and histograms, requiring students to calculate statistical measures (mean, mode, range) and interpret data distributions. A full answer key is included.
A Structured Path to Skill Mastery
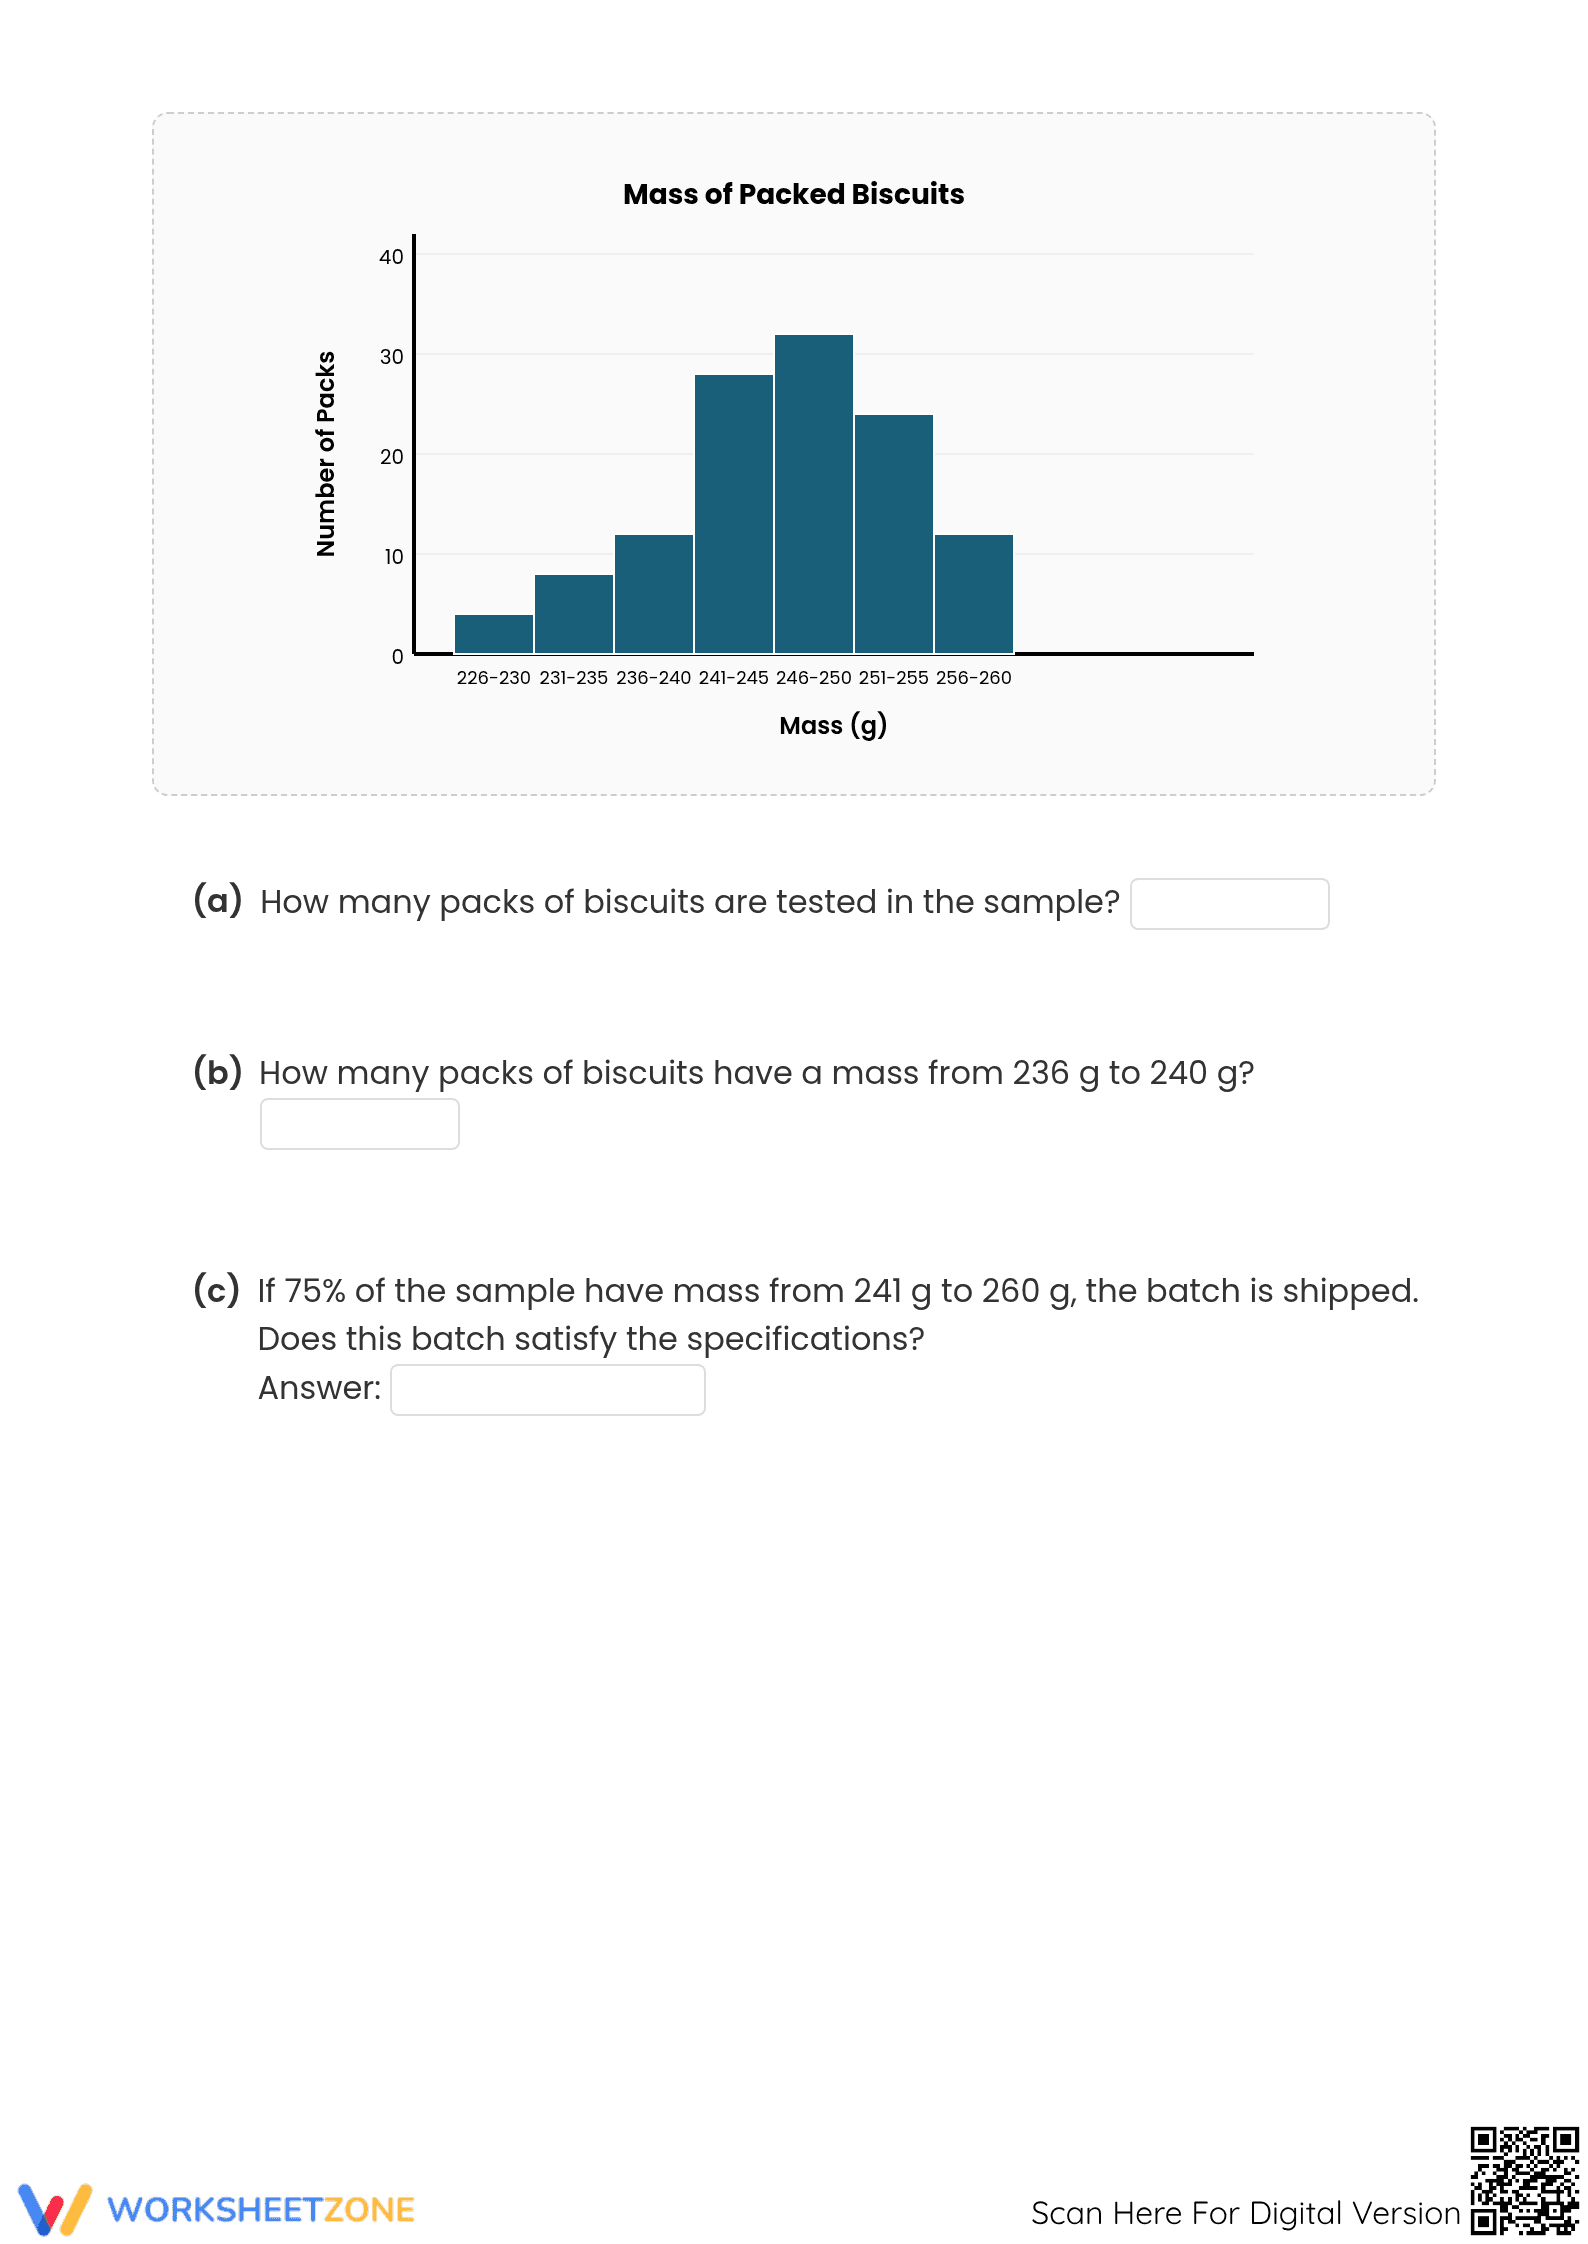
- Guided Practice: The worksheet begins by asking students to read values directly from a frequency table and a histogram (Problems 1-2).
- Supported Practice: Complexity increases as students perform calculations based on the data, such as finding the mean from a frequency table (Problem 3).
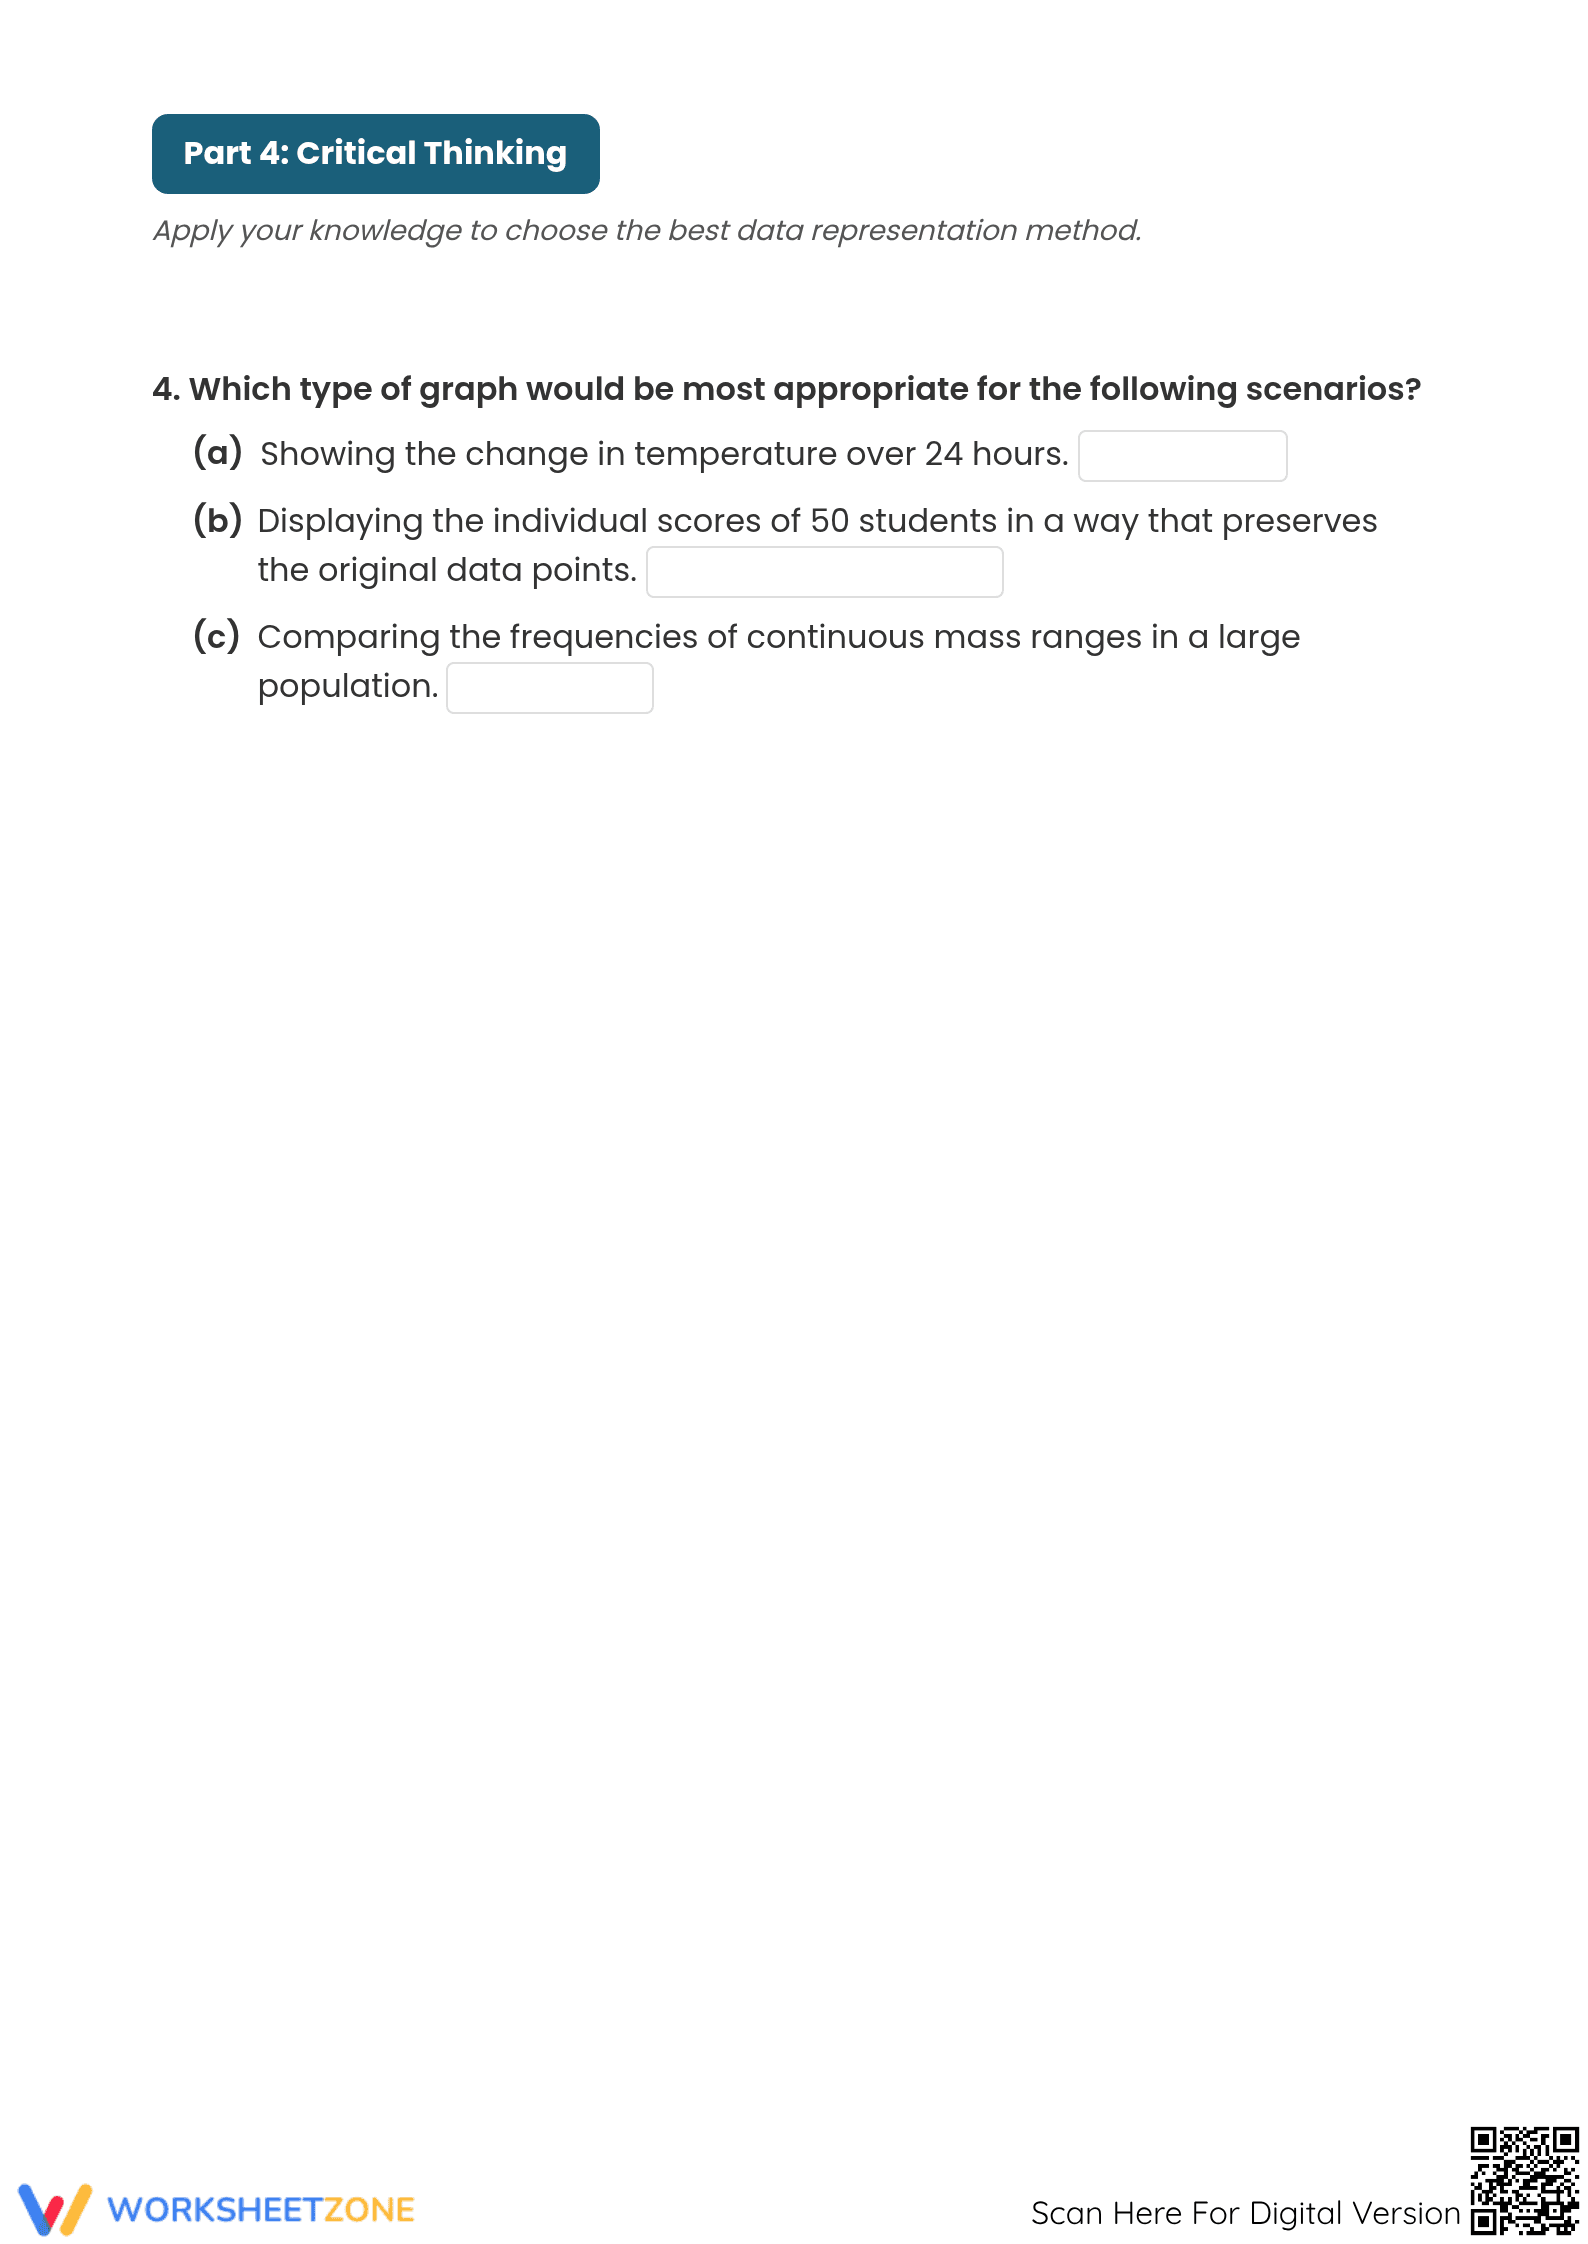
- Independent Practice: The final sections challenge students to apply their understanding to new contexts, interpreting the characteristics of different histograms (Problems 4-5).
This structure reflects a gradual-release model, scaffolding learning from basic representation to analysis.
Standards Alignment for Your Lesson Plans
This worksheet aligns with CCSS HSS-ID.A.1, requiring students to represent data with plots like histograms. The tasks provide extensive practice in interpreting these charts. It also supports foundational skills for HSS-ID.A.2. The standard codes can be copied directly into lesson plans or curriculum maps.
How to Use It in Your Classroom
Use this worksheet for independent practice after a lesson on histograms, or as homework. For a formative check, observe students on problem 4 to spot misconceptions about reading intervals. The worksheet takes about 25-40 minutes to complete.
Who It's For
Designed for Grades 8-10 students in a statistics unit. Its clear structure is accessible for most learners. For students needing support, pair it with a visual anchor chart. It’s a good follow-up to an intro lesson on data collection.
This worksheet provides practice aligned to CCSS standard HSS-ID.A.1, focusing on the critical skill of representing and interpreting data in histograms. Proficiency in this area is foundational for statistical literacy, enabling students to make sense of quantitative information. Research highlights the importance of repeated, structured practice for procedural fluency in mathematics. According to the RAND AIRS 2024 report on effective math instruction, well-designed worksheets that isolate specific skills can significantly improve student retention. This resource, with its 24 targeted problems, provides the focused repetition needed to build student confidence and mastery in data analysis. By moving from direct reading of charts to calculation and interpretation, the worksheet helps solidify students’ understanding of how visual data representations connect to underlying statistical concepts.