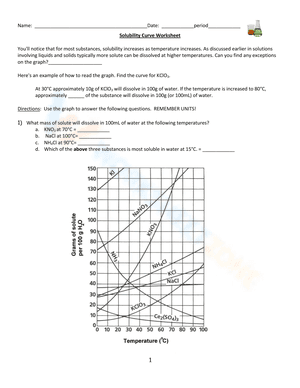
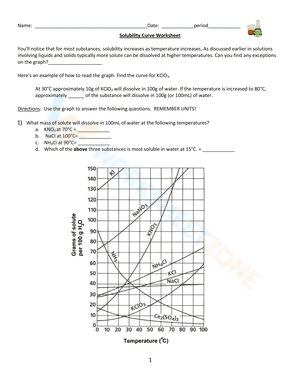
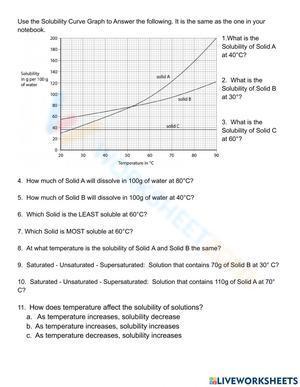
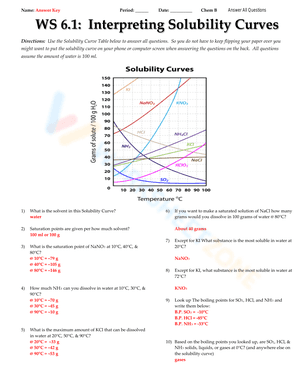
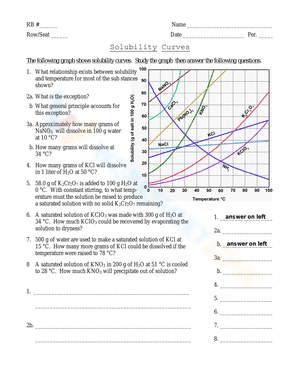
The maximum mass of a substance that will dissolve in 100 g of water at a specific temperature is known as its solubility. With variations in temperature, solids and gasses become more or less soluble in water. A solubility curve shows graphically how the solubility of a given material in a given solvent varies with changing temperatures.
If you are struggling with the problems concerning the solubility curve, please don’t be worried, we have prepared numerous free solubility curve worksheets with answer keys for extra practice. They will provide a great mix of solubility curve problems for your general chemistry class. As the name suggests, these Chemistry worksheets furnish students with additional practice and time interpreting solubility curves. In case you are a teacher or parent, you can create your own activities using our free worksheet maker. This tool can help you make the most suitable materials for your students or kids.
Try our solubility curve worksheets if you're seeking a means to reteach and offer extra help when it comes to solubility curves. We’re sure that it would be a great reinforcement activity.
