


Views
Downloads

Constant of Proportionality Printable Worksheet | Grade 7
Paste this activity's link or code into your existing LMS (Google Classroom, Canvas, Teams, Schoology, Moodle, etc.).
Students can open and work on the activity right away, with no student login required.
You'll still be able to track student progress and results from your teacher account.
Strengthen your students' grasp of proportional relationships with this comprehensive practice set focused on multiple representations. This resource ensures that learners can fluently move between equations, coordinate graphs, and verbal scenarios to identify and calculate the constant of proportionality. Students will transform raw data into visual evidence while justifying their mathematical reasoning through written explanations.
At a Glance
- Grade: 7 · Subject: Mathematics
- Standard:
CCSS.MATH.CONTENT.7.RP.A.2— Identify the constant of proportionality in tables, graphs, and equations- Skill Focus: Translating between mathematical representations
- Format: 3 pages · 9 tasks · Answer key included · PDF
- Best For: Mid-unit practice and formative assessment
- Time: 30–45 minutes
What's Inside
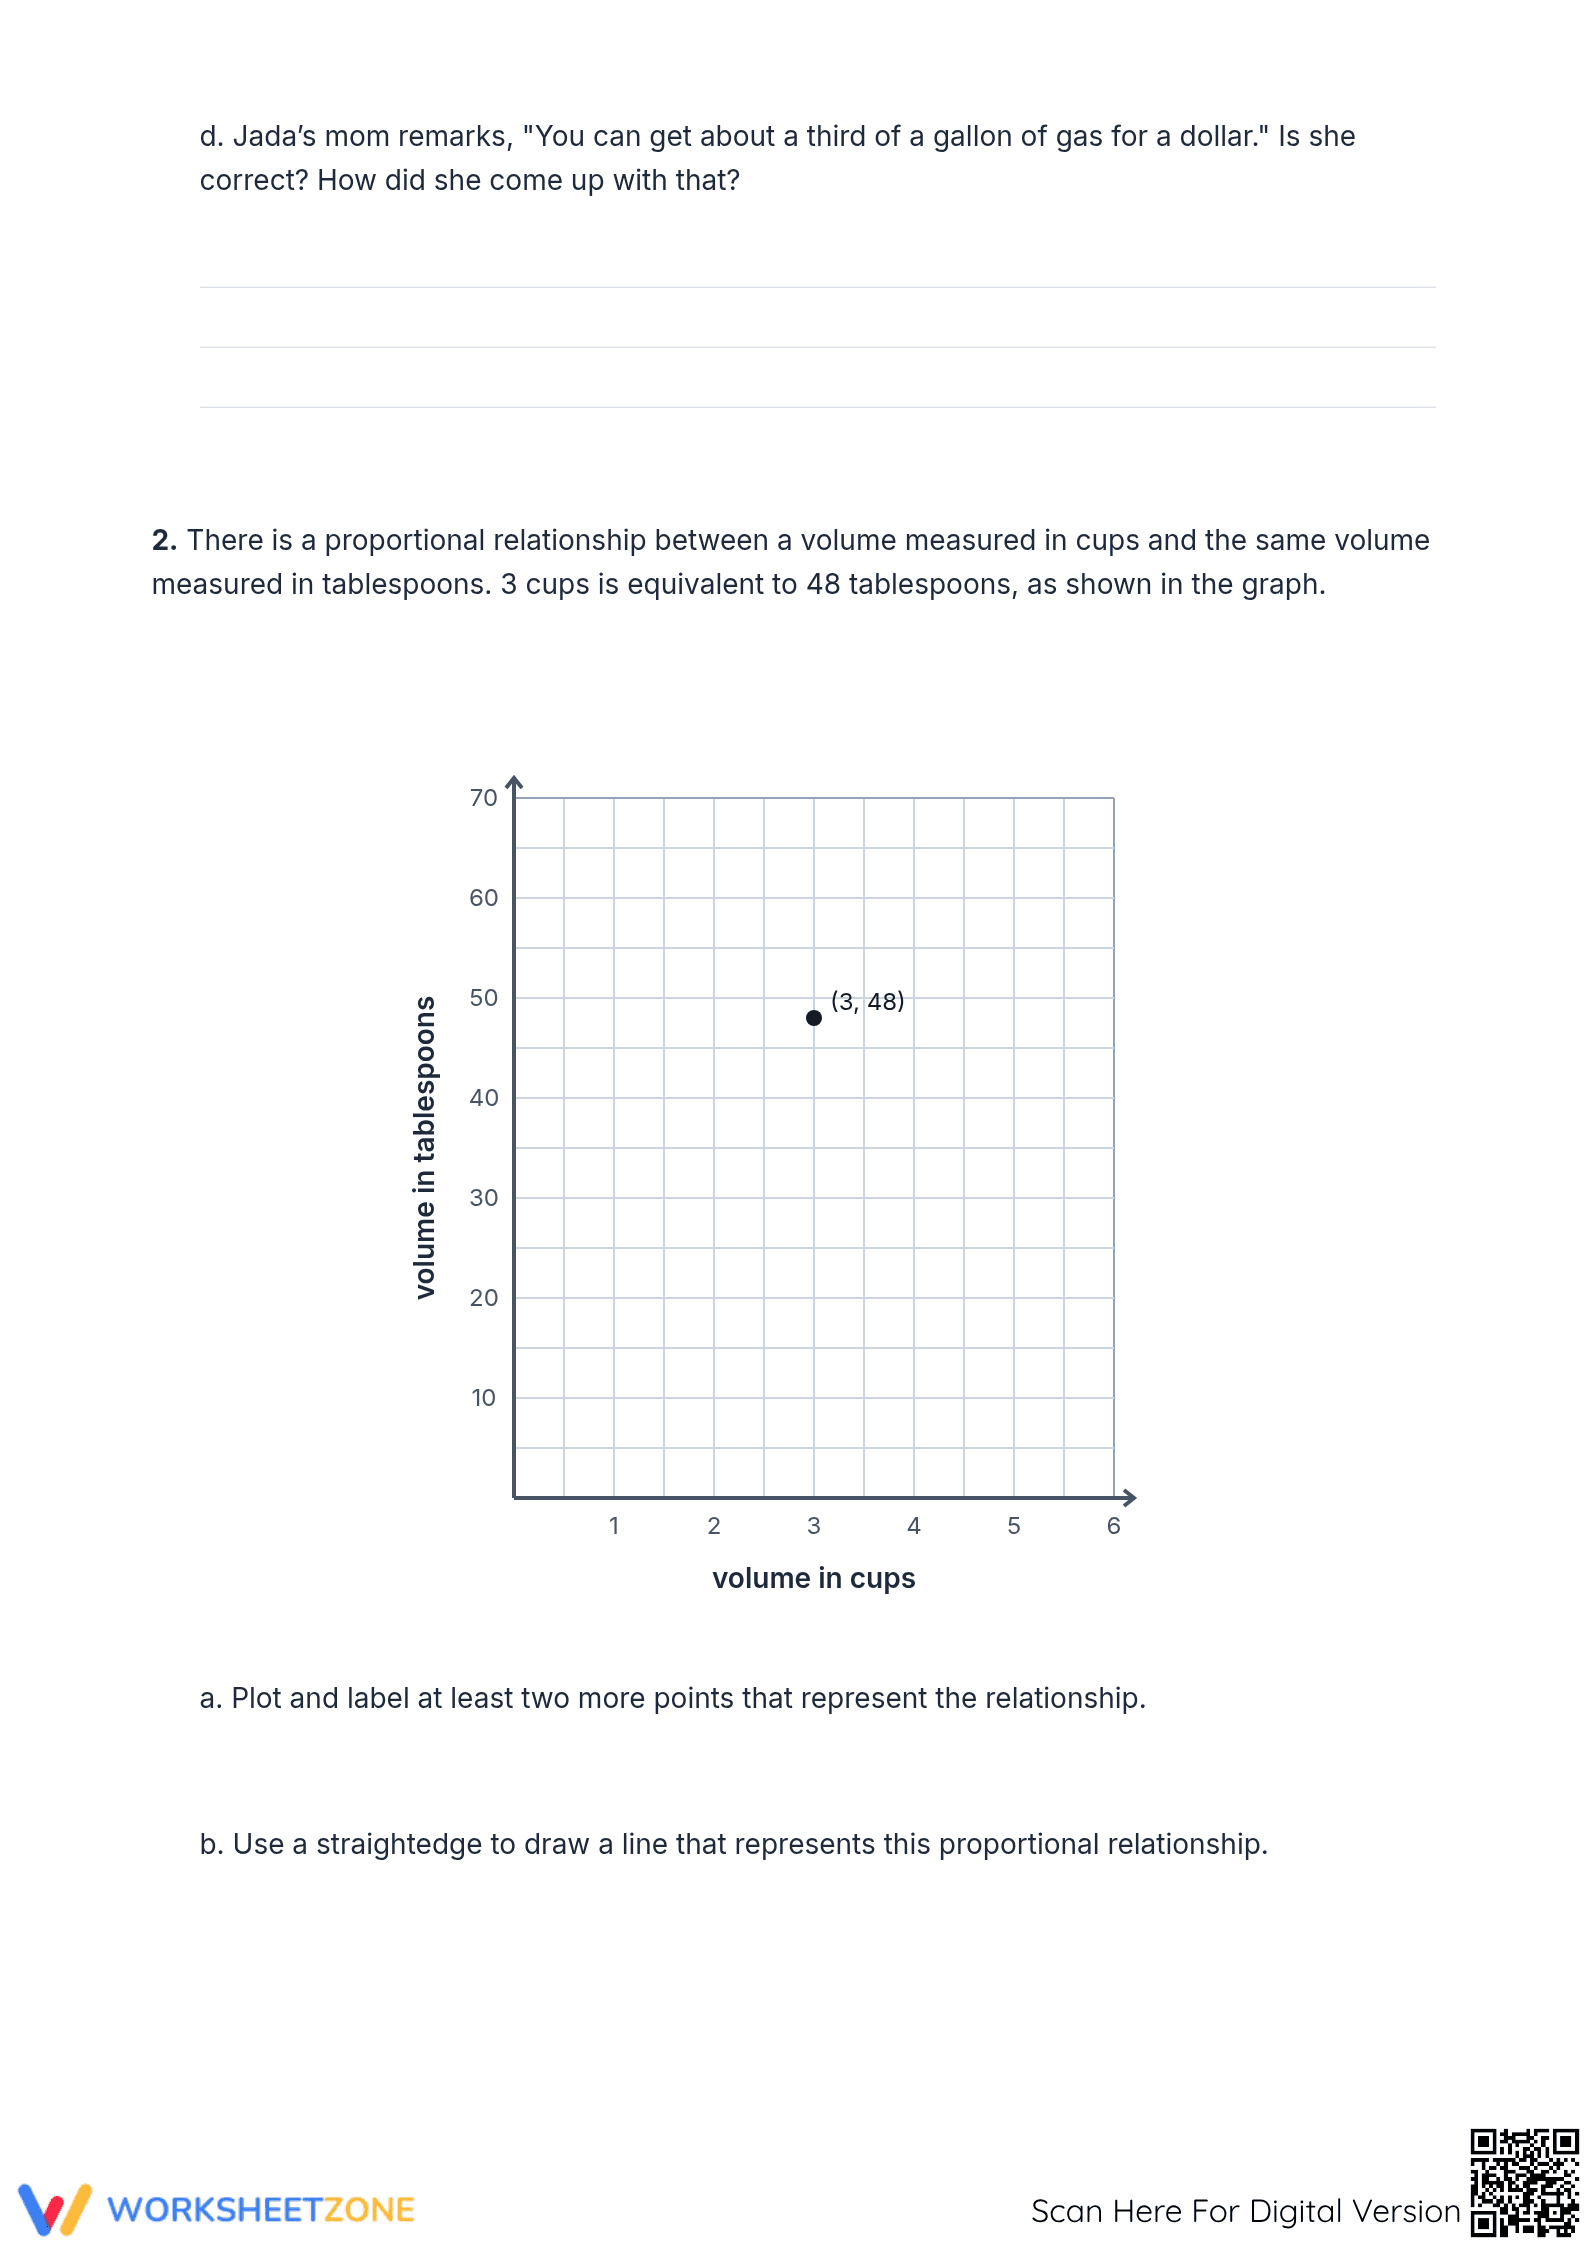
This 3-page printable PDF features two multi-part real-world problems that challenge students to analyze proportional data. The first scenario focuses on fuel costs using the equation c = 2.95g, requiring students to generate coordinate pairs and plot a graph. The second scenario explores unit conversions between cups and tablespoons using a provided graph to derive the underlying equation. The layout includes ample workspace for graphing and structured lines for written responses.
Skill Progression
- Guided Practice: Students begin with an explicit equation (c = 2.95g) and are prompted to create a table of values, providing a low-floor entry point for calculation.
- Supported Practice: The middle tasks require students to interpret a coordinate graph with a labeled point (3, 48) to identify additional points and draw a line of best fit.
- Independent Practice: The final challenges demand that students synthesize their findings to write their own equations (t = 16c) and define the constant of proportionality in context.
This scaffolded approach follows the gradual release of responsibility model, moving from structured computation to abstract algebraic representation.
Standards Alignment
This worksheet is strictly aligned to `CCSS.MATH.CONTENT.7.RP.A.2`, which requires students to recognize and represent proportional relationships between quantities. Specifically, it targets sub-standard 7.RP.A.2b by asking students to identify the constant of proportionality (unit rate) in tables, graphs, and equations. This standard code can be copied directly into lesson plans, IEP goals, or district curriculum mapping tools to ensure instructional compliance.
How to Use It
This resource is ideal for use during the independent practice portion of a lesson on unit rates. For a high-impact strategy, have students complete the first page as a "Check for Understanding" before proceeding to the second scenario. While students work, circulate and observe if they are correctly labeling their axes; this provides immediate formative data on their graphing proficiency. It also serves as an excellent sub-plan since the instructions are self-contained and require zero teacher setup.
Who It's For
This practice set is designed for Grade 7 mathematics students, particularly those requiring additional reinforcement with the visual aspects of algebra. It provides excellent support for English Language Learners through the use of clear, repetitive sentence structures and visual graphing aids. This worksheet pairs naturally with a direct instruction lesson on unit rates or a companion digital graphing activity.
According to the RAND AIRS 2024 analysis, instructional materials that emphasize the translation between symbolic equations and visual graphs significantly improve long-term retention of algebraic concepts. This worksheet addresses CCSS.MATH.CONTENT.7.RP.A.2 by forcing students to reconcile the numerical unit rate with the slope of a line on a coordinate plane. By completing these 9 tasks, students develop the procedural fluency necessary for eighth-grade linear functions. The inclusion of real-world contexts like fuel prices and kitchen measurements helps anchor abstract variables in concrete reality, a method endorsed by the National Assessment of Educational Progress (NAEP) for increasing student engagement in middle school math. Educators can utilize this summary as a standalone evidence-based justification for curriculum inclusion.