


Views
Downloads


Constant of Proportionality Worksheet | Grade 7 Printable
Paste this activity's link or code into your existing LMS (Google Classroom, Canvas, Teams, Schoology, Moodle, etc.).
Students can open and work on the activity right away, with no student login required.
You'll still be able to track student progress and results from your teacher account.
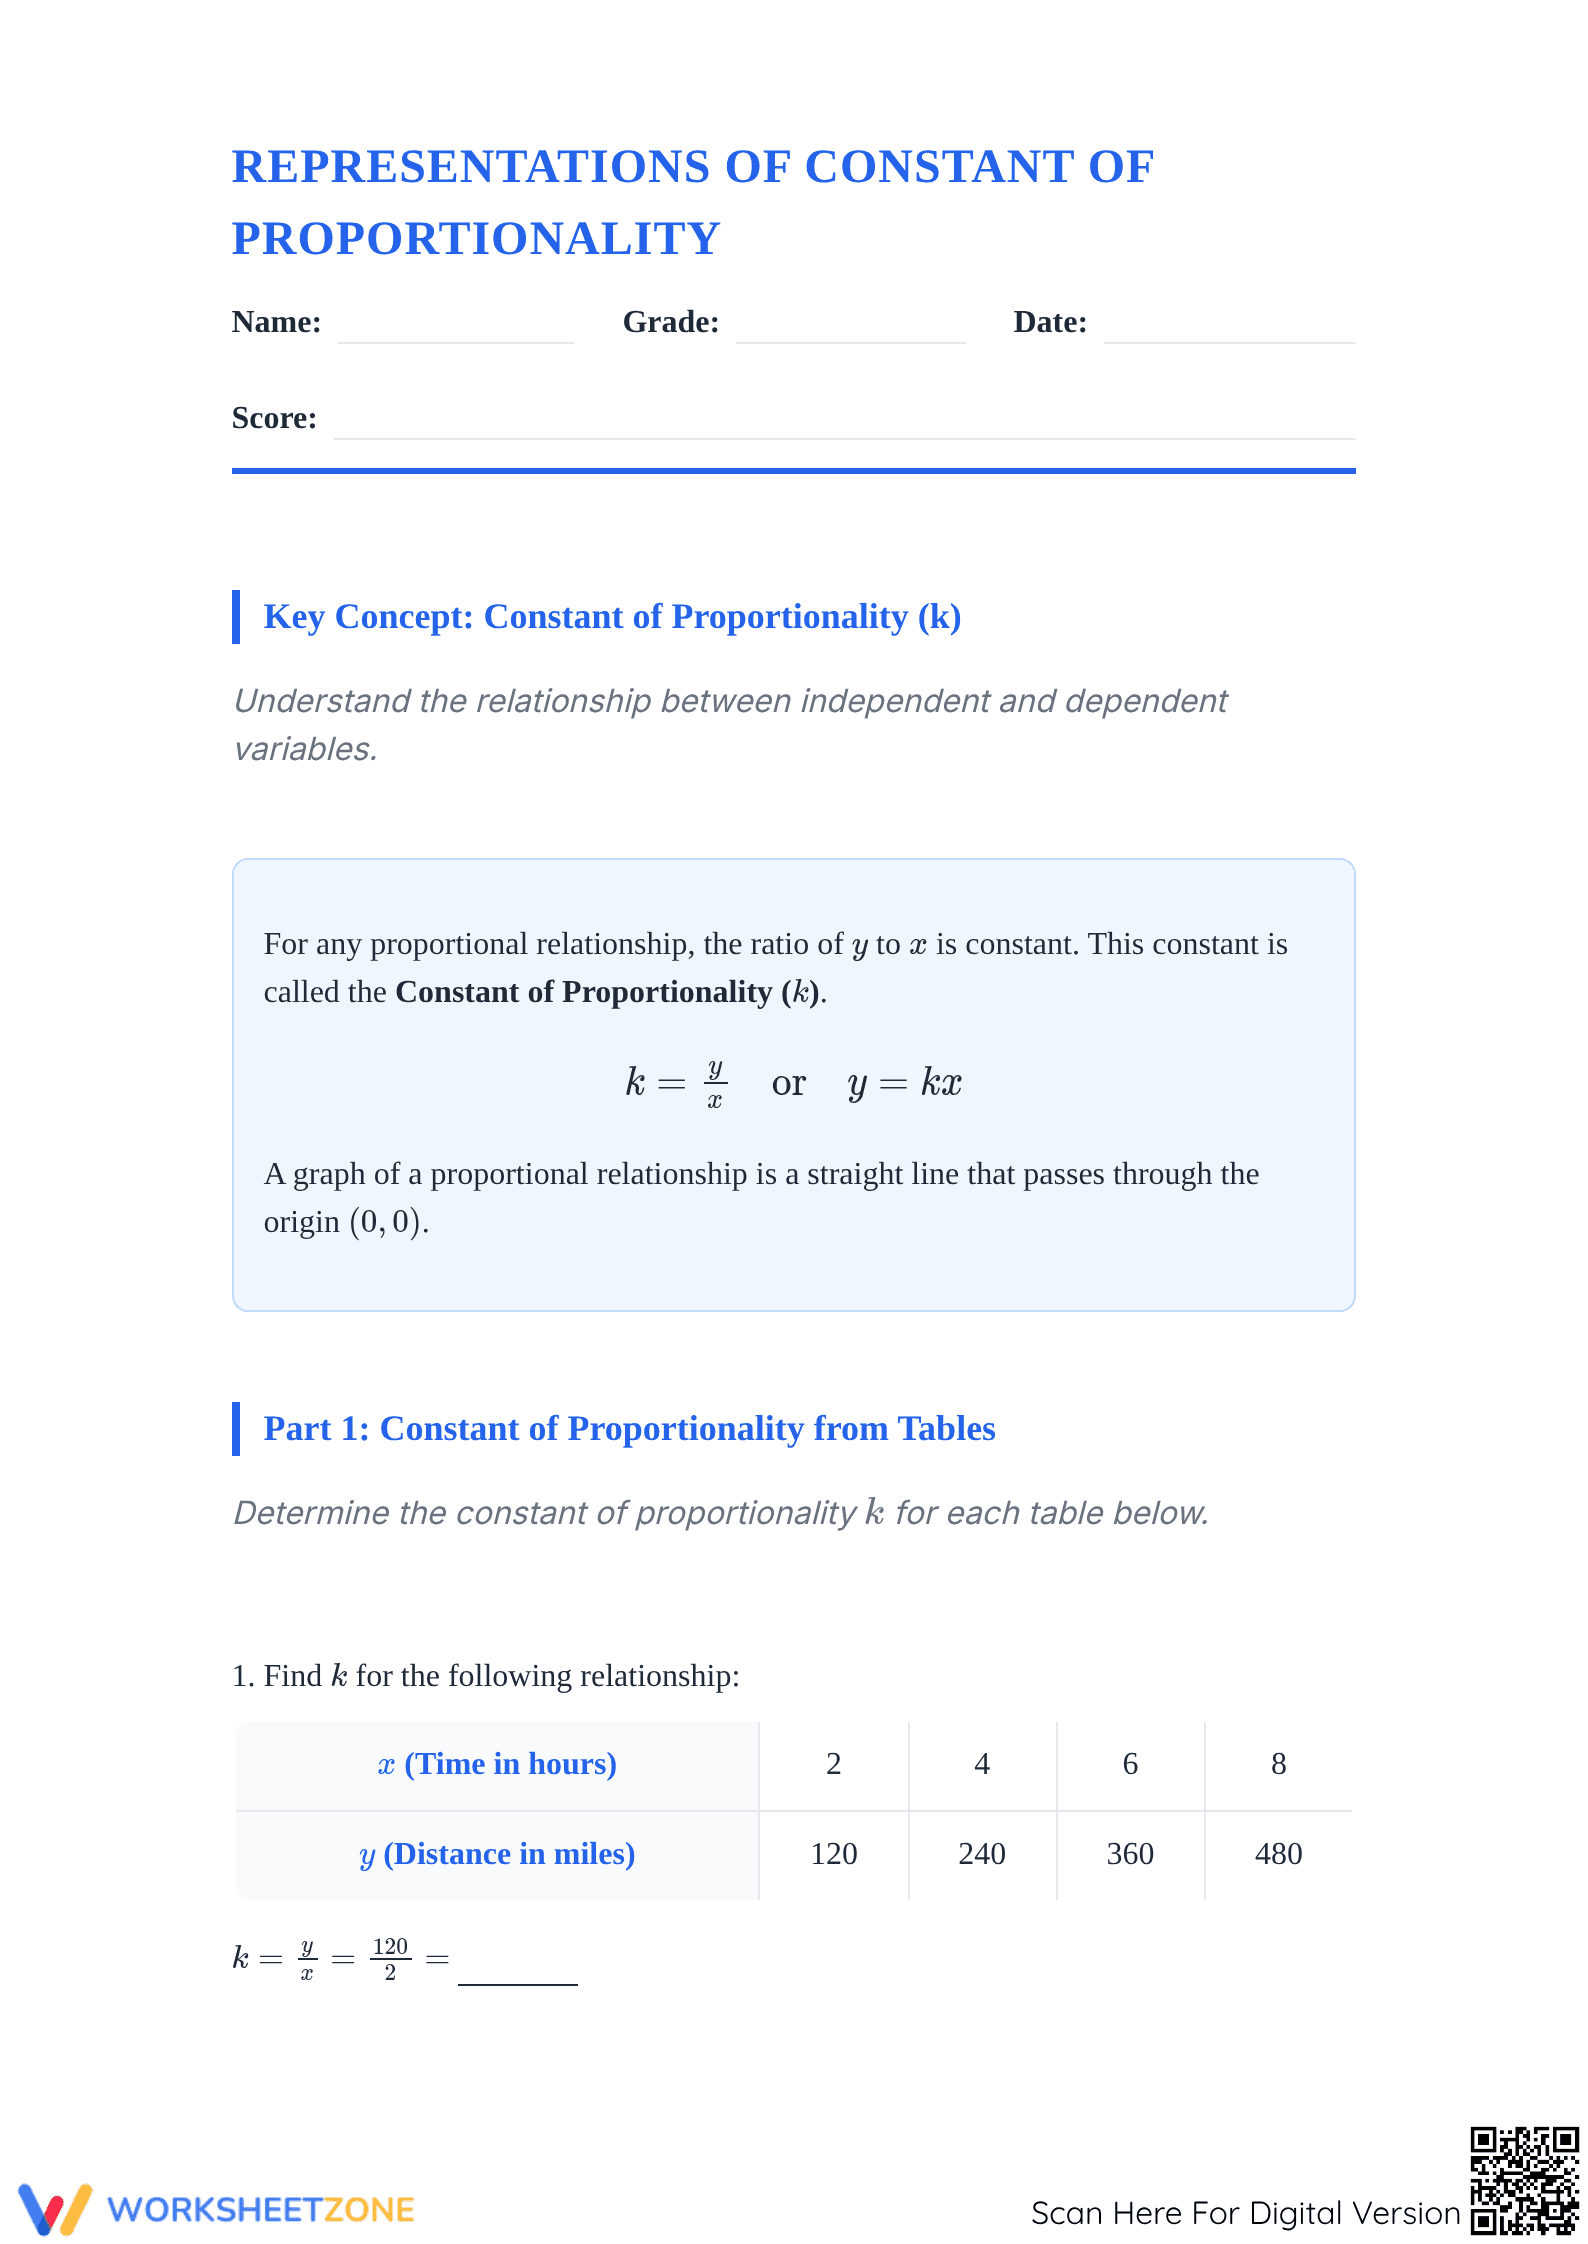
Identifying the constant of proportionality (k) is a foundational hurdle in middle school algebra. This worksheet provides a comprehensive pathway for students to calculate k from four distinct mathematical perspectives: tables, graphs, algebraic equations, and verbal word problems. By mastering these representations, learners build the structural fluency required for linear functions.
At a Glance
- Grade: 7 · Subject: Math
- Standard:
CCSS.MATH.CONTENT.7.RP.A.2— Recognize and represent proportional relationships between quantities through tables, graphs, and equations.- Skill Focus: Constant of Proportionality (k)
- Format: 5 pages · 15 problems · Answer key included · PDF
- Best For: Mastery practice and unit assessments
- Time: 40–50 minutes
This 5-page PDF contains 15 structured problems that transition students from simple ratio identification to complex application. It includes a dedicated "Key Concept" anchor box for student reference, followed by sections for finding k in tables, deriving unit rates from graphs, and matching multiple representations. A full answer key is provided for immediate feedback and grading efficiency.
Skill Progression
- Guided practice: The first section uses scaffolded equations (k = y/x) to help students calculate the constant from structured tables, focusing on real-world variables like distance, cost, and rate.
- Supported practice: Students move to visual representations, identifying unit rates on coordinate planes and writing equations in the form y = kx based on graphical intersections.
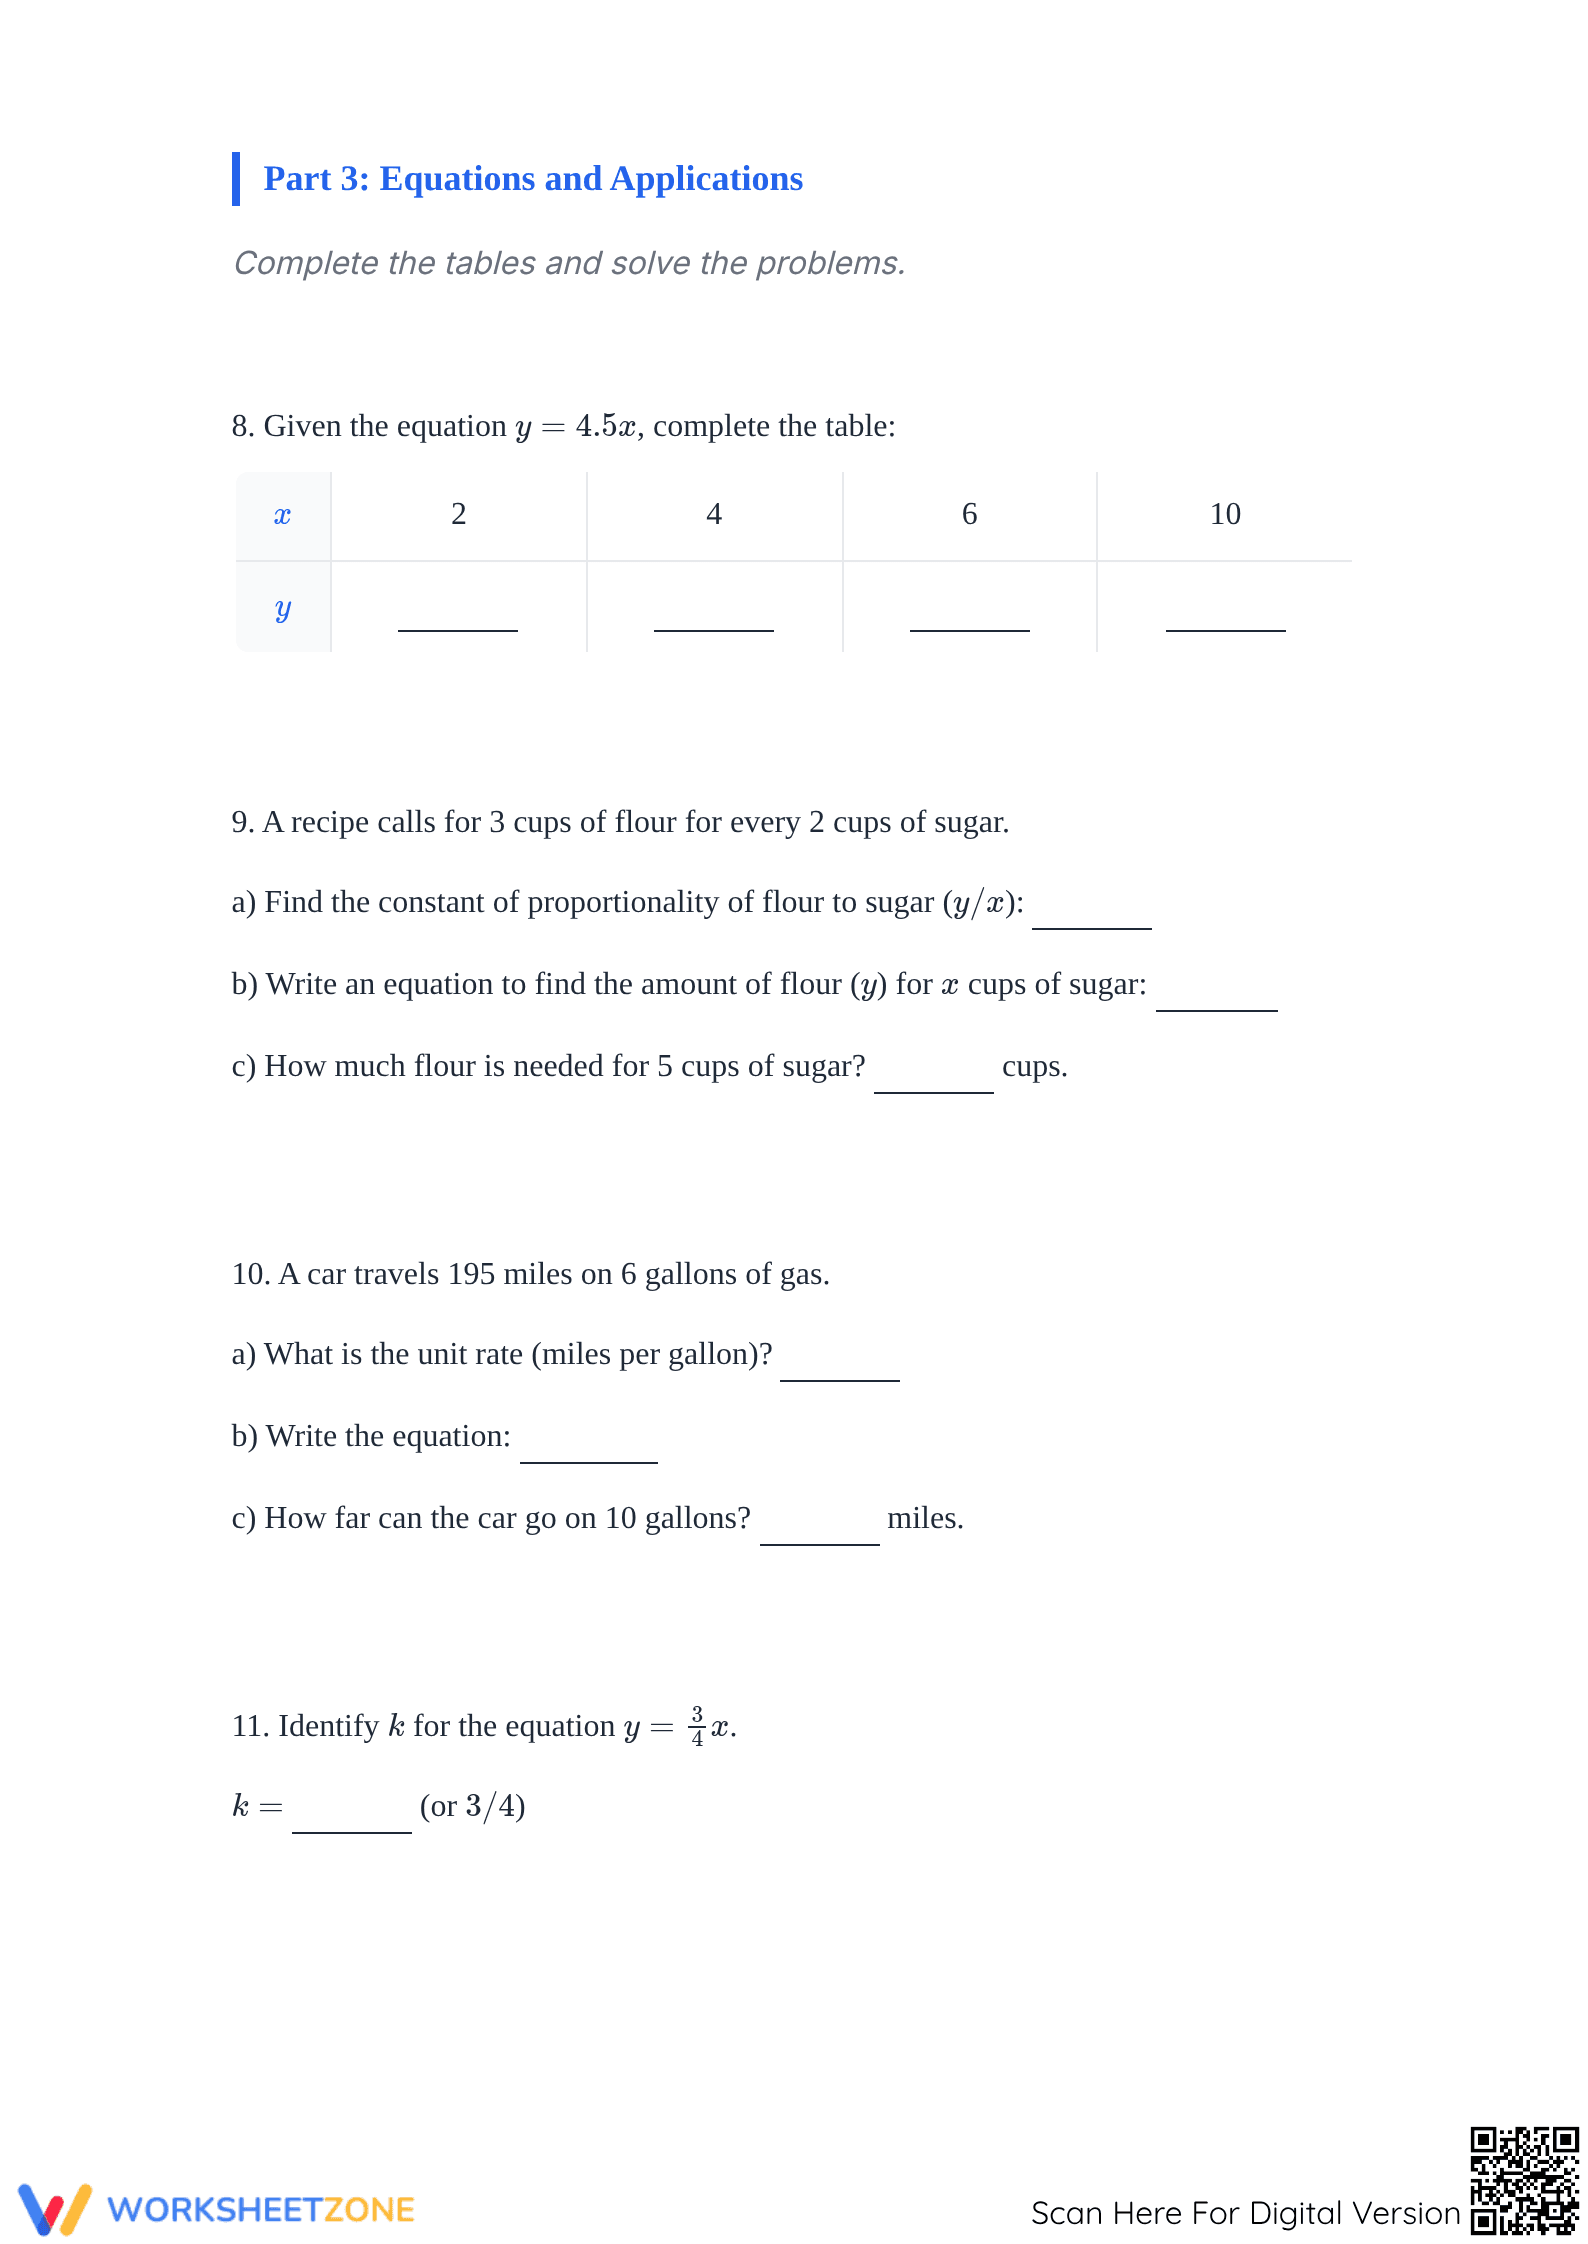
- Independent practice: The final sections challenge students to match verbal descriptions to algebraic models and solve multi-step application problems involving unit rate conversions.
This gradual release approach ensures that students build confidence before tackling independent applications.
Standards Alignment
The primary focus of this resource is CCSS.MATH.CONTENT.7.RP.A.2, which requires students to "Recognize and represent proportional relationships between quantities." Specifically, it addresses sub-standards 7.RP.A.2.A (identifying the constant of proportionality) and 7.RP.A.2.C (representing relationships by equations). These standard codes can be copied directly into lesson plans, IEP goals, or district curriculum mapping tools.
How to Use It
Use this resource as a mid-unit mastery check after students have been introduced to ratios but before starting slope-intercept form. A great formative observation tip is to watch how students choose their (x, y) pairs on graphs—successful students will look for points that cross exact grid intersections. This worksheet works well for individual desk work or as a guided math station rotation. Expect total completion in approximately 45 minutes.
Who It's For
This is primarily designed for Grade 7 math students, but it serves as an essential remediation tool for Grade 8 and 9 learners struggling with linear rate of change. It pairs naturally with a "Constant of Proportionality" anchor chart or a short passage on real-world unit rates to provide context for the variables.
According to the RAND AIRS 2024 analysis of middle school mathematics curricula, student success in early algebra depends heavily on the ability to translate between multiple representations of a single concept. This worksheet addresses that specific cognitive demand by forcing students to reconcile table data with graphical output. By standardizing the constant of proportionality (k) across 15 varied tasks, the resource aligns with the Fisher & Frey (2014) model of scaffolded instruction. Research from EdReports (2024) suggests that high-quality math materials must explicitly connect procedural calculations to conceptual representations to avoid rote memorization. This Grade 7 resource ensures students understand that k is not just a variable, but a consistent ratio (y/x) that defines the behavior of a linear system passing through the origin. It is an essential component for any standards-aligned math toolkit.