


Views
Downloads
Reading Weather Data Worksheet | Grade 3 Essential Science
Paste this activity's link or code into your existing LMS (Google Classroom, Canvas, Teams, Schoology, Moodle, etc.).
Students can open and work on the activity right away, with no student login required.
You'll still be able to track student progress and results from your teacher account.
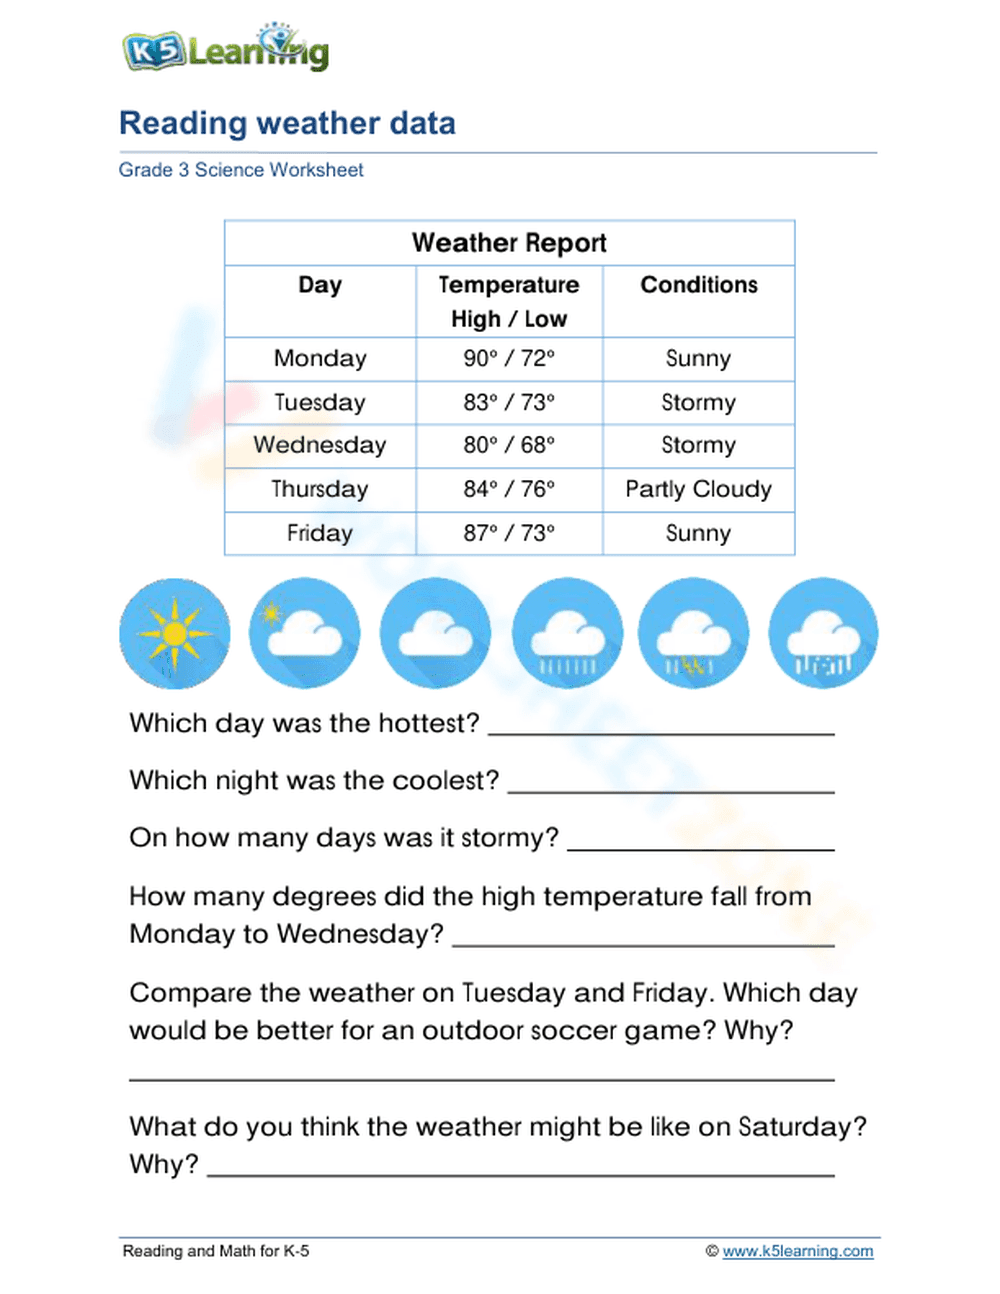
This Grade 3 science worksheet helps students master the skill of interpreting complex weather tables. By analyzing high and low temperatures alongside daily conditions, learners develop critical data literacy skills required for NGSS alignment. Students will answer six targeted questions that require them to extract, compare, and predict weather patterns based on empirical evidence.
At a Glance
- Grade: 3 · Subject: Science
- Standard:
3-ESS2-1— Represent data in tables to describe typical weather conditions- Skill Focus: Data Analysis and Interpretation
- Format: 2 pages · 6 problems · Answer key included · PDF
- Best For: Independent practice or quick formative assessment
- Time: 15–20 minutes
What's Inside
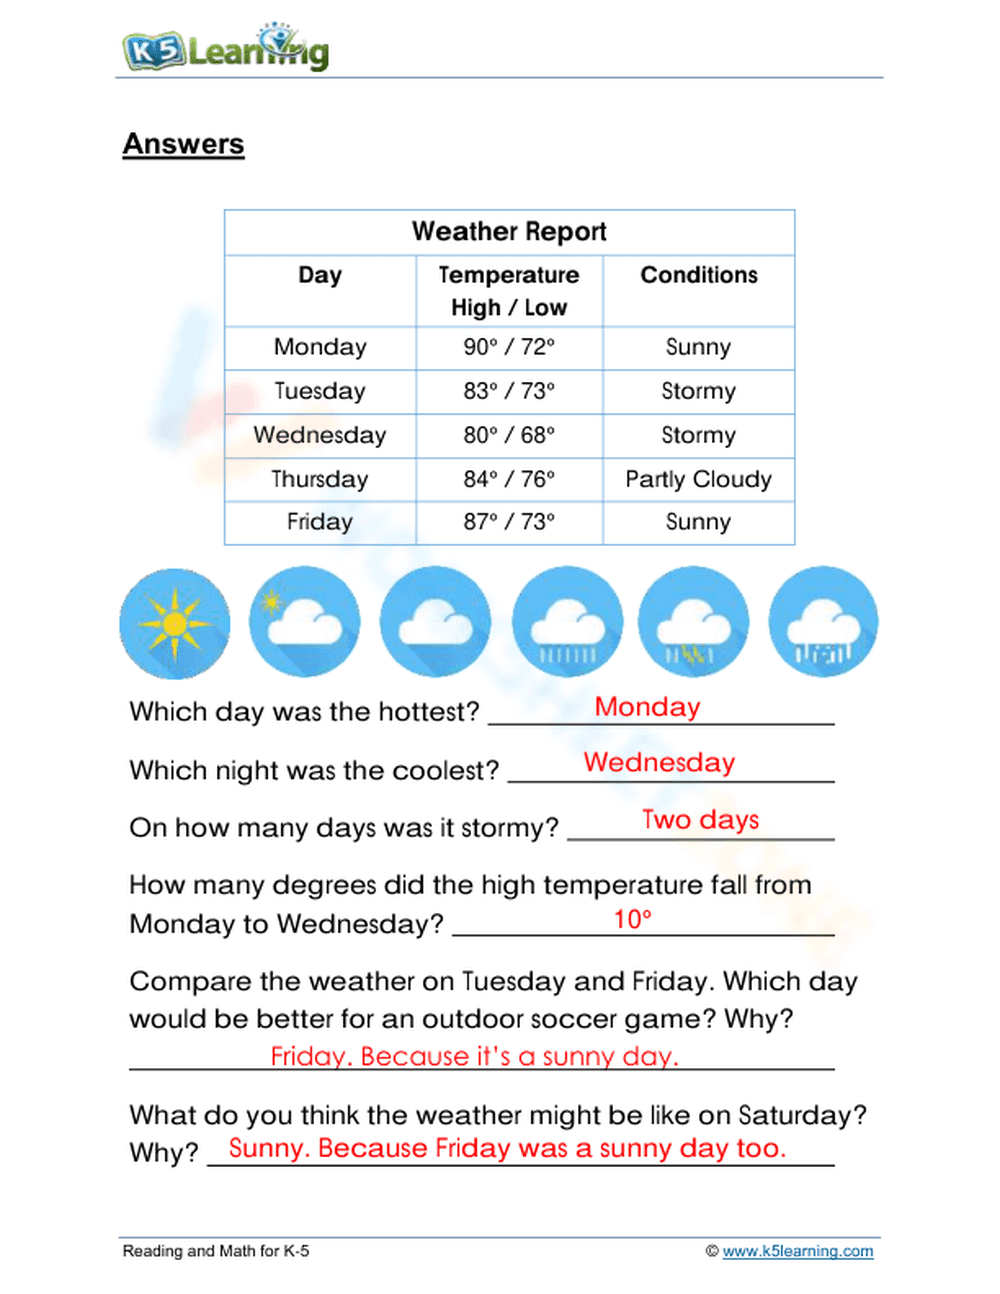
This two-page PDF includes a comprehensive worksheet and a matching answer key for immediate feedback. The central feature is a five-day "Weather Report" table documenting daily high/low temperatures and atmospheric conditions like sunny, stormy, and partly cloudy. The six practice problems include literal comprehension, subtraction for temperature change, and inference-based prediction tasks.
Zero-Prep Workflow
1. Print the document for your entire class (30 seconds). 2. Distribute the worksheet as a bell-ringer or supplemental science activity (1 minute). 3. Review the completed work using the provided answer key during a whole-group discussion (5 minutes). This zero-prep workflow makes it an ideal resource for emergency sub-plans, ensuring that total teacher preparation time remains under two minutes.
Standards Alignment
This resource is explicitly aligned to 3-ESS2-1, which requires students to represent data in tables and graphical displays to describe typical weather conditions expected during a particular season. The tasks prompt students to analyze ranges and identify trends within a localized dataset. Both standard codes can be copied directly into lesson plans, IEP goals, or district curriculum mapping tools.
How to Use It
Assign this worksheet during the "Explain" or "Elaborate" phase of a 5E science unit on weather and climate. It serves as an excellent formative assessment to observe if students can differentiate between numerical temperature data and categorical weather conditions. Expect most third graders to complete the data extraction and analysis within a 20-minute instructional block.
Who It's For
This activity is designed for Grade 3 students but provides valuable review for Grade 4 learners or scaffolded support for English Language Learners (ELLs) through its visual weather icons. It pairs naturally with a classroom weather station or an anchor chart describing temperature scales to reinforce real-world measurement applications.
According to the RAND AIRS 2024 report, the ability to interpret tabular data is a foundational predictor of future STEM success in middle school environments. This Grade 3 worksheet targets the 3-ESS2-1 standard by requiring students to move beyond simple observation into data-driven inference. Fisher & Frey (2014) emphasize that structured practice with domain-specific tables, like this weather report, allows students to build the cognitive scaffolds necessary for complex scientific reasoning. By identifying the "hottest" day or calculating temperature drops, students engage in the exact cross-cutting concepts of "Patterns" and "Scale, Proportion, and Quantity" prioritized by the NGSS framework. This resource provides the necessary repetition to ensure that the plain-English skill of data analysis becomes a permanent part of the student's scientific toolkit.