


Views
Downloads


Printable Bar Graph Worksheet | Grades 9-12 Math
Paste this activity's link or code into your existing LMS (Google Classroom, Canvas, Teams, Schoology, Moodle, etc.).
Students can open and work on the activity right away, with no student login required.
You'll still be able to track student progress and results from your teacher account.
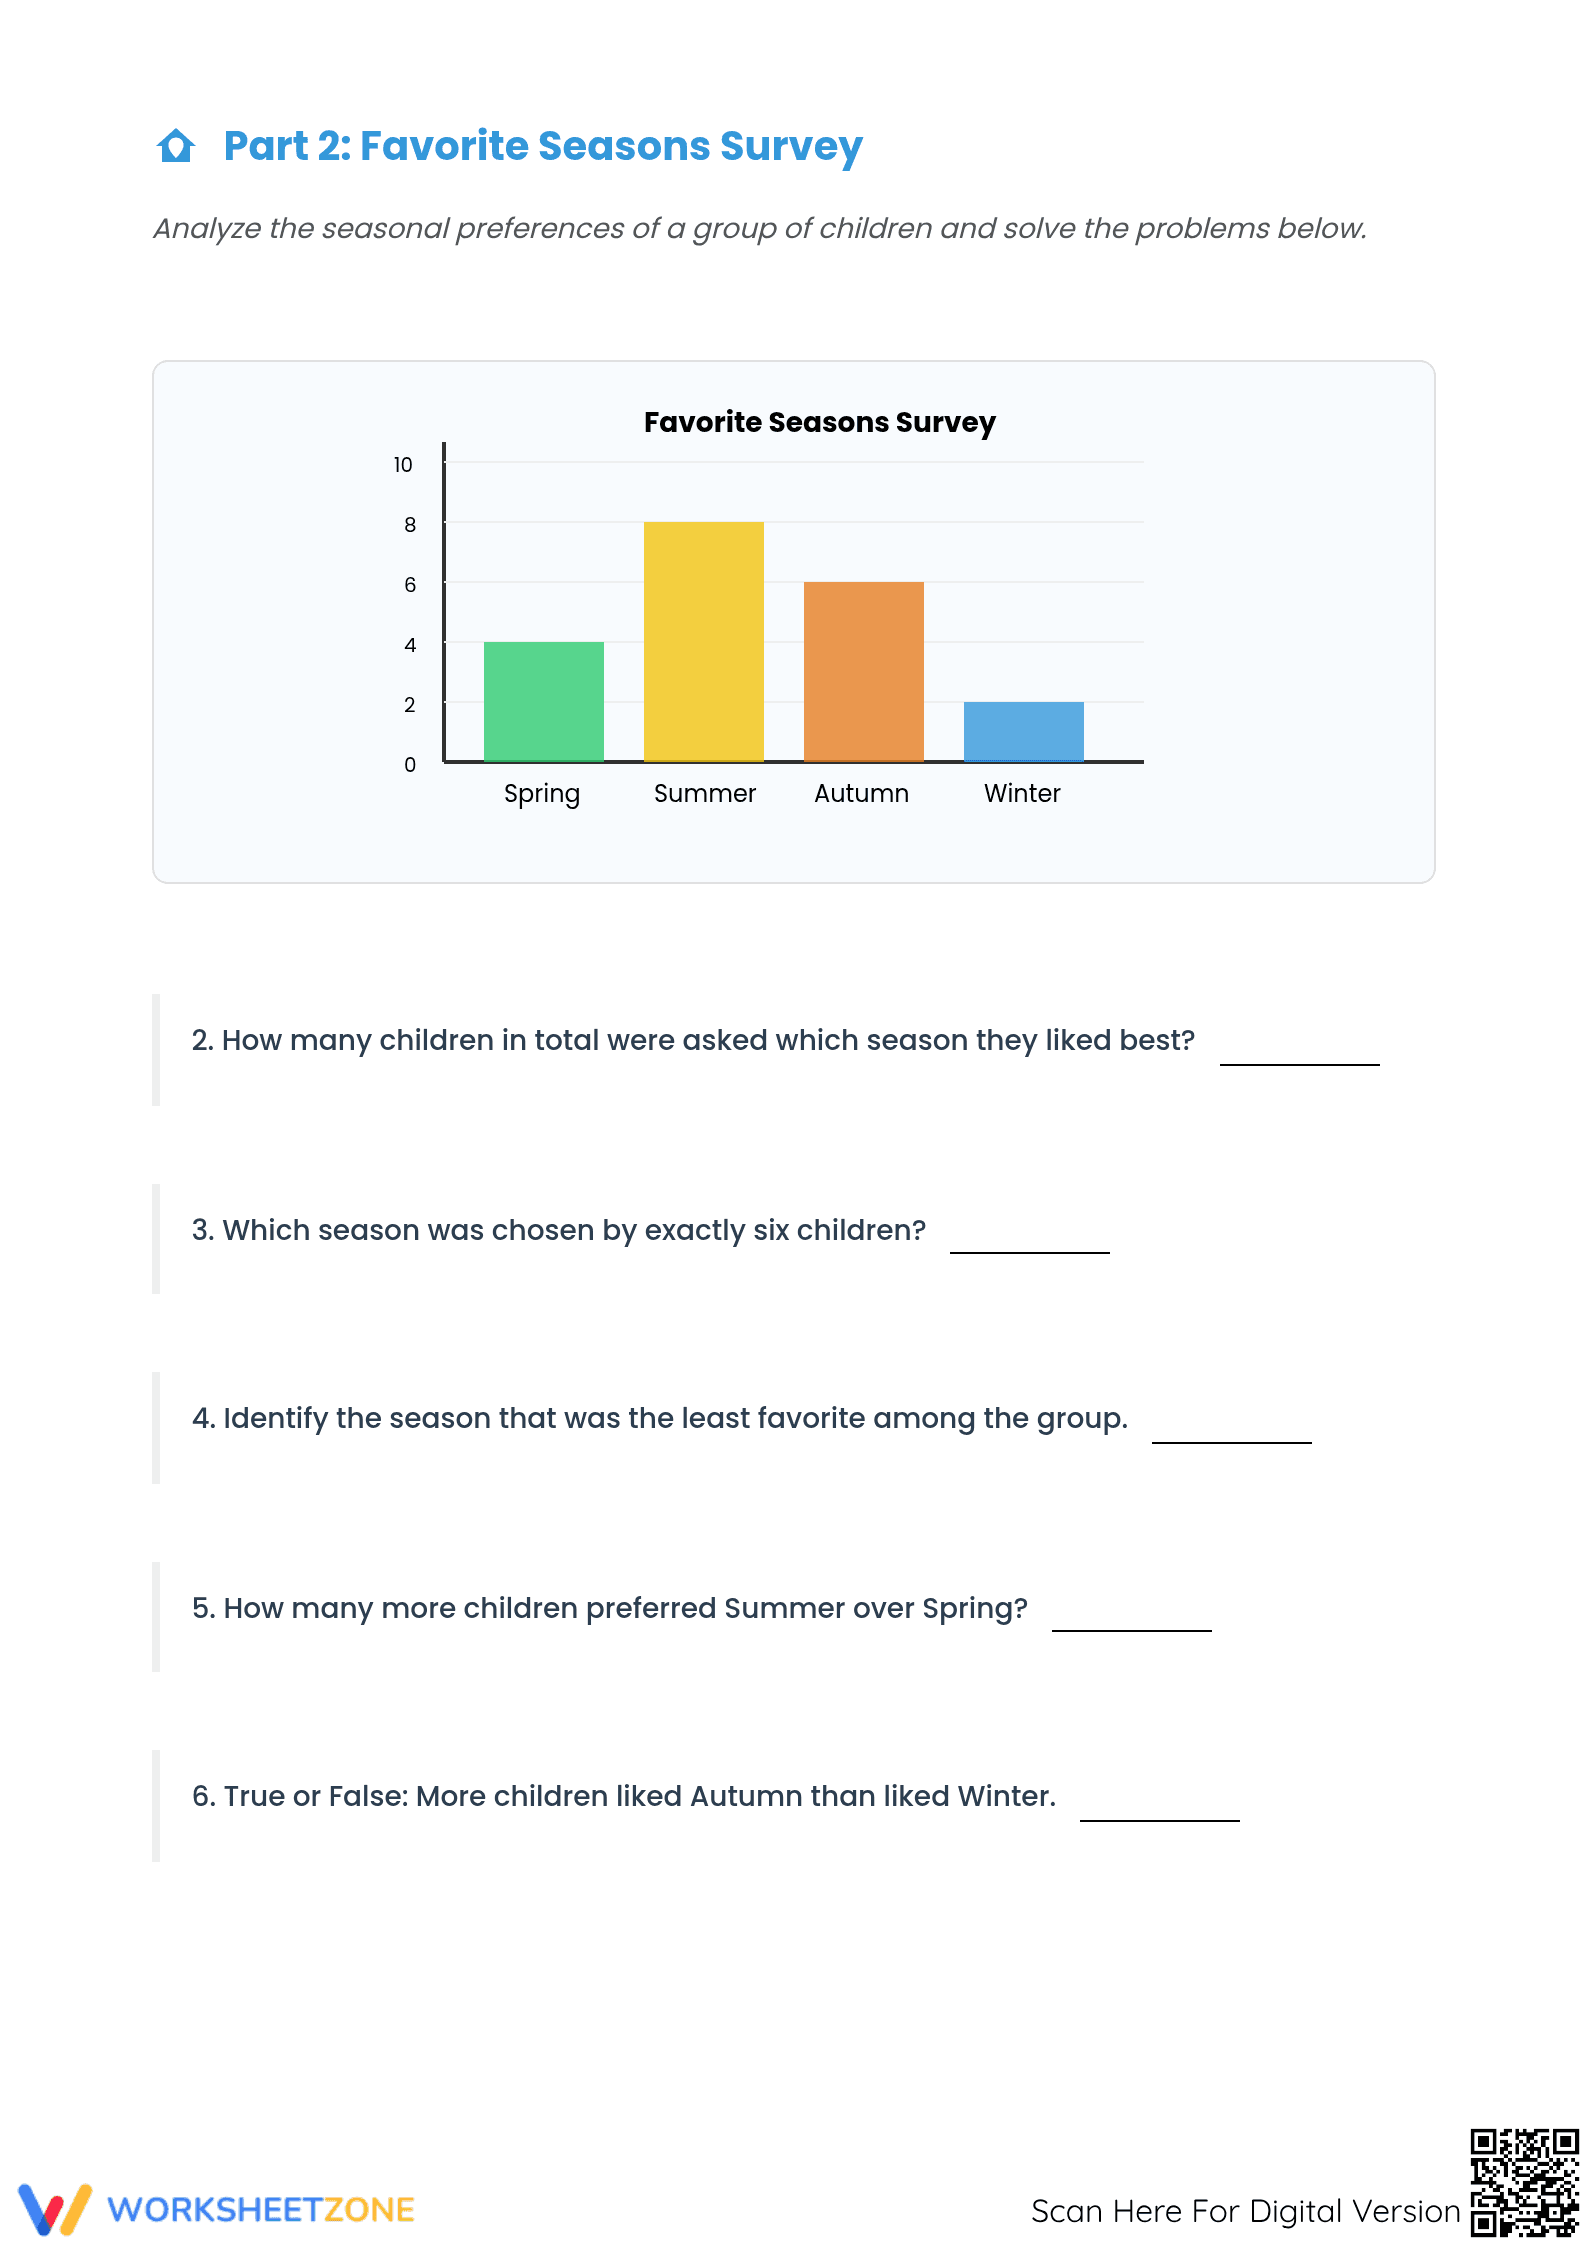
This worksheet offers essential practice for high school students in reading bar graphs. Students will answer 38 targeted questions based on eight different graphs, strengthening their ability to analyze data and draw simple conclusions. It’s a foundational tool for building data literacy skills in a clear, repetitive format.
At a Glance
- Grade: 9–12 · Subject: Math, Graphing
- Standard:
CCSS.MATH.CONTENT.6.SP.B.5— Summarize numerical data sets in relation to their context.- Skill Focus: Reading and Interpreting Bar Graphs
- Format: 5 pages · 38 problems · Answer key included · PDF
- Best For: Foundational practice, skill reinforcement, sub plans.
- Time: 25–40 minutes
What's Inside
This resource is a five-page PDF, including four student worksheets and a full answer key. The worksheets feature eight distinct bar graphs, each paired with 4-5 comprehension questions. The problems are self-explanatory, requiring students to locate data, compare values, and perform simple calculations, making for an easy-to-implement activity.
Skill Progression
This worksheet focuses on consistent practice to build fluency in data interpretation through varied contexts.
- Guided Practice: The first page serves as a warm-up, with straightforward graphs and questions that guide students to find values directly from the chart.
- Supported Practice: Subsequent pages present graphs that require students to make comparisons or simple calculations (e.g., "How many more...").
- Independent Practice: By the final page, students apply their skills to new graphs, demonstrating their ability to independently analyze a standard bar graph and answer related questions.
This approach provides the repetition needed to master the skill.
Standards Alignment
This worksheet aligns with the foundational skills for data analysis in the Common Core State Standards. The primary standard addressed is CCSS.MATH.CONTENT.6.SP.B.5, which involves summarizing data sets in context. Answering questions about the graphs is a core practice of data summarization. It also supports high school standard CCSS.MATH.CONTENT.HSS-ID.A.1 by building the graphical literacy to interpret data plots. These standard codes can be copied into lesson plans or curriculum maps.
How to Use It
Use this resource for independent practice after a lesson on bar graphs. It also works as a formative assessment; observe where students struggle to identify misconceptions about reading scaled axes. For a quick activity, assign two pages. For a full session, students can complete all four. It is also an excellent no-prep resource for a substitute teacher's lesson plan.
Who It's For
Designed for high school students (Grades 9-12) needing targeted practice on foundational data skills, this worksheet is ideal for English Language Learners or those with learning gaps. The clear visuals support student confidence. It pairs well with an introductory lesson on graph types or an anchor chart defining key terms.
Developing proficiency in interpreting graphical data is a critical component of quantitative reasoning. This worksheet provides focused practice aligned with CCSS.MATH.CONTENT.6.SP.B.5, where students summarize data in context. Research from Fisher & Frey (2014) emphasizes the importance of guided and independent practice in skill acquisition, a model this resource follows. By presenting students with 38 opportunities to read and analyze bar graphs, the worksheet helps build the graphical literacy that underpins more complex statistical analysis required in high school and beyond. A report by the RAND AIRS (2024) noted that repeated exposure to data representations is key for students, especially those with learning gaps, to build fluency and confidence. This resource offers a direct, effective method for providing that essential practice, making abstract data concrete and accessible through clear visual representation and targeted questioning.