


Views
Downloads
High School Bar Graphs — Printable No-Prep Worksheet
Paste this activity's link or code into your existing LMS (Google Classroom, Canvas, Teams, Schoology, Moodle, etc.).
Students can open and work on the activity right away, with no student login required.
You'll still be able to track student progress and results from your teacher account.
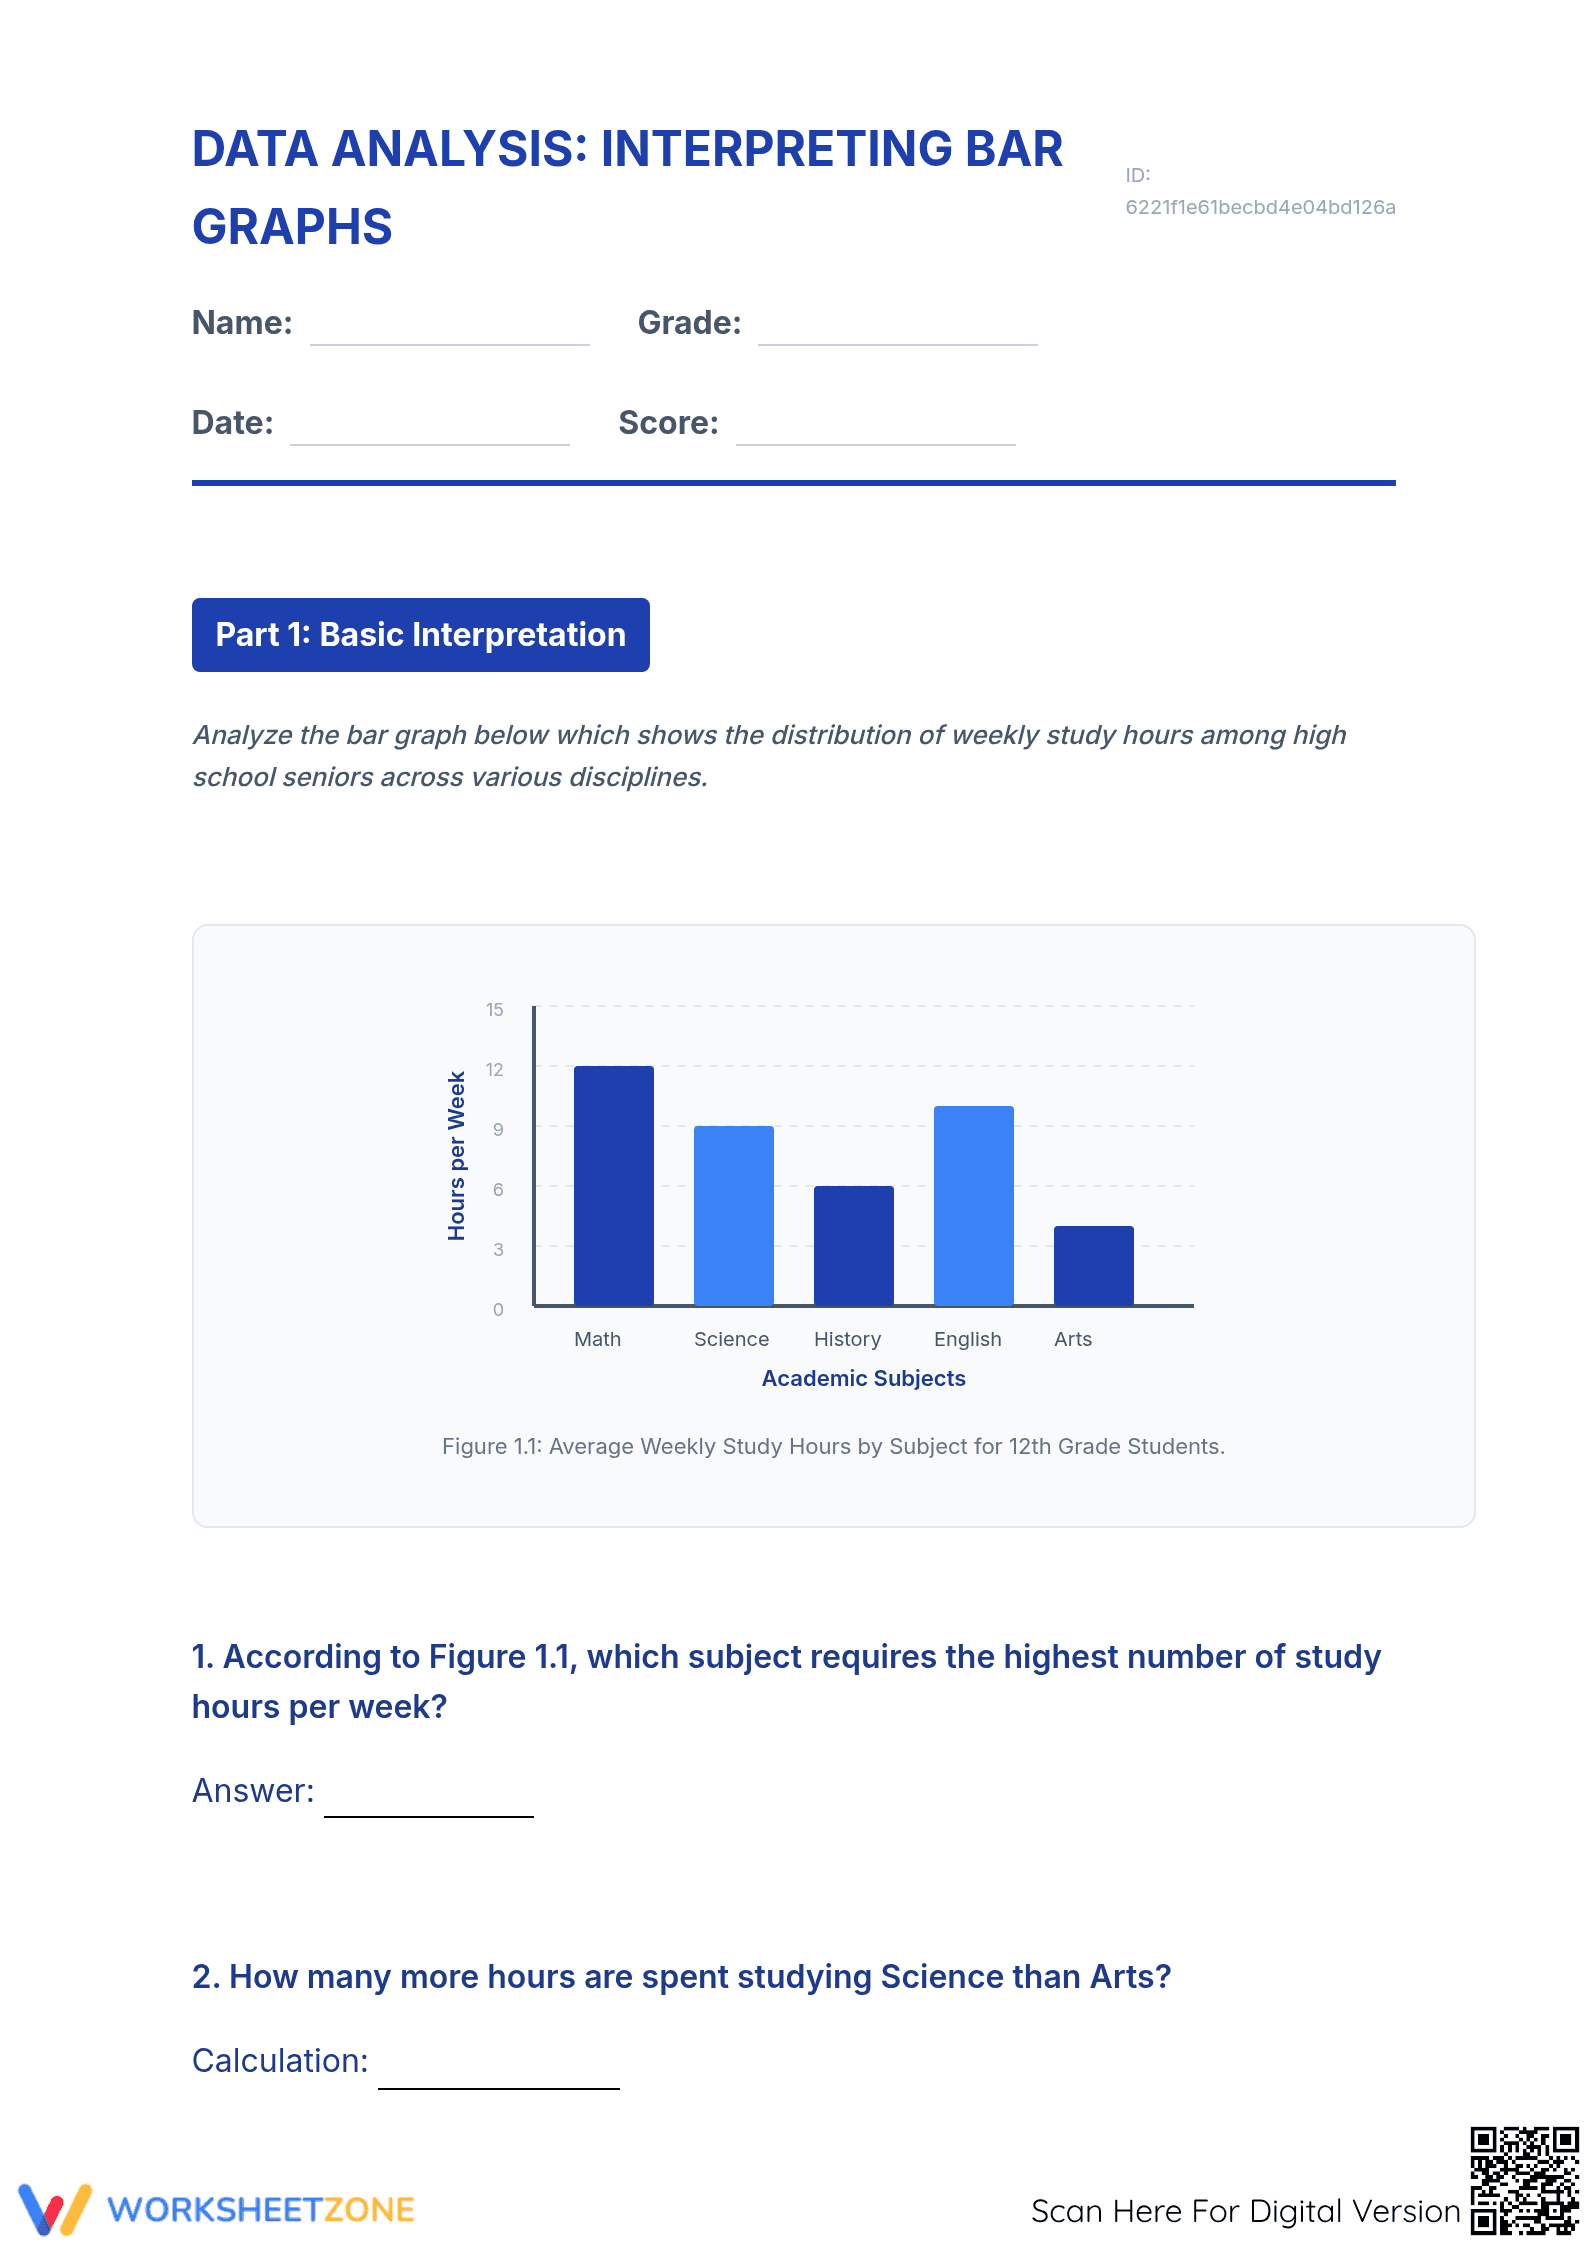
This worksheet offers targeted practice for high school students in reading and interpreting bar graphs. Through four distinct scenarios, students answer 20 questions requiring them to locate information and compare values from the data presented, reinforcing foundational data literacy skills.
At a Glance
- Grade: 9–12 · Subject: Math, Graphing
- Standard:
CCSS.MATH.CONTENT.HSS-ID.A.1— Summarize, represent, and interpret data on a single count or measurement variable.- Skill Focus: Reading and Interpreting Bar Graphs
- Format: 5 pages · 20 problems · Answer key included · PDF
- Best For: Foundational data skills practice
- Time: 20–30 minutes
What's Inside
This resource is a five-page PDF containing four student-facing worksheet pages and a complete answer key. The worksheet presents four bar graphs, each with five comprehension questions. The clear layout and focused tasks require no additional materials, making it a self-contained activity.
Zero-Prep Workflow
This worksheet is designed for maximum efficiency, with a workflow taking minutes to implement.
- Print (1 minute): The five-page PDF is ready to print.
- Distribute (1 minute): Hand out the four worksheet pages to students.
- Review (10 minutes): Use the single-page answer key for class review or student self-correction.
With a total prep time under two minutes, this resource is ideal for warm-ups, homework, or an emergency sub plan.
Standards Alignment
This worksheet aligns with the foundational skills of Common Core standard CCSS.MATH.CONTENT.HSS-ID.A.1, which requires students to interpret data on a measurement variable. While the standard names other plots, this worksheet builds the essential prerequisite skill of interpreting graphical data using bar graphs. The standard code can be copied directly into lesson plans, IEP goals, or district curriculum mapping tools.
How to Use It
This versatile worksheet can be used at multiple points in an instructional cycle. Use it as a pre-assessment to gauge data literacy skills before a statistics unit, or as an independent practice activity after direct instruction. For a formative assessment, circulate as students work, observing if they can correctly identify the axes, scale, and values for each category. Most students will complete the 20 questions in 20-30 minutes.
Who It's For
This resource is effective for high schoolers needing to build foundational data analysis skills, including English Language Learners or students with interrupted education. The clear format and direct questions lower the linguistic demand while focusing on the mathematical skill. Pair this with an anchor chart of graphing vocabulary (e.g., 'axis', 'scale') for extra support.
Foundational data literacy is a critical component of quantitative reasoning. This worksheet provides focused practice on interpreting graphical data, a skill aligned with CCSS.MATH.CONTENT.HSS-ID.A.1. For students to evaluate reports based on data, they must first be able to accurately extract information from visualizations like bar graphs. Research from Fisher & Frey (2014) emphasizes the importance of purposeful tasks in building students' abilities to work with informational texts, including graphs. By providing 20 discrete-answer questions, this resource gives students the structured repetition needed to build confidence and accuracy in their data interpretation skills. It serves as an essential scaffold for more complex statistical analysis, ensuring students have the base skills necessary for success.