


Views
Downloads
Pedigree Analysis Worksheet Key | Essential Biology Practice
Paste this activity's link or code into your existing LMS (Google Classroom, Canvas, Teams, Schoology, Moodle, etc.).
Students can open and work on the activity right away, with no student login required.
You'll still be able to track student progress and results from your teacher account.
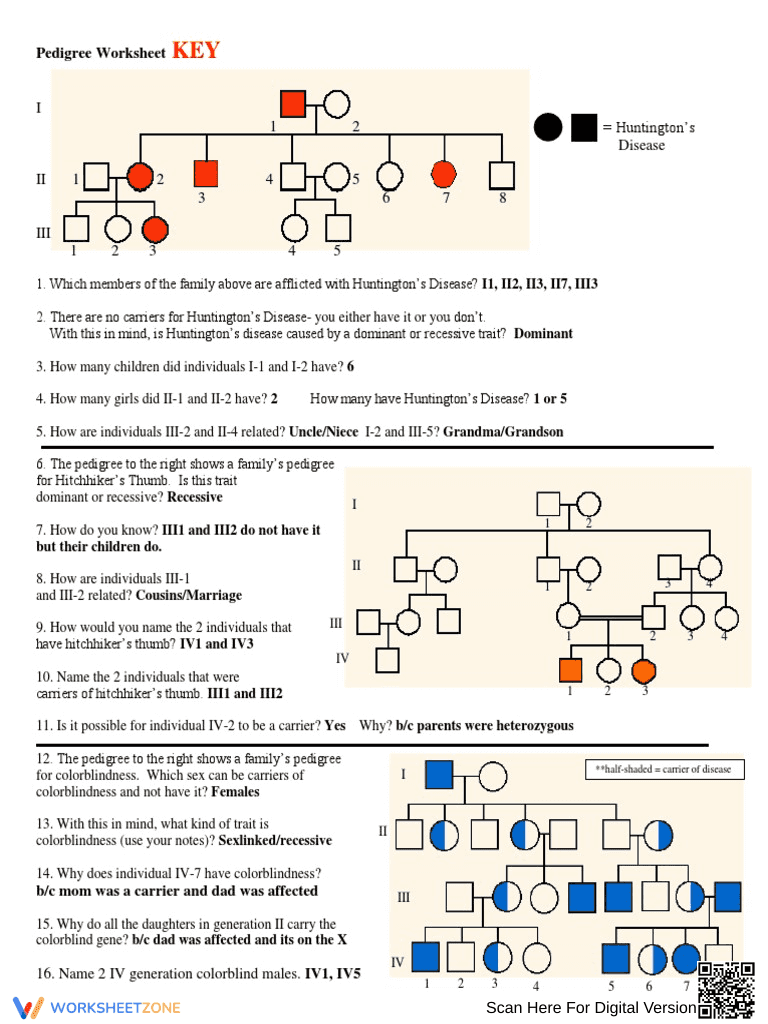
This comprehensive pedigree analysis worksheet provides students with 16 targeted problems to master genetic inheritance patterns. By examining three distinct family trees—Huntington’s disease, hitchhiker’s thumb, and colorblindness—learners identify genotypes and phenotypes while determining if traits are dominant, recessive, or sex-linked. It serves as a complete instructional tool for biology classrooms.
At a Glance
- Grade: 9–12 · Subject: Biology
- Standard:
HS-LS3-3— Apply probability and statistics to explain trait variation and distribution in populations- Skill Focus: Pedigree Chart Analysis
- Format: 1 page · 16 problems · Answer key included · PDF
- Best For: Formative assessment or sub plan resource
- Time: 20–30 minutes
The resource features three separate pedigree diagrams of increasing complexity. It includes 16 specific questions that require students to trace lineage, identify carriers, and justify inheritance modes using evidence from the charts. The single-page layout is optimized for clarity, featuring a clear key for symbols and shaded regions to represent affected individuals and carriers.
This worksheet is designed for immediate classroom implementation with a total teacher prep time of under 2 minutes. Simply print the single-page PDF (30 seconds), distribute it to students for independent or partner work (30 seconds), and use the integrated answer key for rapid review or self-grading (1 minute). Its self-explanatory nature makes it an ideal emergency sub plan.
This resource aligns with HS-LS3-3, which requires students to apply concepts of statistics and probability to explain the variation and distribution of expressed traits. It also supports MS-LS3-2 by modeling how sexual reproduction results in genetic variation. Both standard codes can be copied directly into lesson plans, IEP goals, or district curriculum mapping tools.
Use this worksheet during the elaborate phase of a genetics unit after students have learned Punnett squares. It works effectively as a formative assessment to check for misconceptions regarding sex-linked traits versus autosomal dominance. Expect students to complete the 16 tasks within 25 minutes; observe if they can correctly identify the carrier status in the third pedigree.
This practice is tailored for high school biology students and advanced middle school life science learners. It provides necessary scaffolding for students struggling with visual data interpretation while offering enough complexity for honors-level learners. Pair this with a Punnett square anchor chart or a short reading on Mendelian genetics for a complete lesson.
According to the RAND AIRS 2024 report, high-quality visual models like pedigree charts are critical for developing scientific literacy and data interpretation skills in secondary students. This worksheet addresses HS-LS3-3 by requiring students to analyze 16 specific data points to determine the probability of trait inheritance. By moving from simple autosomal dominant traits to complex sex-linked recessive patterns, the resource mirrors the rigorous expectations found in EdReports 2024 science alignment frameworks. Research from Fisher & Frey (2014) emphasizes that gradual release through structured problem sets—like the three distinct pedigrees provided here—significantly improves student mastery of abstract biological concepts. This standalone resource ensures that students can accurately identify carriers and affected individuals, providing a measurable way to track progress toward state and national science standards in genetics and heredity.