


























Views
Downloads


Printable Mean Absolute Deviation Notes | Grade 6-8 Math
Paste this activity's link or code into your existing LMS (Google Classroom, Canvas, Teams, Schoology, Moodle, etc.).
Students can open and work on the activity right away, with no student login required.
You'll still be able to track student progress and results from your teacher account.
This comprehensive Grade 6–8 Mean Absolute Deviation worksheet guides students through calculating and interpreting MAD. Students define statistical terms, apply a clear four-step algorithm, and measure variability in real-world data. It effectively bridges basic arithmetic and sophisticated statistical analysis.
At a Glance
- Grade: 6–8 · Subject: Math
- Standard:
CCSS.MATH.CONTENT.6.SP.B.5.C— Summarizes numerical data sets, including MAD.- Skill Focus: Computational and conceptual Mean Absolute Deviation (MAD) Mastery
- Format: 5 pages · 10 tasks · Answer key included · PDF
- Best For: First-time instruction, remediation, and guided classroom practice
- Time: 45–60 minutes
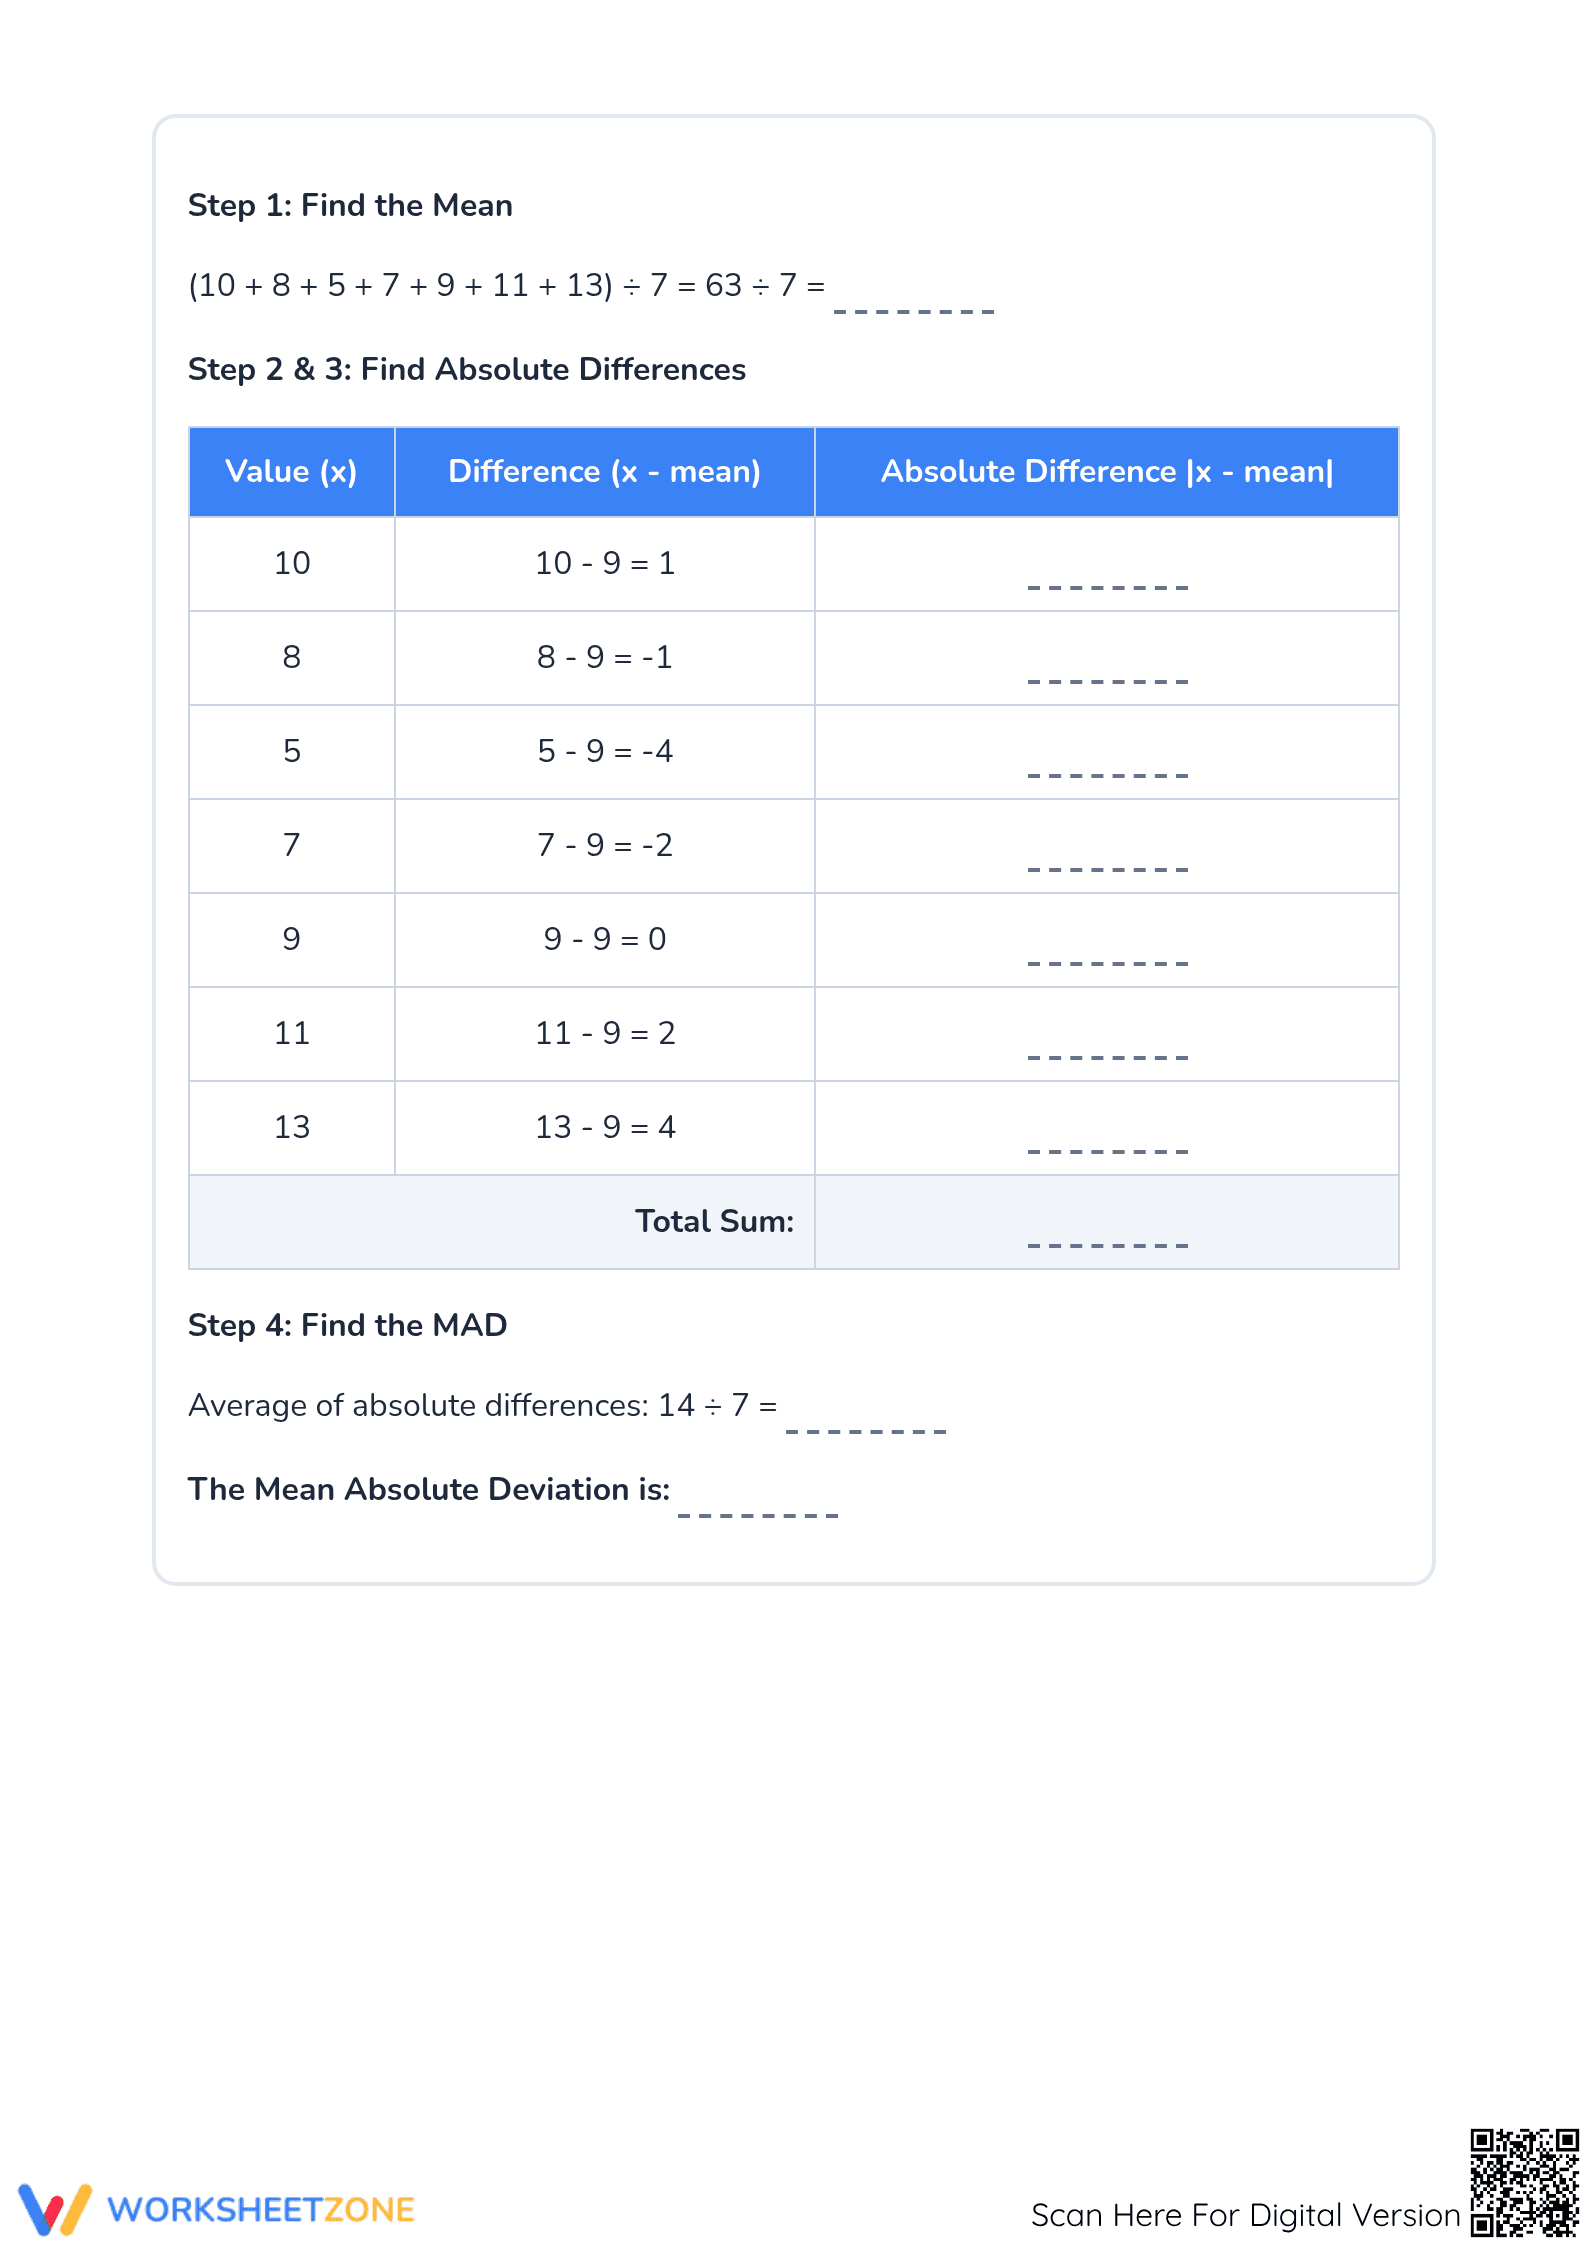
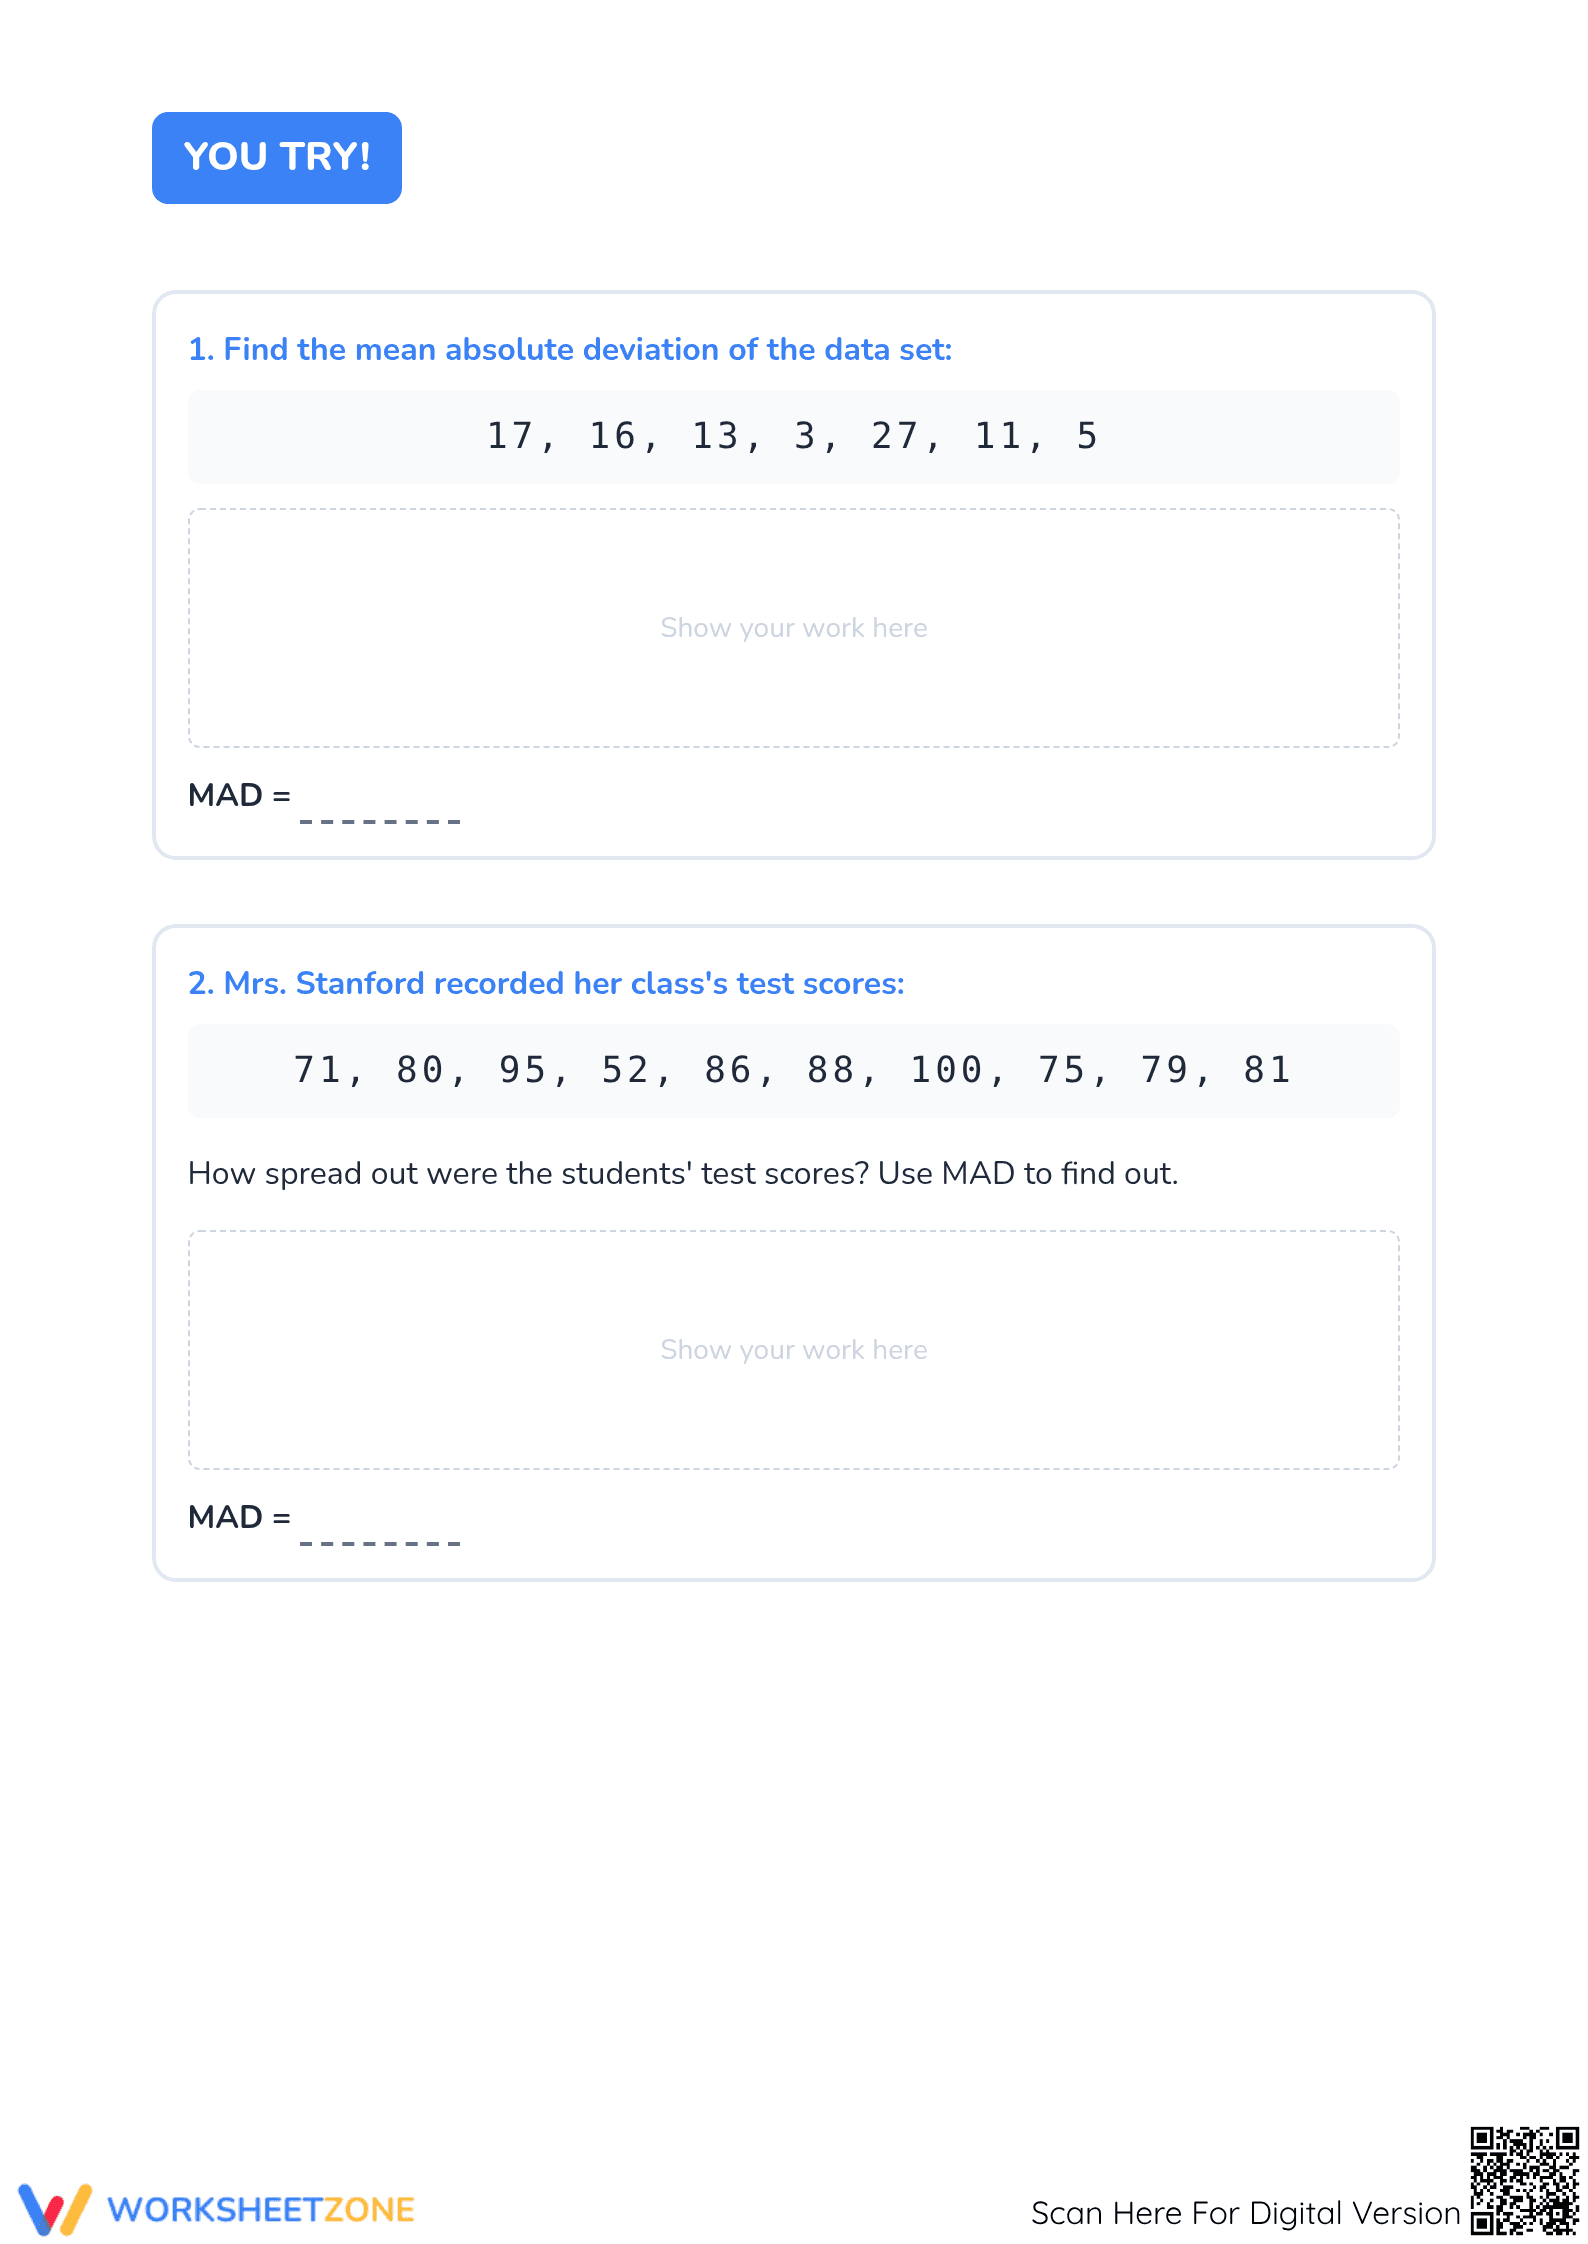
This 5-page packet includes scaffolded fill-in-the-blank definitions, a clear four-step process for finding MAD, and a detailed worked example table to organize student thinking. The practice section offers two structured problems, plus conceptual reflection questions to ensure depth of knowledge. A full answer key is included for immediate feedback and easy grading.
Skill Progression
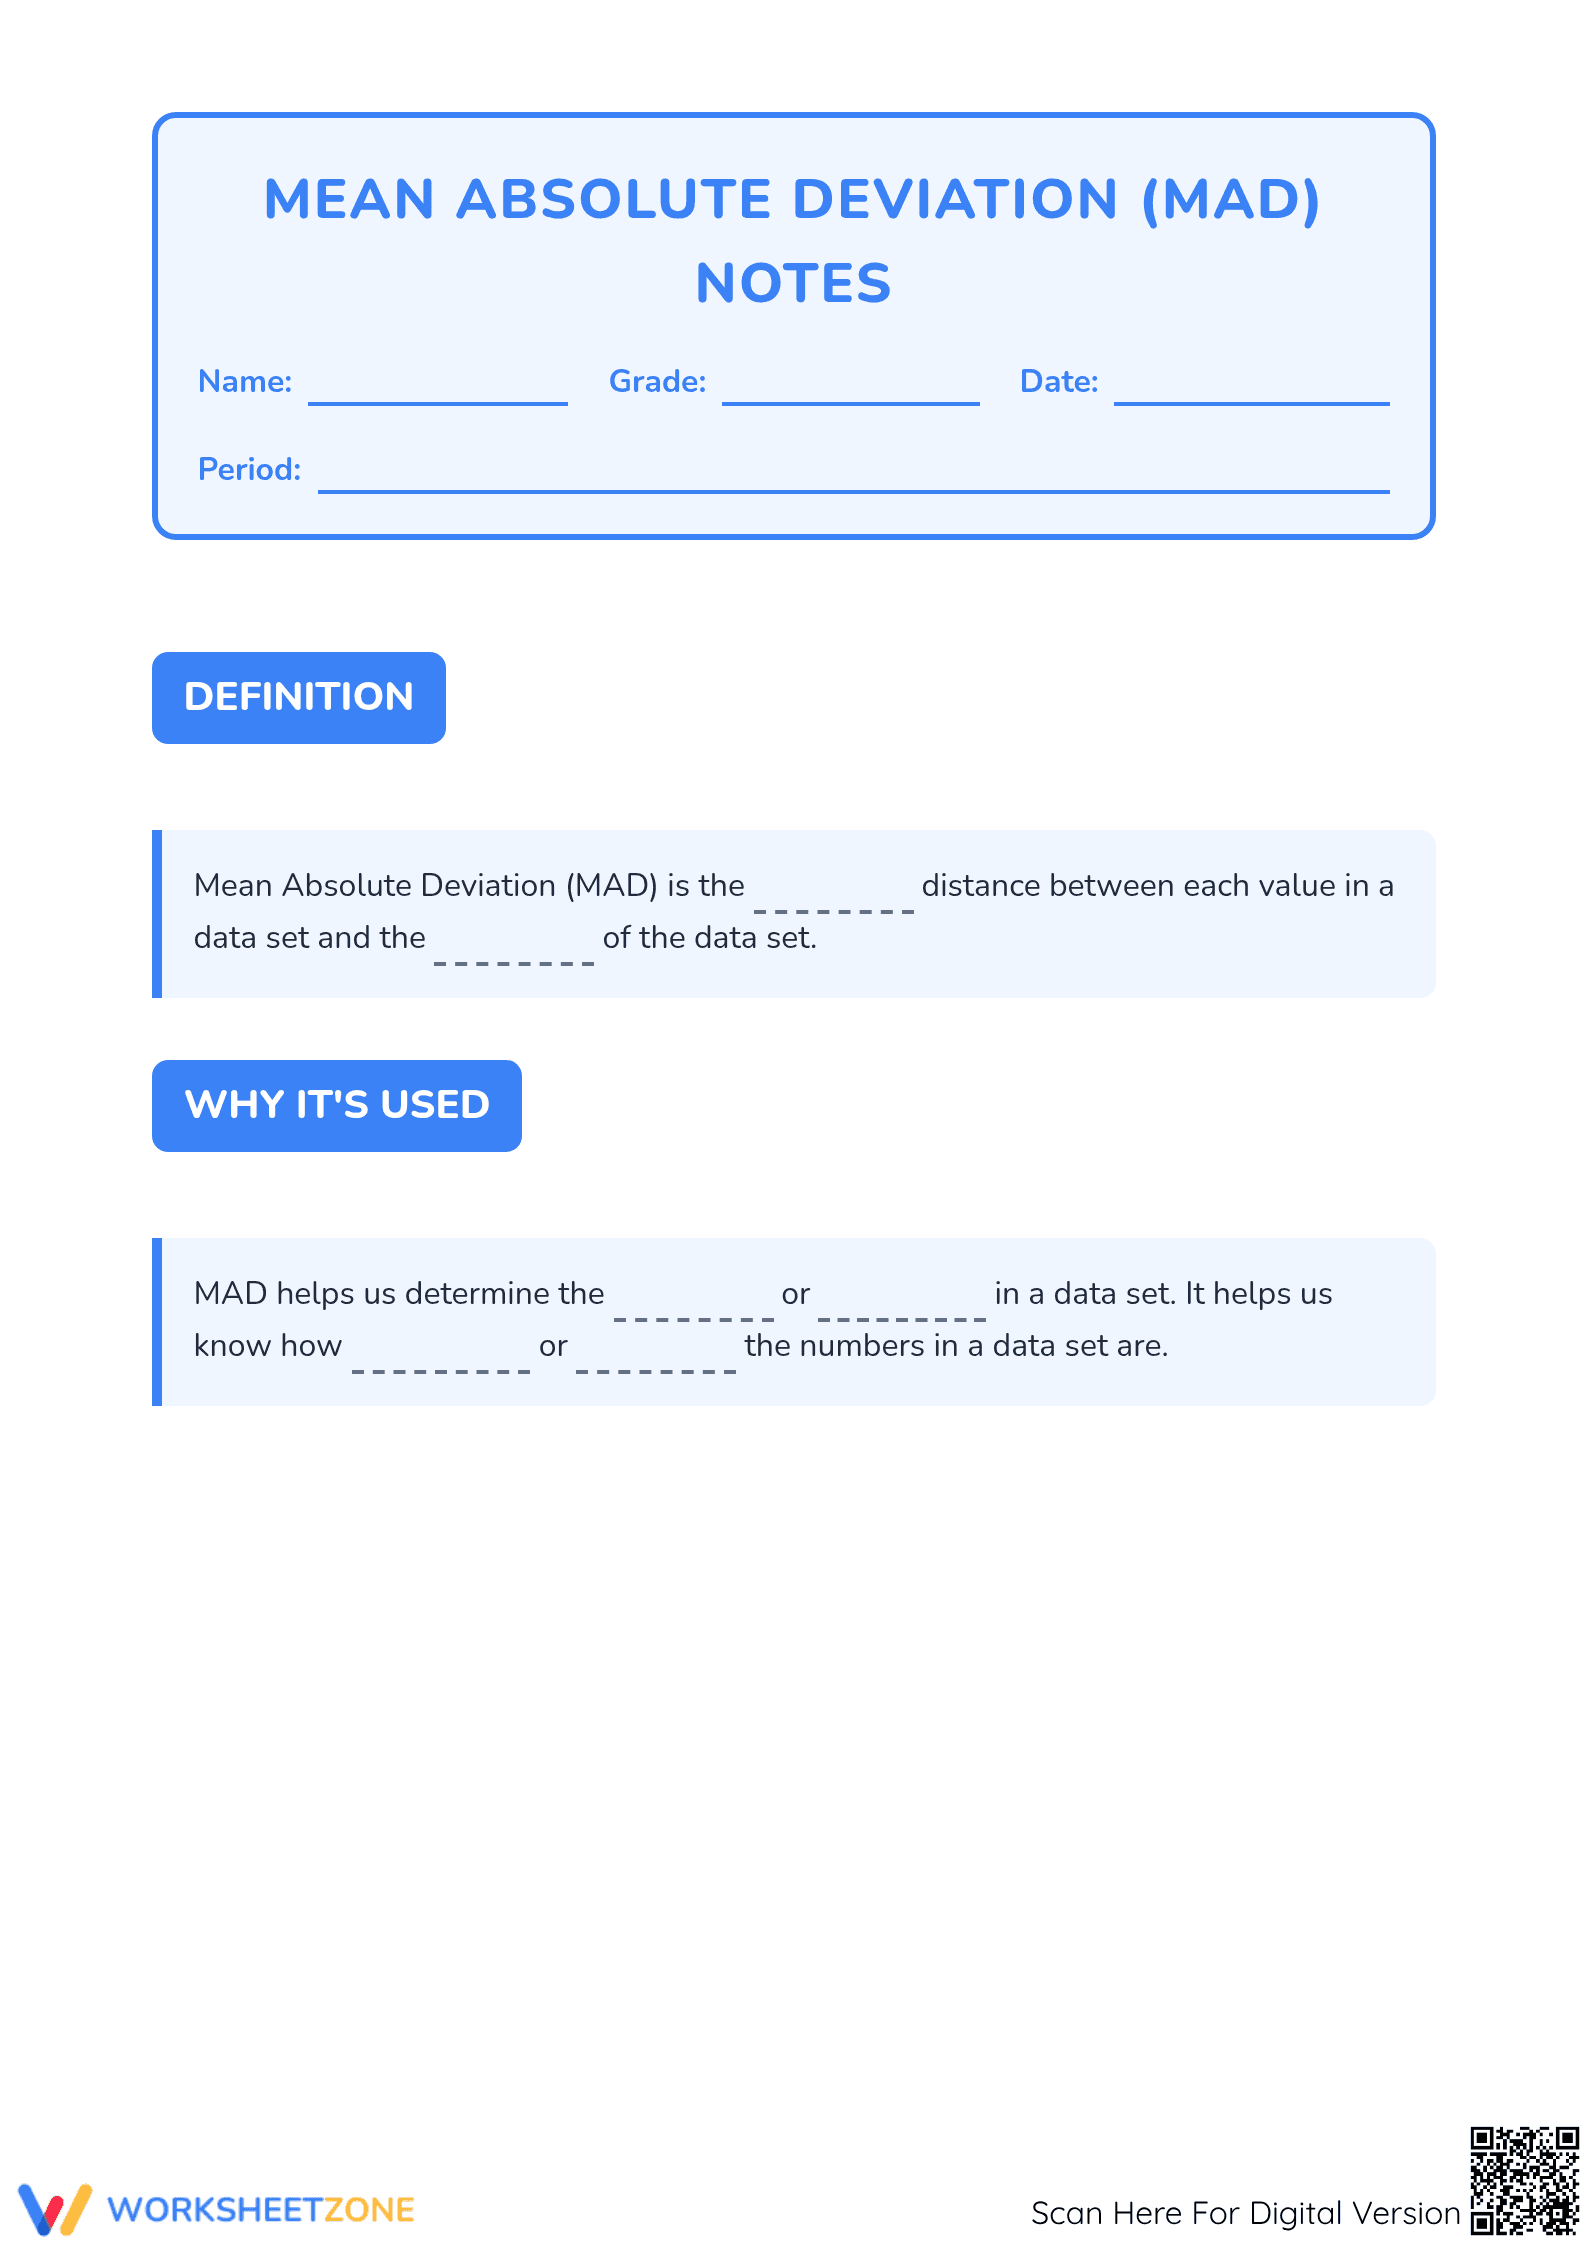
- Guided Practice: Students define MAD as the average distance from the mean, ensuring conceptual understanding before calculations.
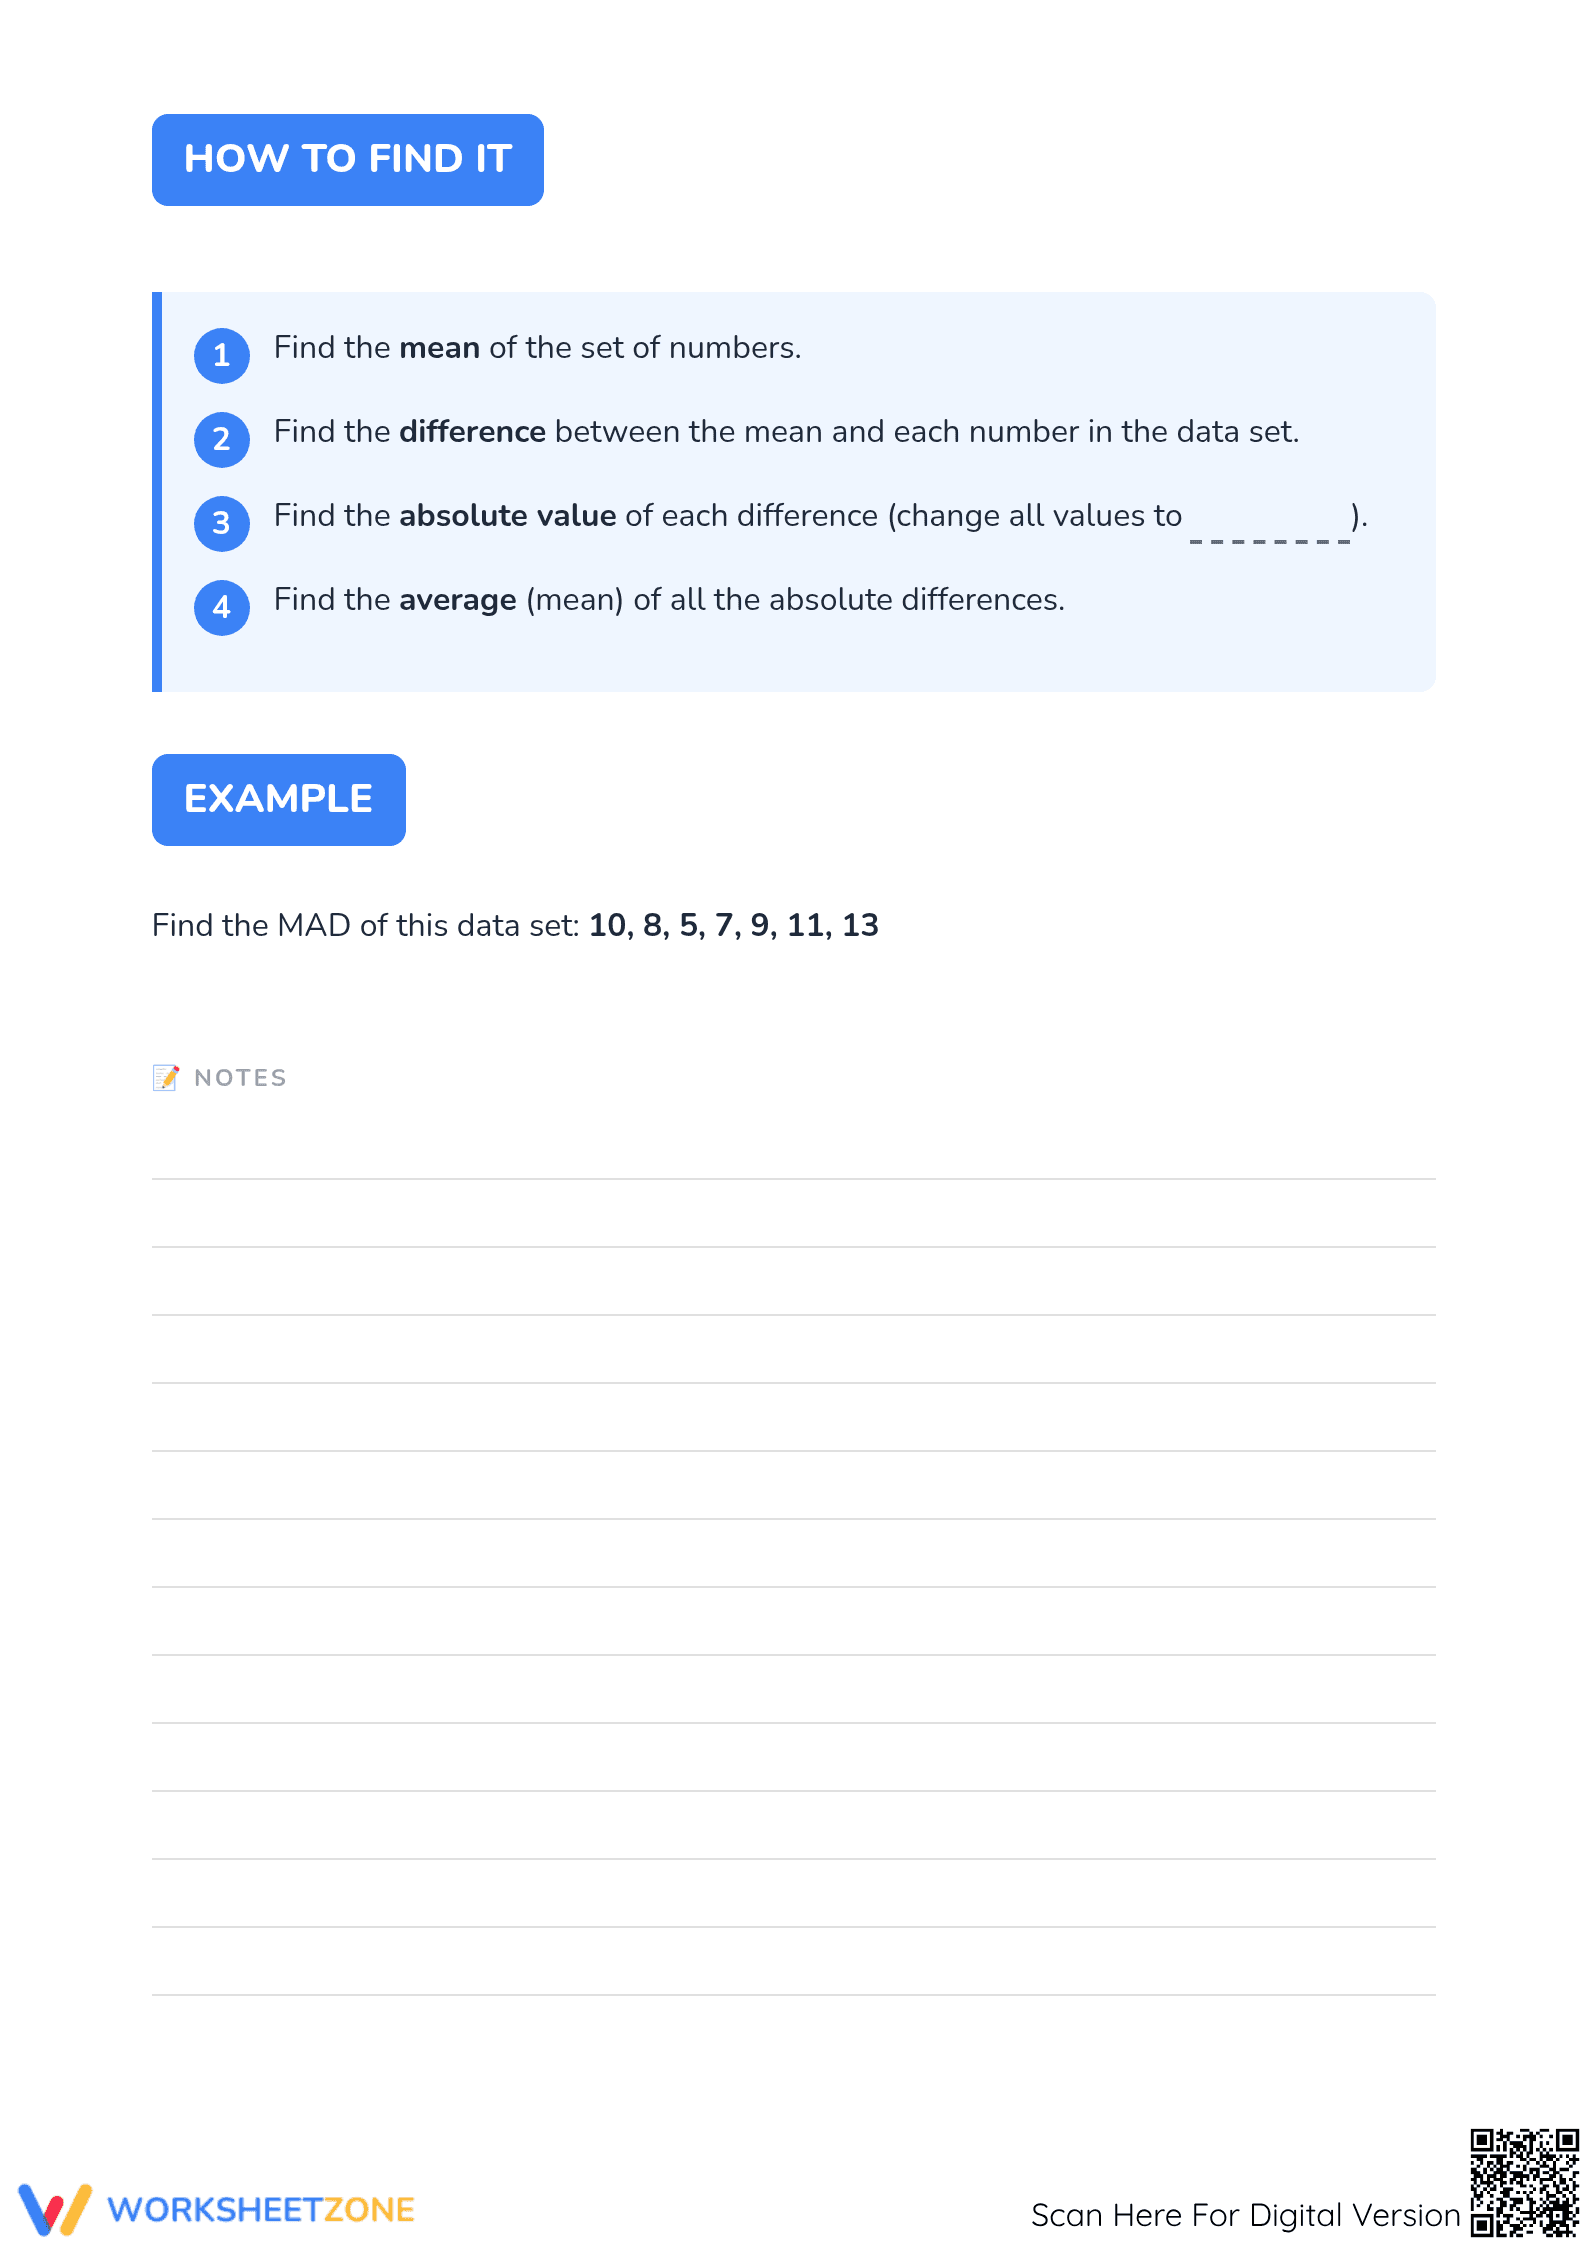
- Supported Practice: A pre-formatted table guides students through the seven-step MAD algorithm, reducing cognitive load.
- Independent Practice: Two multi-step problems and reflection questions require students to interpret deviation magnitude in context.
By utilizing this gradual-release model, students build computational accuracy and the confidence needed to handle complex statistical data.
Standards Alignment
Primary alignment is CCSS.MATH.CONTENT.6.SP.B.5.C: “Giving quantitative measures of center (median and/or mean) and variability (interquartile range and/or mean absolute deviation), as well as describing any overall pattern and any striking deviations.” This standard code can be copied directly into lesson plans, IEP goals, or district curriculum mapping tools to ensure instructional compliance.
How to Use It
Use this resource during the direct instruction phase of a statistics unit. Have students complete the fill-in-the-blank definitions as you explain the concept of variability. Use the worked example on page 3 as a “we do” activity before assigning the practice problems on page 4. As a formative assessment, review the responses to the “Think About It” section to ensure students grasp the relationship between MAD and data spread. Total completion time is roughly 50 minutes.
Who It's For
Designed for middle school learners in Grade 6, 7, or 8, this worksheet provides essential scaffolding for students who struggle with multi-step algorithms. It is particularly effective for small group intervention or as a supplemental resource for students needing more structured practice. This packet pairs naturally with data-gathering activities or direct instruction lessons on statistical variability in sports or science.
Statistical literacy requires quantifying variability in numerical data. Aligned with CCSS.MATH.CONTENT.6.SP.B.5.C, this worksheet emphasizes both procedural fluency and conceptual understanding. Students calculate Mean Absolute Deviation (MAD) using a structured, four-step algorithm: find the mean, calculate differences, determine absolute values, and average results. This progression from definitions to multi-step problem solving develops a concrete grasp of MAD as the “typical” distance of data points from the center. This resource helps Grade 6–8 learners transition from basic mean calculations to sophisticated data consistency analysis, meeting state and national standards.


