


























Views
Downloads


Essential 8.11(B) Worksheet: Mean Absolute Deviation Aligned
Paste this activity's link or code into your existing LMS (Google Classroom, Canvas, Teams, Schoology, Moodle, etc.).
Students can open and work on the activity right away, with no student login required.
You'll still be able to track student progress and results from your teacher account.
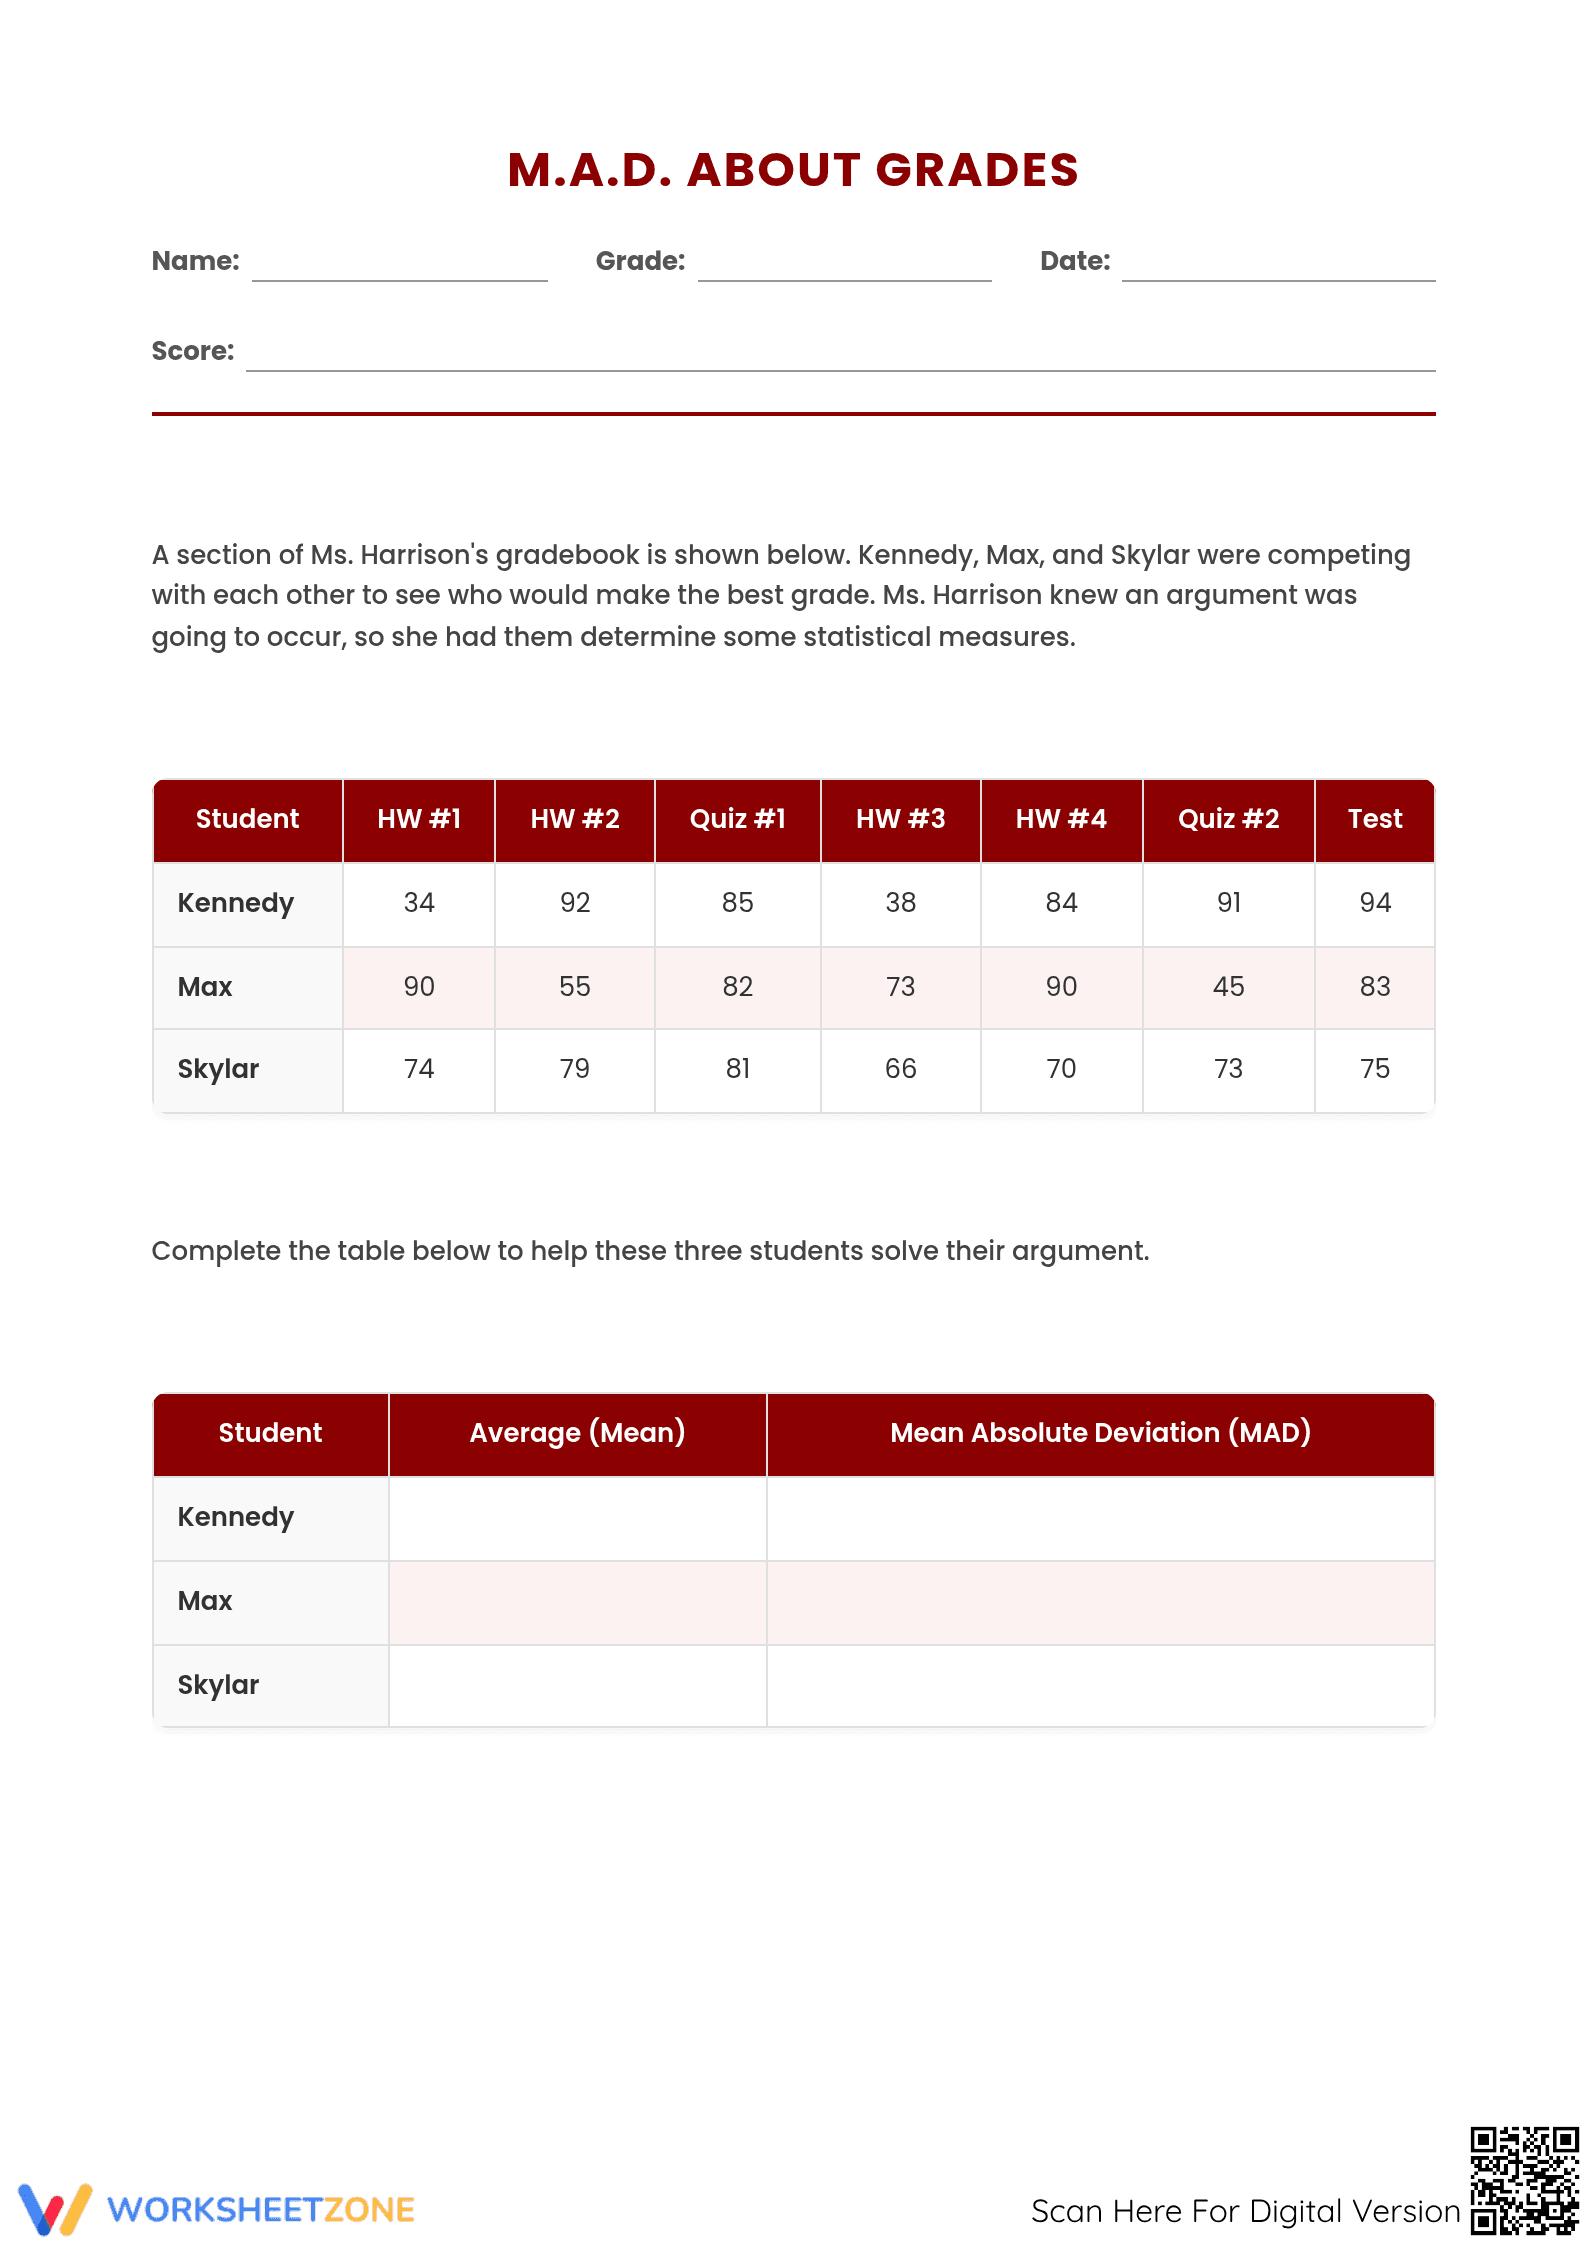
Students often struggle to visualize the spread of data beyond simple ranges. This Mean Absolute Deviation (MAD) worksheet provides a concrete, narrative-driven framework for Grade 8 learners to calculate and interpret variability. By analyzing real-world student grades, learners move from rote calculation to genuine statistical analysis, mastering the average distance from the mean.
At a Glance
- Grade: 8 · Subject: Math & Statistics
- Standard:
8.11(B)— Determine Mean Absolute Deviation to measure average distance data are from the mean- Skill Focus: Mean Absolute Deviation (MAD) & Variability
- Format: 3 pages · 10 tasks · Answer key included · PDF
- Best For: Formative assessment during introductory statistics units
- Time: 30–45 minutes
This three-page resource features a structured gradebook scenario involving three distinct student profiles. It includes a comprehensive calculation table for mean and MAD, five conceptual analysis questions exploring the implications of statistical variability, and a targeted application section with a secondary data set for Cindy. A full answer key ensures immediate feedback for both students and teachers.
Mastery Evidence
This worksheet provides evidence of mastery across multiple cognitive levels. Tasks 1-3 require students to calculate the mean and MAD, demonstrating procedural fluency. Questions 4-6 require learners to argue how changes in data points shift variability, aligning with the Meeting tier of the standard. Finally, the critical thinking challenges require students to reverse-engineer data sets, providing evidence for the Exceeding mastery tier.
Standards Alignment
This resource is explicitly aligned to the Texas standard 8.11(B): "Determine the Mean Absolute Deviation and use this quantity as a measure of the average distance data are from the mean using a data set of no more than 10 data points." It also supports CCSS statistics standards by requiring students to describe the nature of the attribute under investigation. These standard codes can be copied directly into lesson plans, IEP goals, or district curriculum mapping tools.
How to Use It
Use this as a formative assessment during your statistics unit. After introducing the concept of variability, assign the first page as a collaborative activity where students calculate the measures for Kennedy, Max, and Skylar. Use the discussion questions on page two to identify misconceptions before assigning the final page as an independent check for understanding. Teachers should observe whether students can explain how an outlier affects the MAD.
Who It's For
This worksheet is designed for Grade 6-8 students engaged in introductory statistics or test preparation. The gradebook context makes it highly accessible for middle schoolers, while the open-ended questions provide necessary challenge for accelerated learners. It pairs naturally with a data-set anchor chart or a direct instruction lesson on measures of center and spread.
The Mean Absolute Deviation (MAD) is a critical gateway to higher-level statistics, serving as the conceptual foundation for standard deviation. According to Fisher & Frey (2014), the gradual release of responsibility—moving from guided calculation to independent argumentation—is essential for internalizing abstract mathematical concepts like variability. Research published in the RAND AIRS 2024 report emphasizes that student performance in statistics improves significantly when tasks are embedded in relatable, real-world contexts like gradebook analysis. By requiring students to not only calculate 8.11(B) but also to justify their findings through written arguments, this worksheet strengthens the link between numerical data and conceptual meaning. This dual approach ensures that learners don't just find the MAD but understand its role as a measure of distance and spread. It is a robust tool for meeting rigorous state and national standards in statistical literacy, providing the precise evidence of learning required by modern pedagogical frameworks.


