


1 / 4
0
Views
0
Downloads
0.0
0
Save
0 Likes
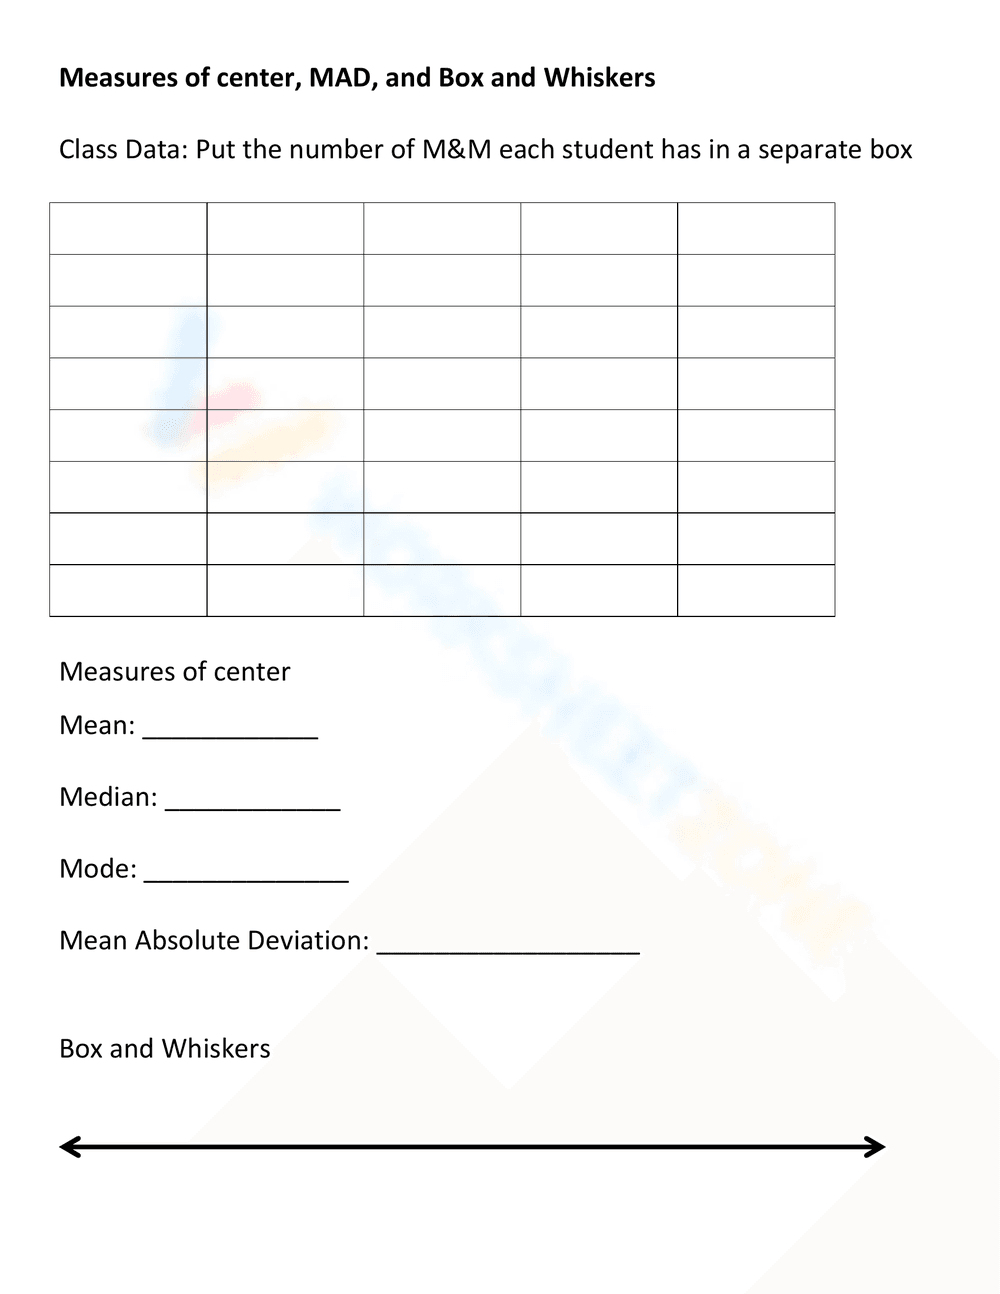
Mean Absolute Deviation: Review with M&Ms Worksheet
0 Views
0 Downloads
Paste this activity's link or code into your existing LMS (Google Classroom, Canvas, Teams, Schoology, Moodle, etc.).
Students can open and work on the activity right away, with no student login required.
You'll still be able to track student progress and results from your teacher account.
Information
Description
What It Is:
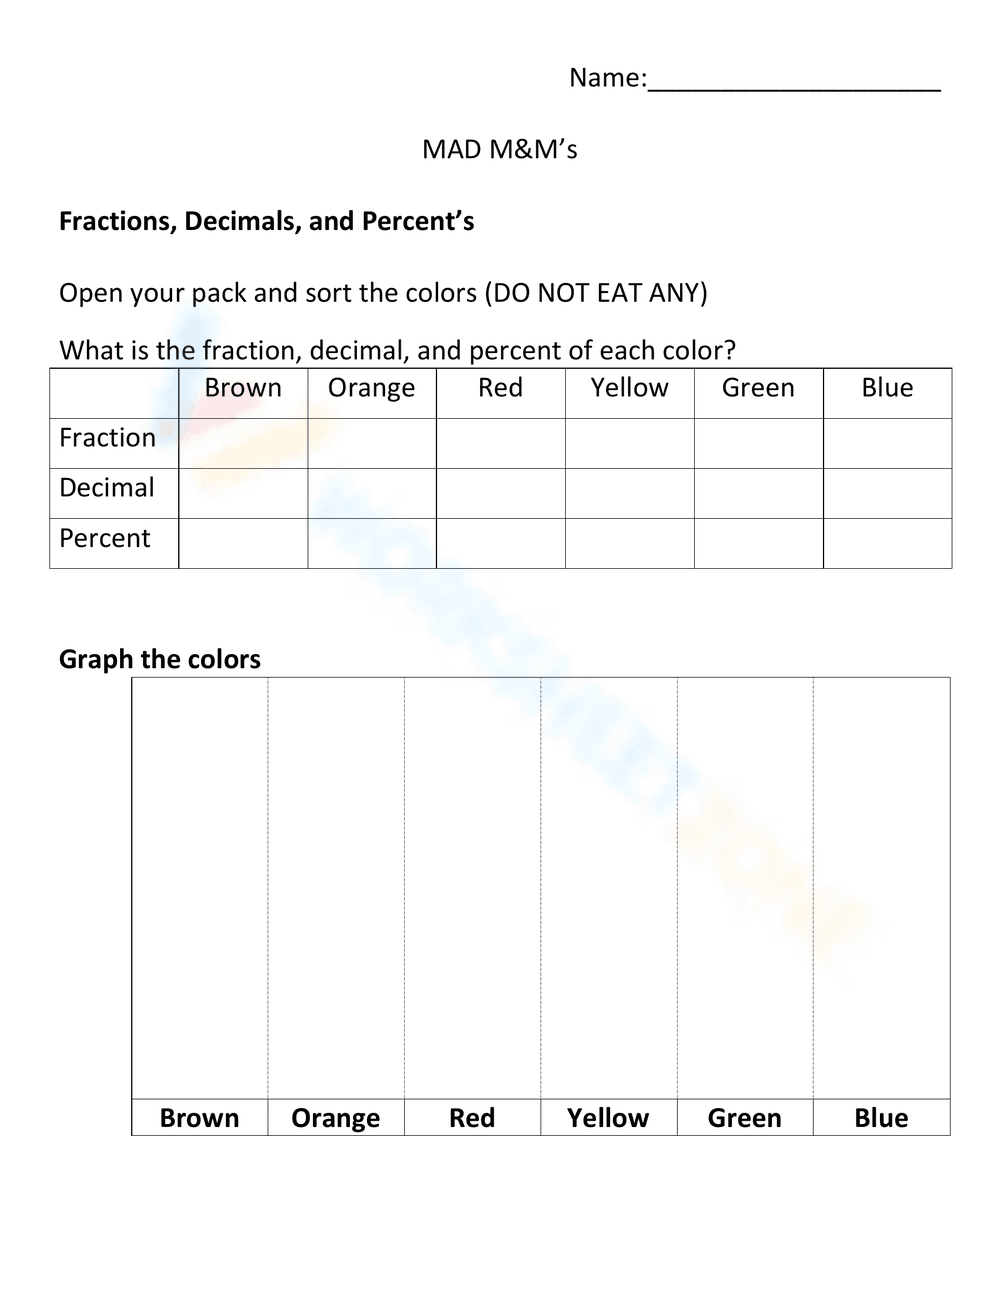
This is a math worksheet titled 'MAD M&M's' focusing on fractions, decimals, and percents. Students are instructed to sort M&M's by color (brown, orange, red, yellow, green, and blue) and then determine the fraction, decimal, and percent representation of each color. A bar graph is provided to visually represent the data.
Grade Level Suitability:
This worksheet is suitable for grades 4-6. It requires students to understand fractions, decimals, and percentages and apply these concepts to real-world data. The graphing component adds another layer of mathematical understanding.
Why Use It:
This worksheet provides a fun and engaging way to learn about fractions, decimals, and percents. Using M&M's makes the concepts more concrete and relatable. It reinforces data collection, organization, and representation skills, as well as converting between fractions, decimals, and percents.
How to Use It:
First, provide students with a pack of M&M's. Instruct them to sort the M&M's by color (brown, orange, red, yellow, green, blue) and count the number of each color. Then, for each color, calculate the fraction (number of that color / total number of M&M's), decimal, and percent representation. Finally, use the bar graph to visually represent the number of M&M's of each color.
Target Users:
This worksheet is ideal for elementary and middle school students learning about fractions, decimals, and percents. It's also beneficial for teachers looking for engaging and hands-on math activities. It can also be used by homeschool parents to teach these concepts in a fun way.