


Views
Downloads


Mean Absolute Deviation Worksheet | Grade 6-8 Essential
Paste this activity's link or code into your existing LMS (Google Classroom, Canvas, Teams, Schoology, Moodle, etc.).
Students can open and work on the activity right away, with no student login required.
You'll still be able to track student progress and results from your teacher account.
This Mean Absolute Deviation activity provides a comprehensive framework for middle school students to master measures of variability. Students analyze data sets, including puppy weights and test scores, to calculate the average distance from the mean. This resource ensures learners transition from guided steps to independent application and conceptual comparison of data spread.
At a Glance
- Grade: 6–8 · Subject: Math
- Standard:
6.SP.B.5.C— Summarize data sets by giving quantitative measures of variability like mean absolute deviation- Skill Focus: Mean Absolute Deviation (MAD)
- Format: 4 pages · 5 problems · Answer key included · PDF
- Best For: Independent practice or introductory statistics lesson
- Time: 30–45 minutes
What's Inside
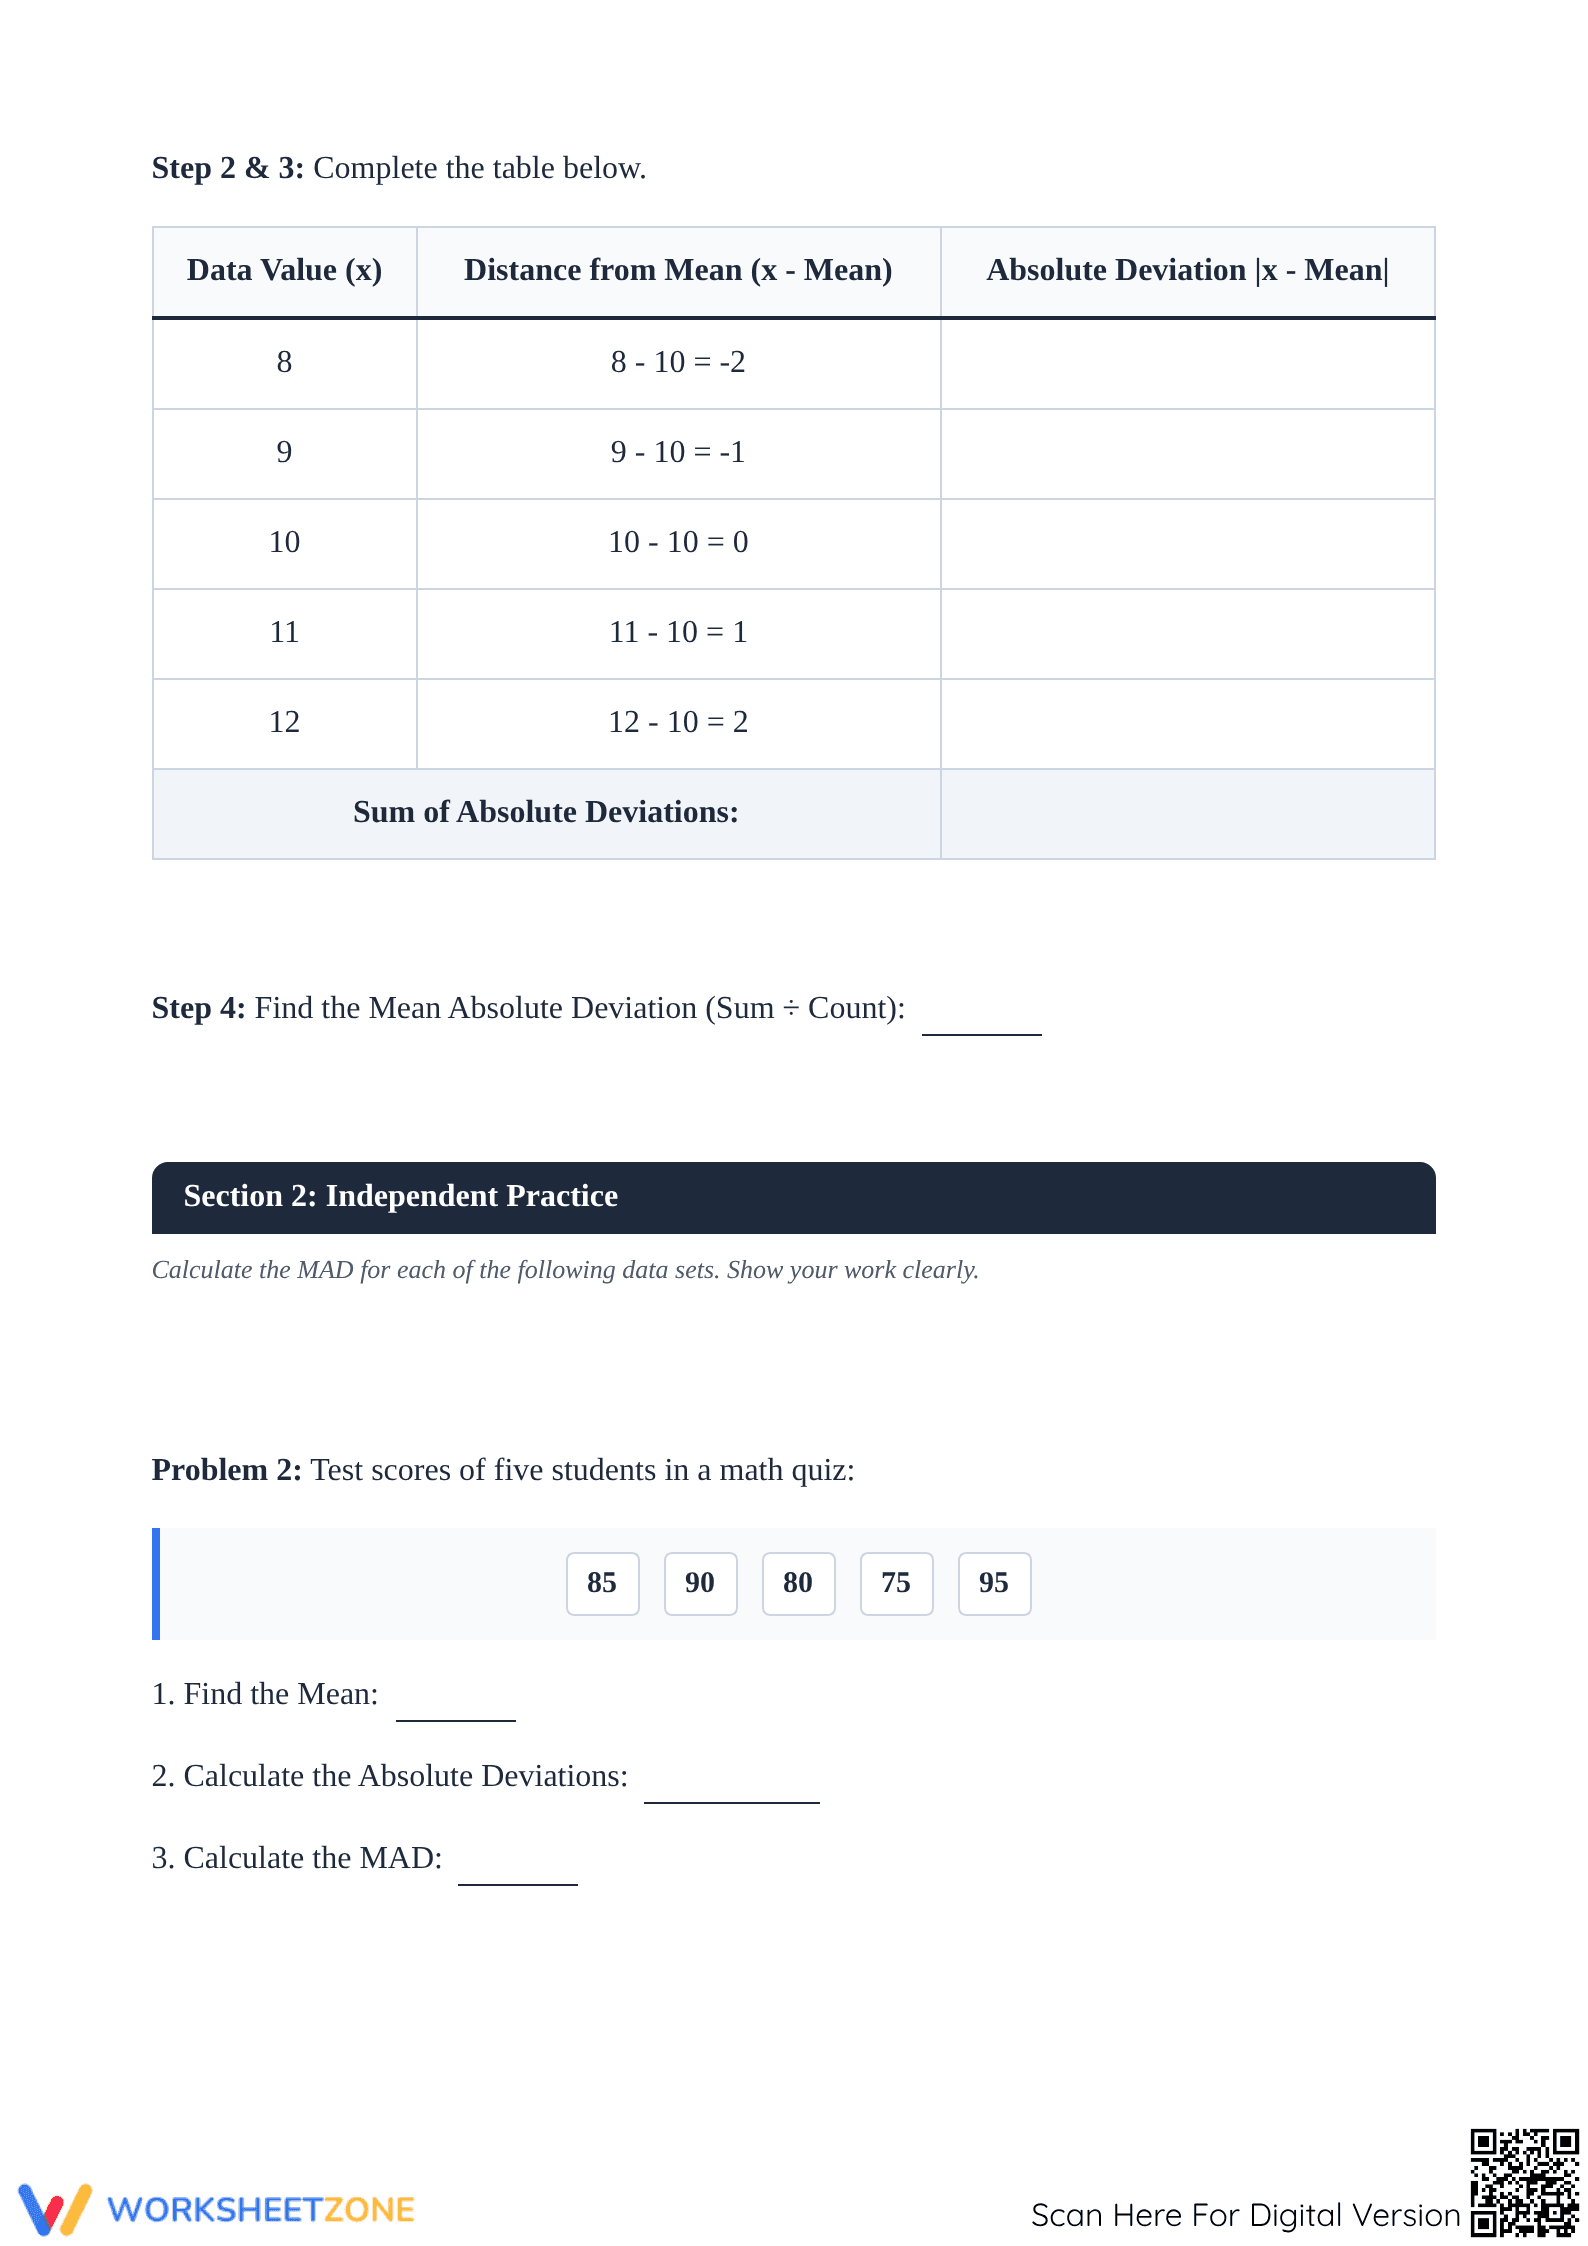
The worksheet begins with a clear definition and a four-step procedural guide to finding MAD. It features four distinct sections: guided practice with a structured distance table, independent practice using quiz scores and temperatures, a comparison section for interpreting data variability, and a final challenge task where students must synthesize their own data set to match a specific MAD value.
Zero-Prep Workflow
Step 1: Print. Select the specific data set pages needed for your lesson and print enough copies for your class in under 1 minute. Step 2: Distribute. Hand out the 4-page packets; the built-in reference box at the top allows students to begin working immediately with zero teacher explanation required. Step 3: Review. Use the provided full-page answer keys to facilitate a 5-minute peer-review or whole-class check at the end of the period.
Standards Alignment
This activity is explicitly aligned to 6.SP.B.5.C, which requires students to summarize numerical data sets in relation to their context by giving quantitative measures of center and variability. By calculating Mean Absolute Deviation, students fulfill the core requirement of describing the spread of a distribution. This standard code can be copied directly into lesson plans, IEP goals, or district curriculum mapping tools.
How to Use It
Utilize this worksheet during the independent phase of a statistics unit to solidify the procedural steps of calculating MAD. Teachers can observe students during Problem 1 to ensure they are correctly identifying absolute values before they proceed to the more complex comparison tasks in Section 3. The challenge task serves as an excellent exit ticket or extension for students who demonstrate early mastery of the core algorithm.
Who It's For
This resource is designed for Grade 6, 7, and 8 students beginning their study of statistical variability. It provides sufficient scaffolding for learners who benefit from step-by-step tables while offering extension opportunities for advanced students. It pairs naturally with a statistics anchor chart or a direct instruction lesson on measures of center and data distribution.
According to RAND AIRS 2024, structured procedural scaffolds are critical for students internalizing multi-step mathematical algorithms like Mean Absolute Deviation. This worksheet facilitates the Mastery of 6.SP.B.5.C by moving students through a cognitive progression from rote calculation to higher-order data synthesis. Research from Fisher & Frey (2014) emphasizes that guided-to-independent release models significantly improve retention of statistical concepts among middle school learners. By requiring students to interpret what a higher MAD tells them about a group, this resource moves beyond simple arithmetic to address the conceptual underpinnings of data spread. The inclusion of a challenge task that requires creating a data set to meet a specific MAD target aligns with top-tier instructional recommendations for depth of knowledge. Educational benchmarks indicate that students who can quantitatively describe variability are better prepared for high school algebra and advanced data science pathways.