


Views
Downloads
Printable Mean Absolute Deviation Worksheet | Grade 6-8 Math
Paste this activity's link or code into your existing LMS (Google Classroom, Canvas, Teams, Schoology, Moodle, etc.).
Students can open and work on the activity right away, with no student login required.
You'll still be able to track student progress and results from your teacher account.
Calculated Statistical Variability
Mastering statistical variability is a core middle school math requirement. This comprehensive worksheet guides students through calculating the Mean Absolute Deviation (MAD) of diverse data sets. By breaking down the complex process into manageable steps—finding the mean, calculating distances, and averaging absolute values—students build a concrete understanding of how data spreads around a central point.
At a Glance
- Grade: 6–8 · Subject: Math
- Standard:
CCSS.MATH.CONTENT.6.SP.B.5.C— Summarize data by giving quantitative measures of center and variability- Skill Focus: Mean Absolute Deviation (MAD)
- Format: 5 pages · 5 problems · Answer key included · PDF
- Best For: Independent practice and statistical variability review
- Time: 35–45 minutes
What's Inside
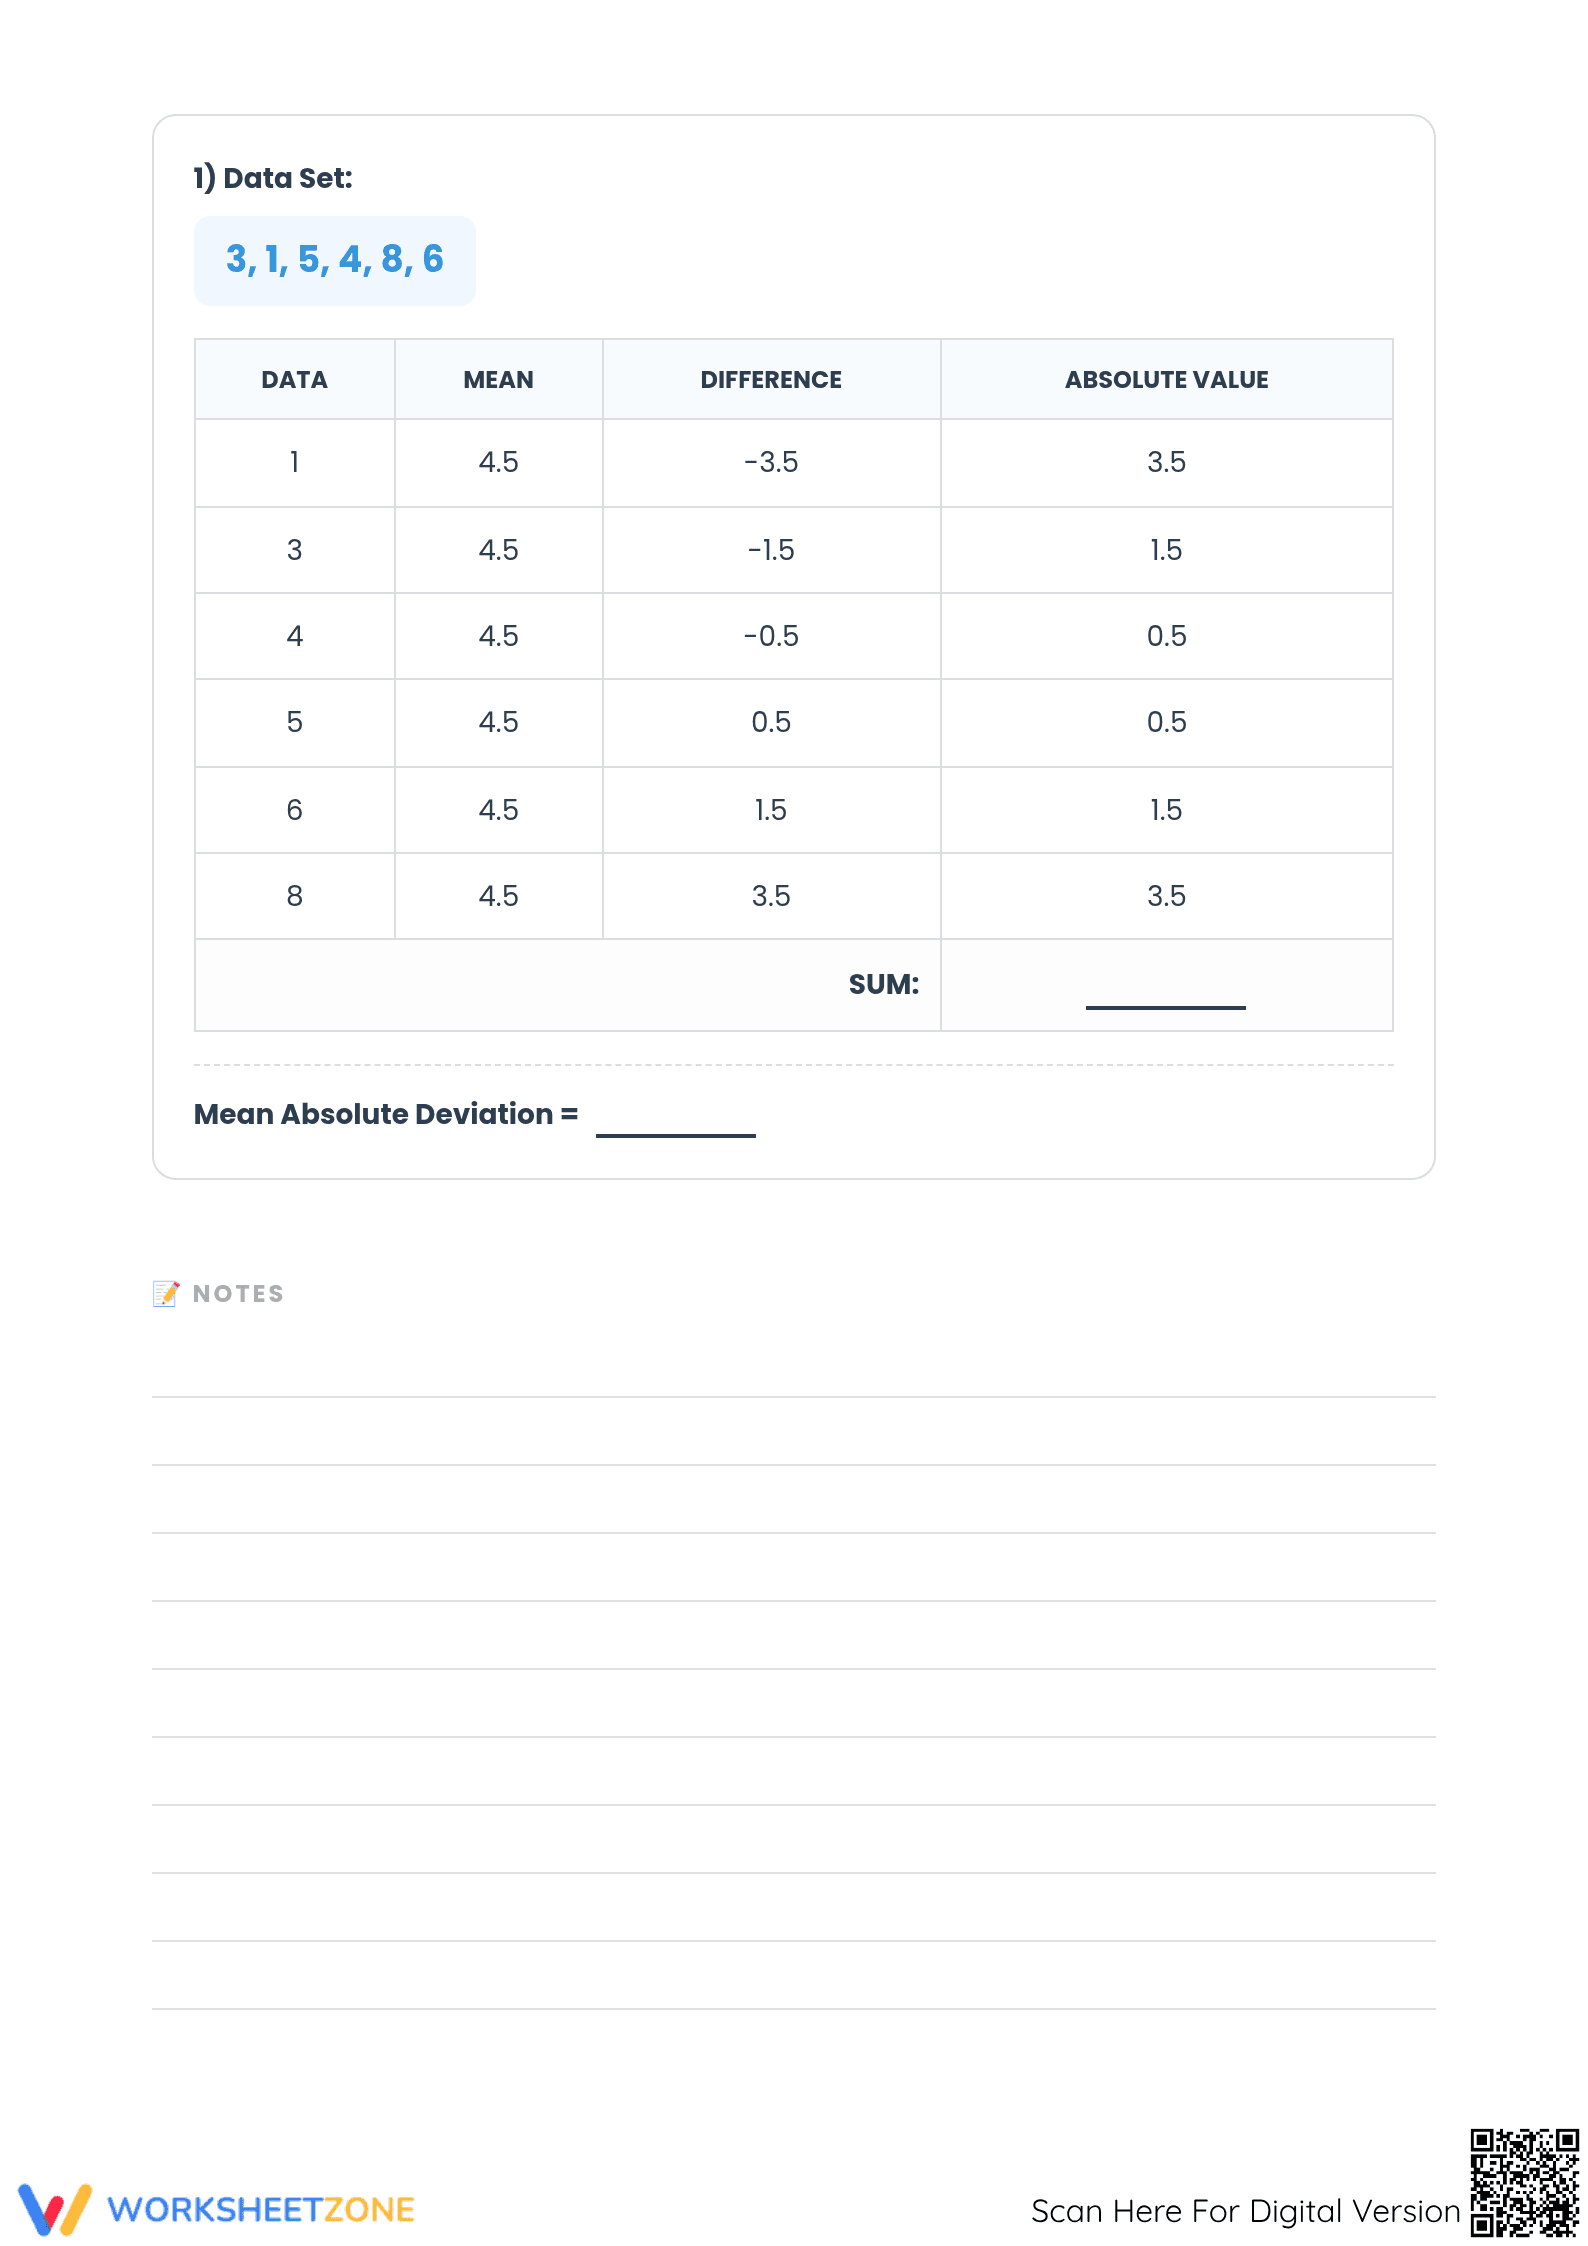
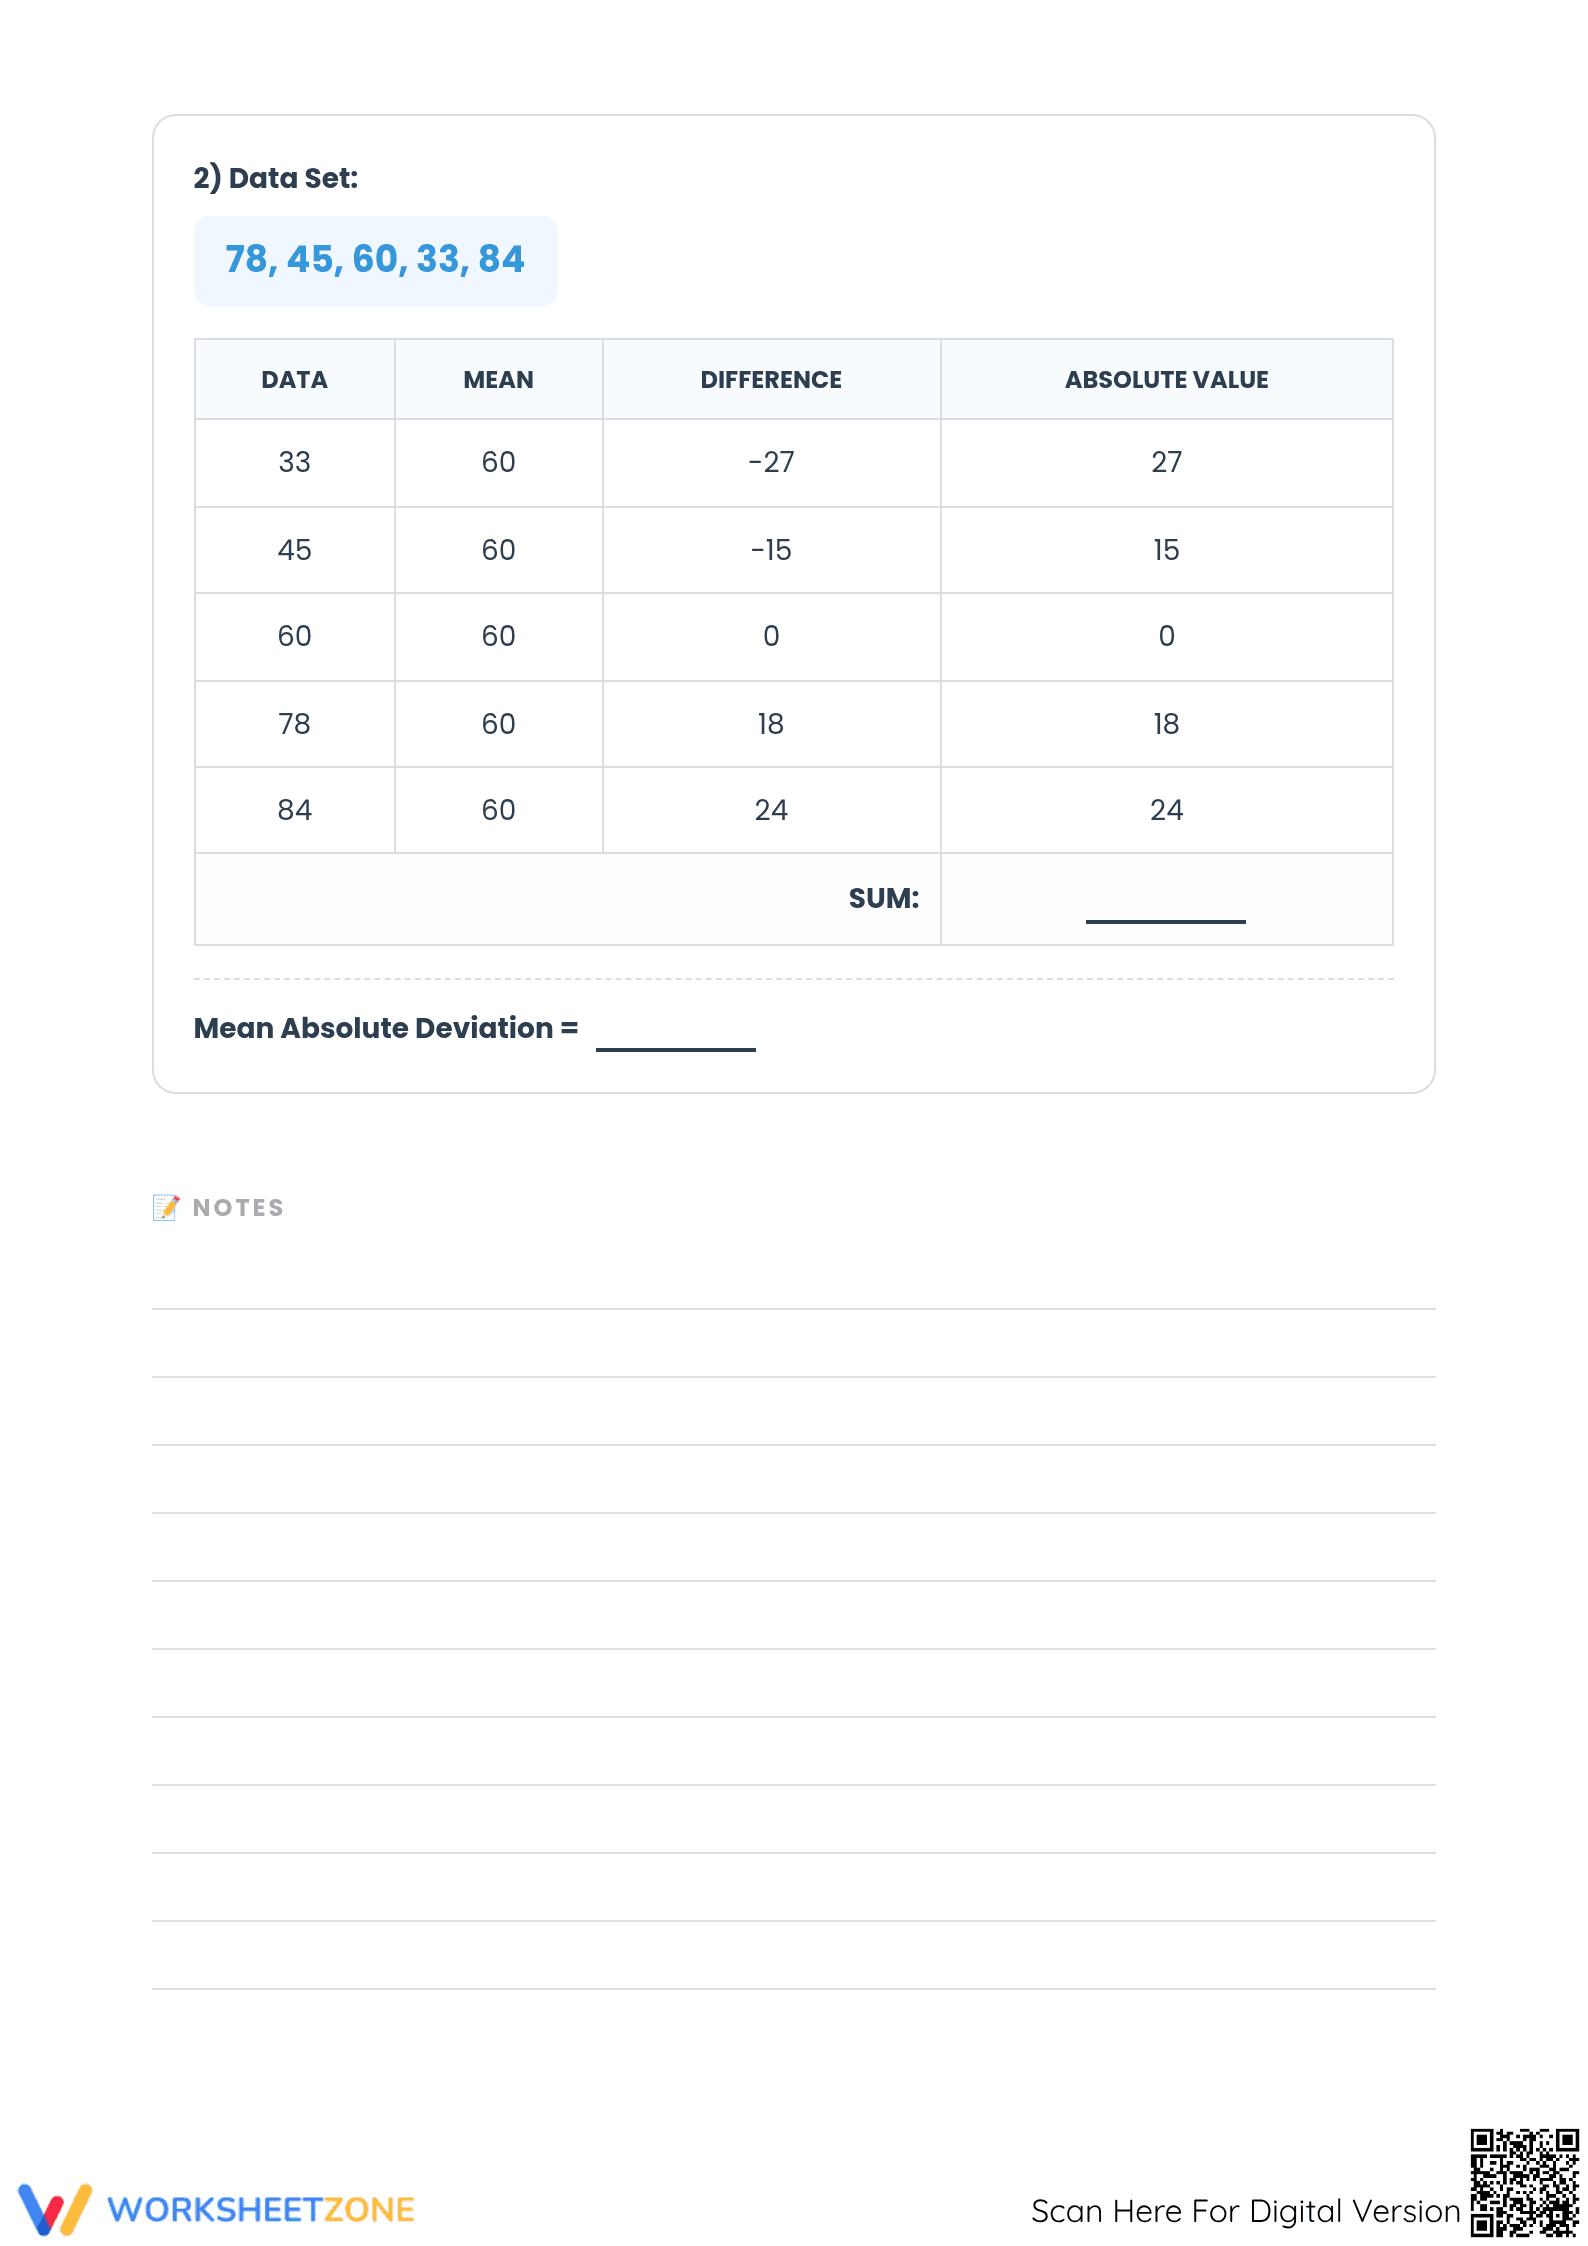
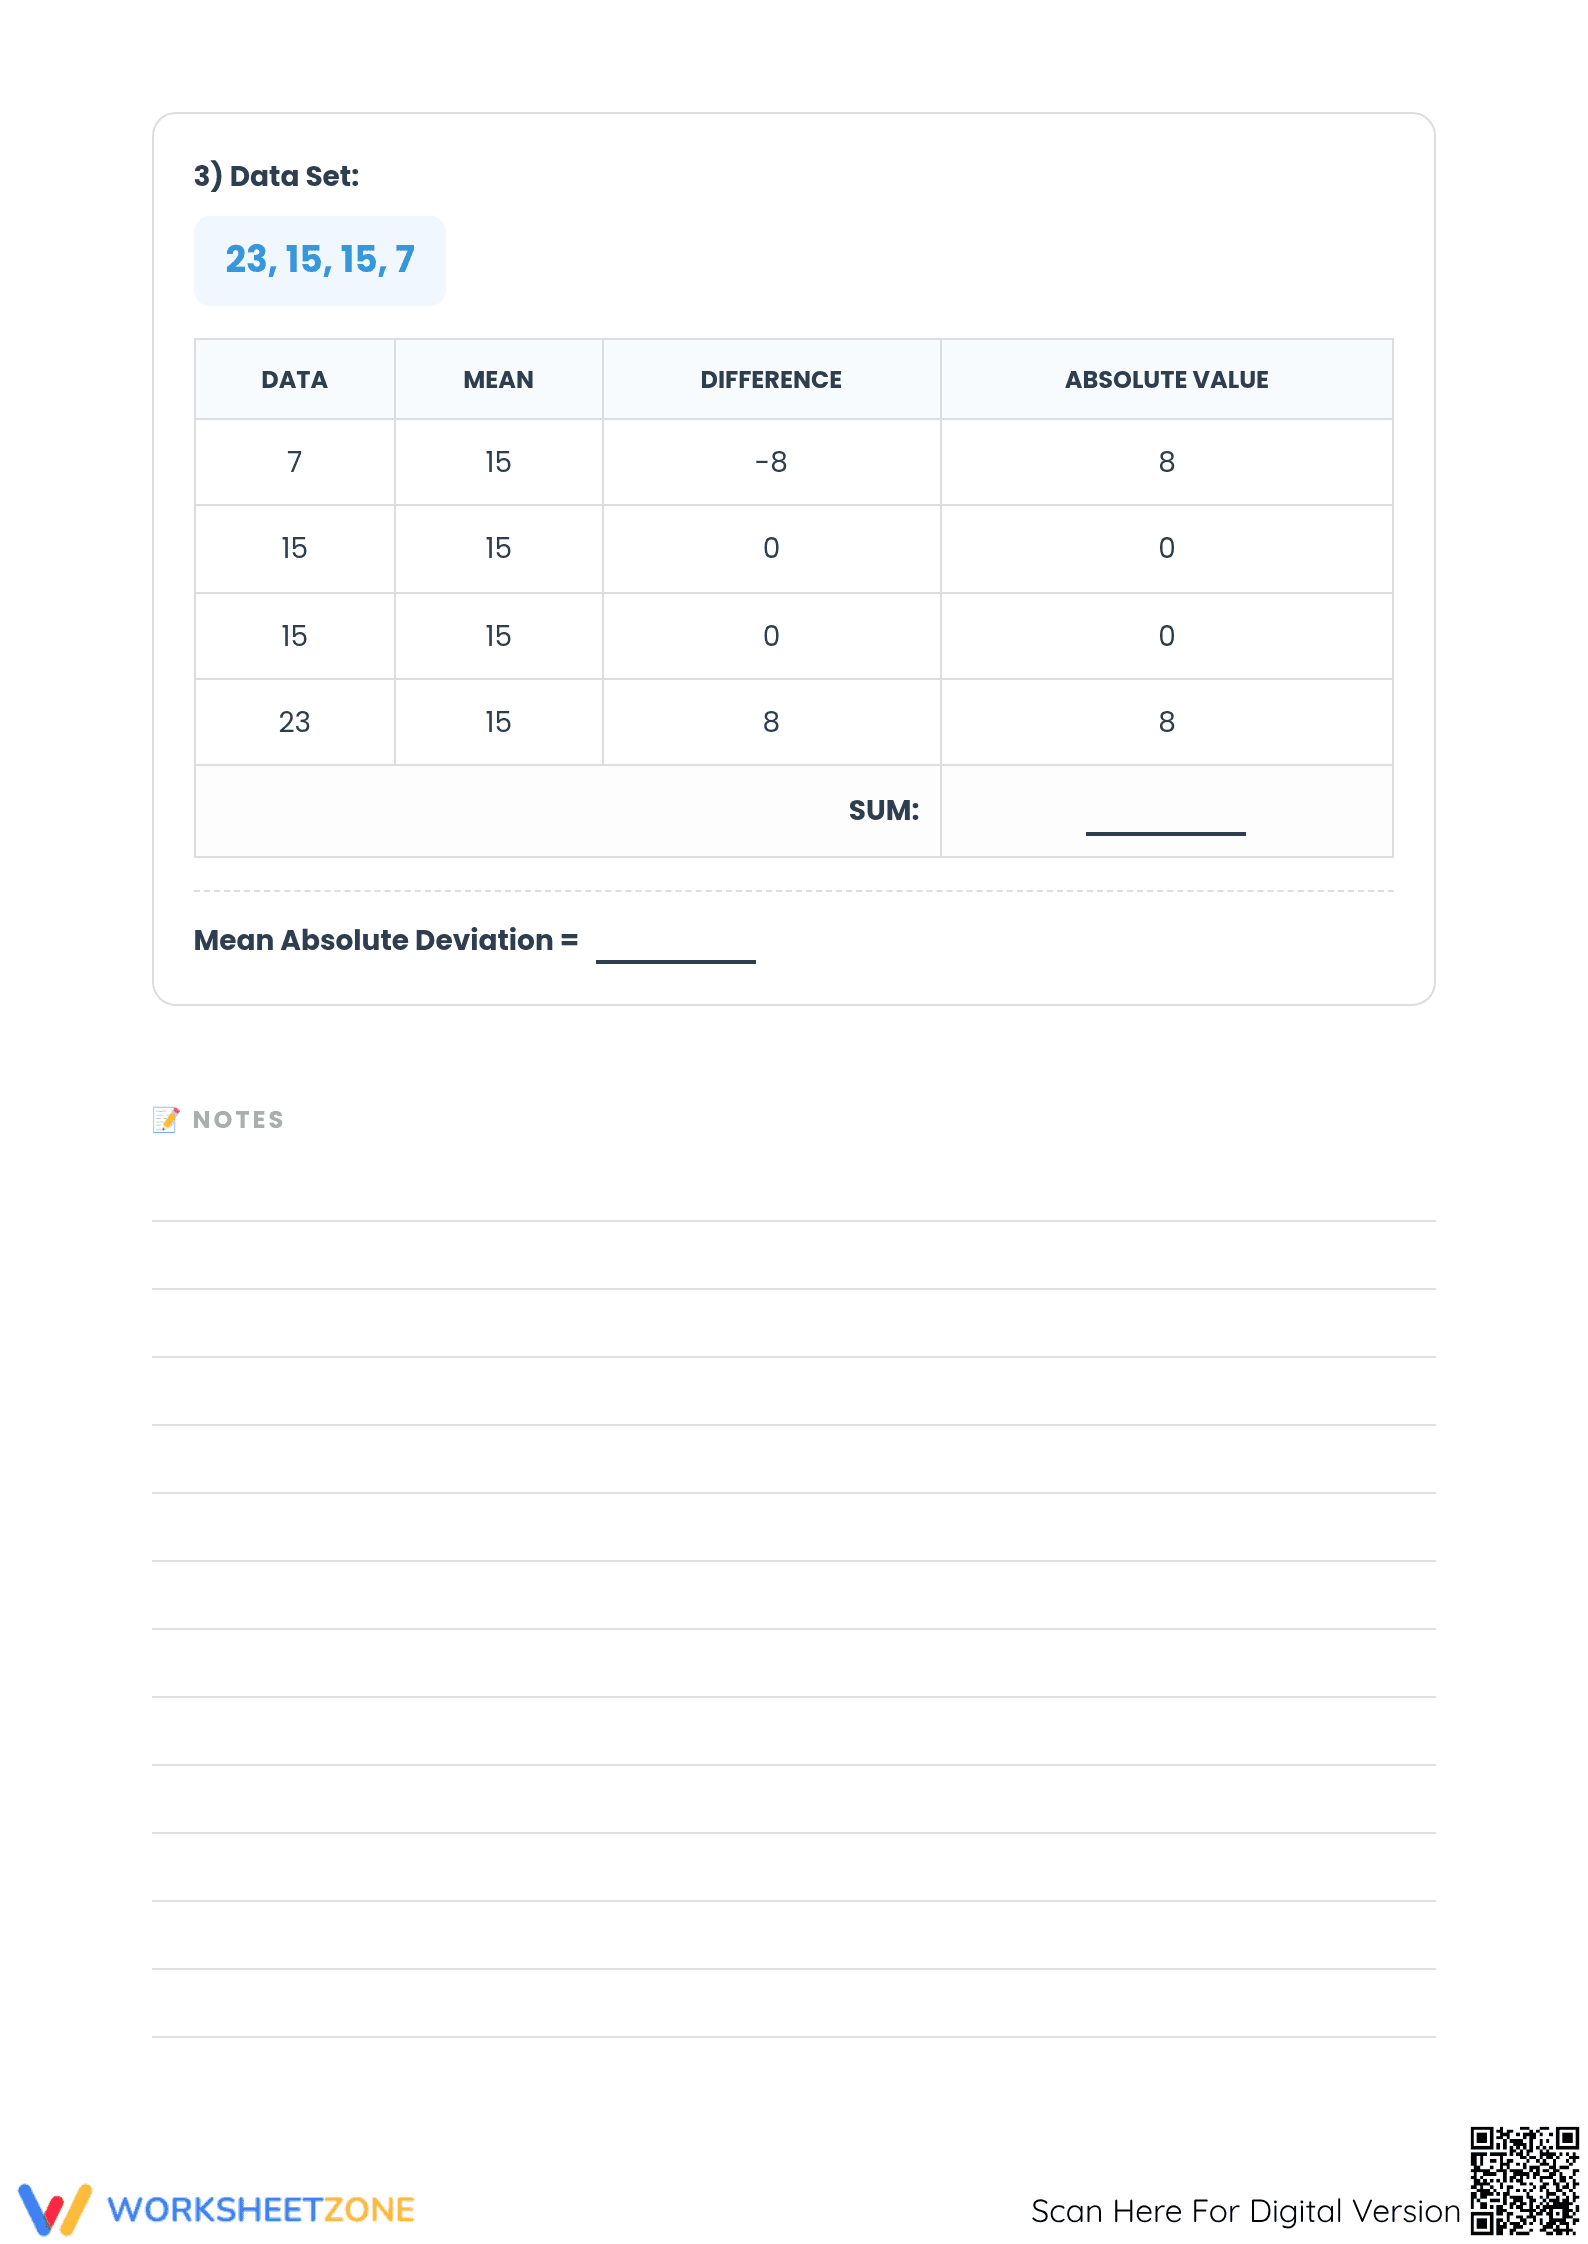
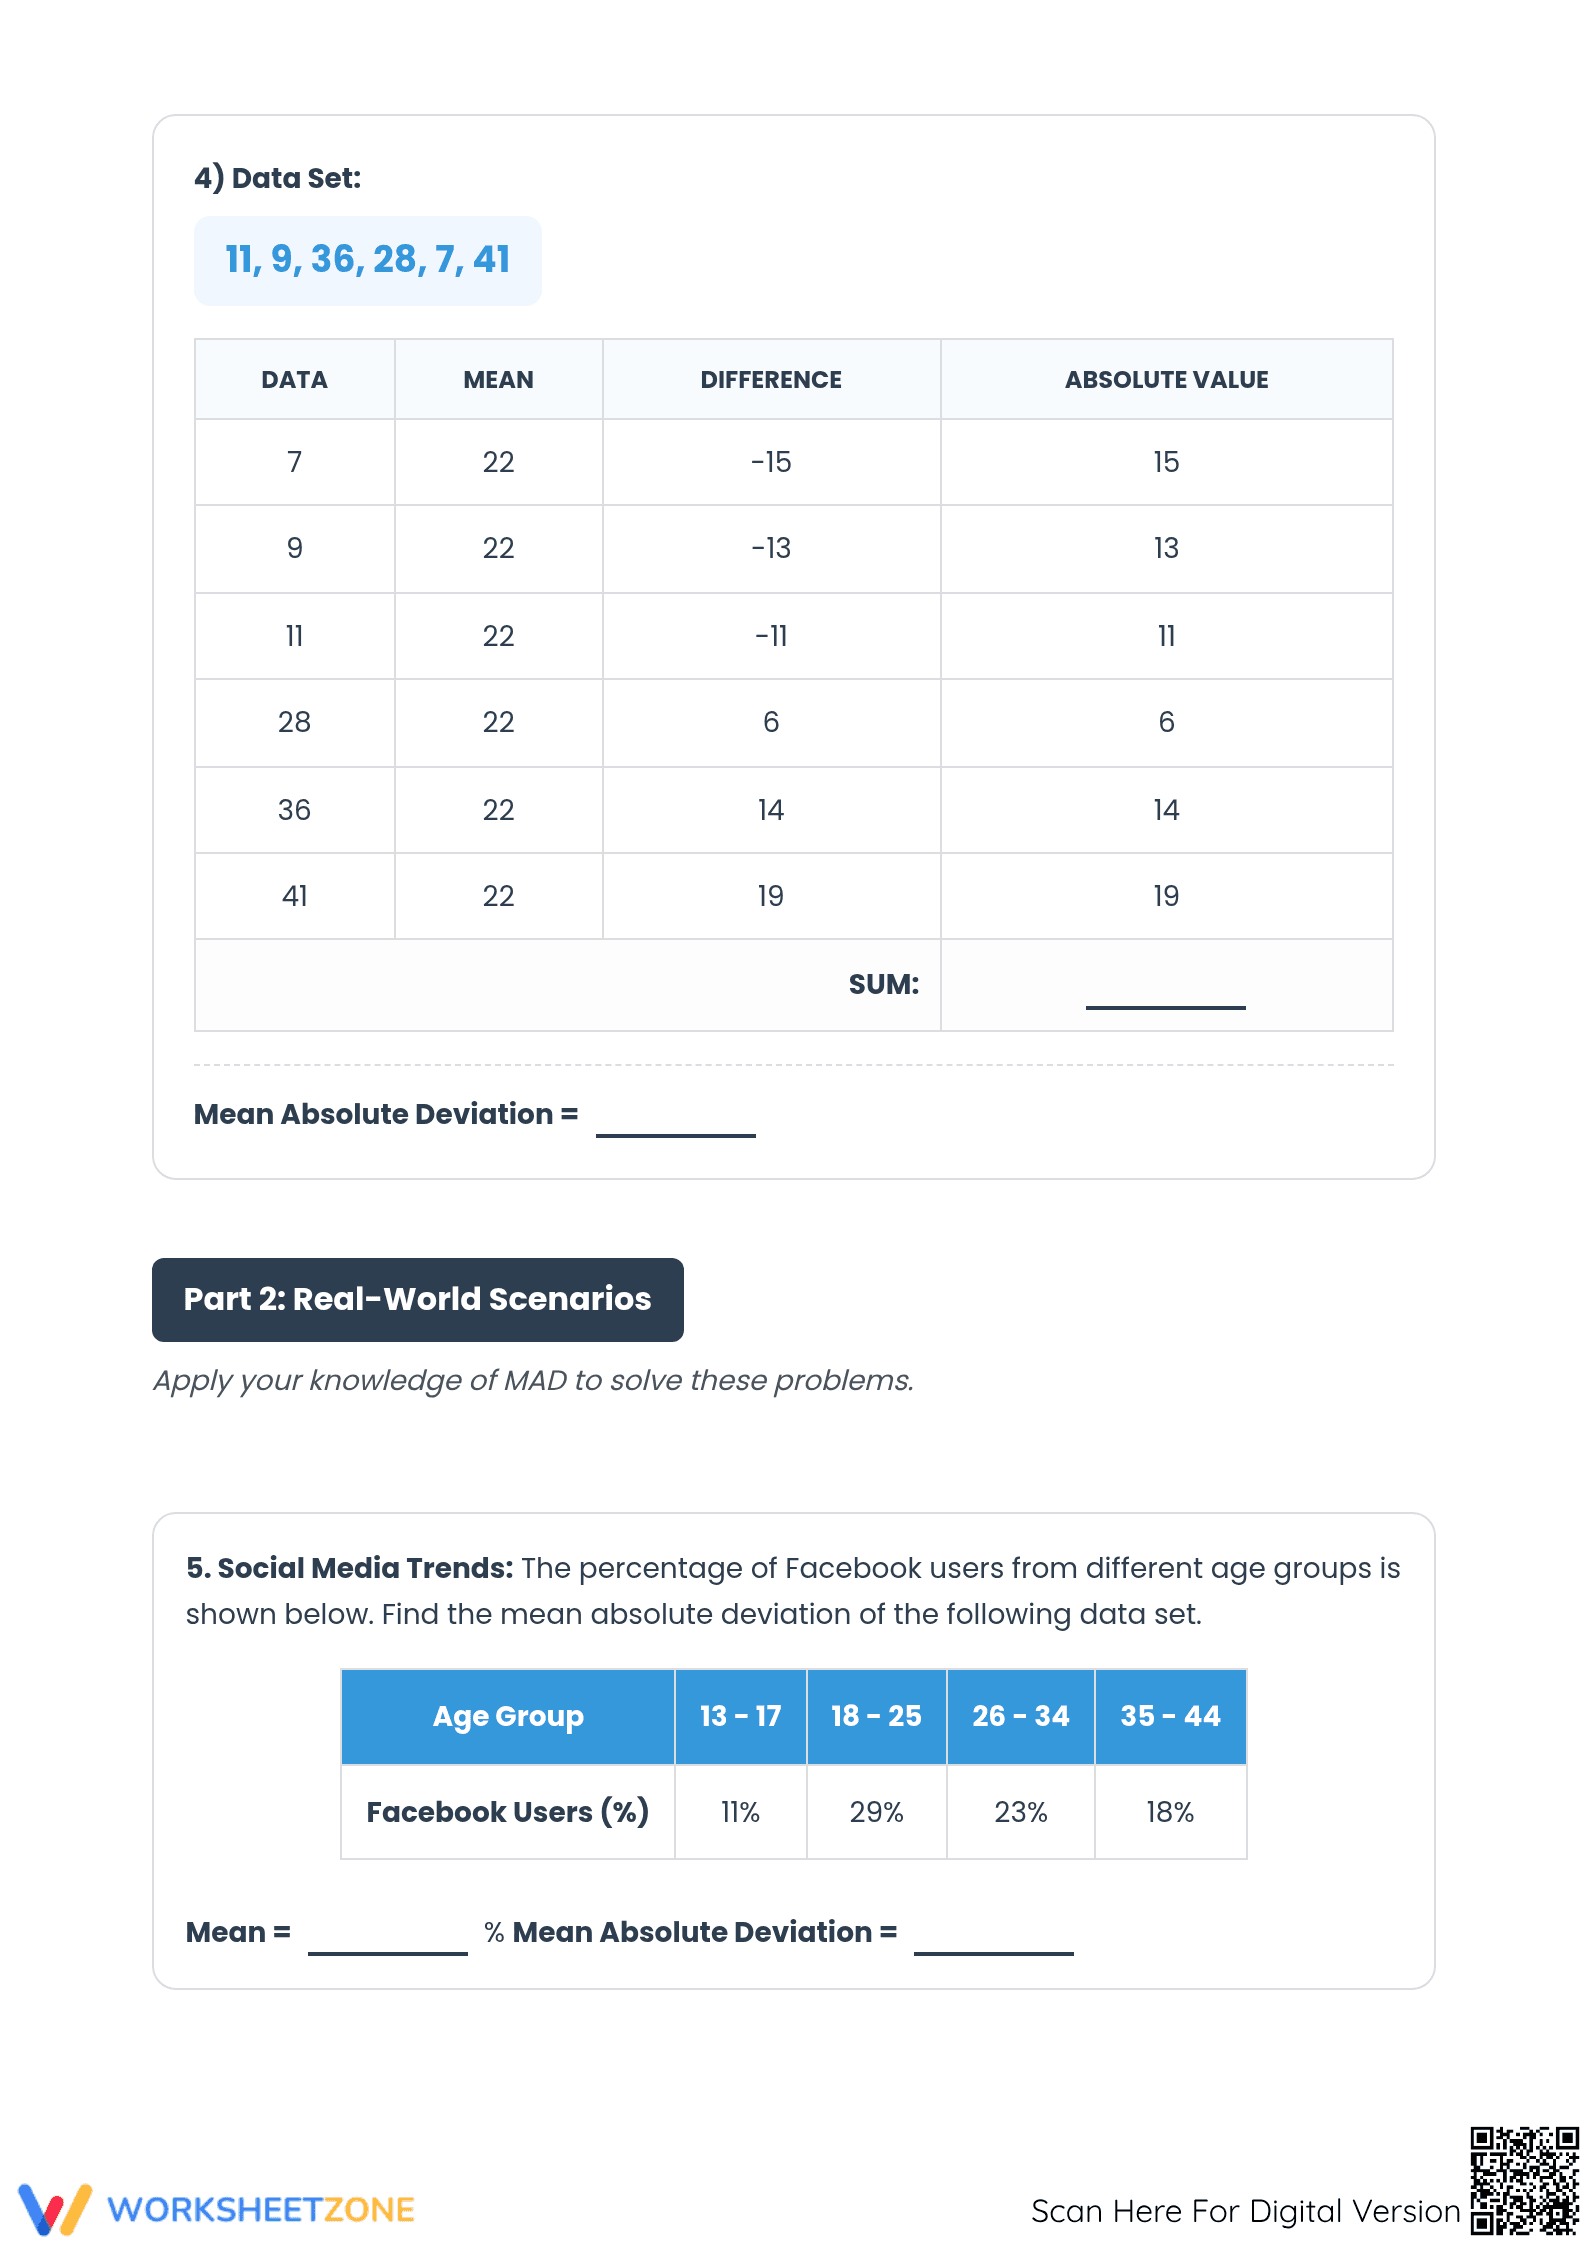
This 5-page packet features four structured calculation tables and one real-world scenario focused on social media trends. Each page provides ample space for students to show their work, including dedicated columns for data points, the mean, individual differences, and absolute deviations. A complete answer key is included for rapid grading or student self-correction.
Skill Progression
- Guided Practice: The first page provides a clear, four-step anchor chart that defines MAD and outlines the exact formulaic steps needed for success.
- Supported Practice: Tasks 1 through 3 use detailed scaffolding tables with 5–6 data points each to ensure students subtract and find absolute values correctly.
- Independent Practice: Task 5 shifts to a real-world scenario involving social media usage, requiring students to extract data from a table and apply the MAD process with minimal guidance.
The resource follows a gradual-release model, moving from conceptual definitions to complex data applications using an I Do, We Do, You Do approach.
Standards Alignment
The primary focus is CCSS.MATH.CONTENT.6.SP.B.5.C, which requires students to summarize numerical data sets by giving quantitative measures of center (median and/or mean) and variability (interquartile range and/or mean absolute deviation). This worksheet specifically targets the variability component. Both standard codes can be copied directly into lesson plans, IEP goals, or district curriculum mapping tools.
How to Use It
Use this worksheet during the independent practice portion of a statistics lesson after students have mastered calculating the arithmetic mean. It serves as an excellent formative assessment tool; teachers should observe if students are correctly converting negative differences into positive absolute values. Expect a completion time of roughly 40 minutes for the full packet.
Who It's For
Designed primarily for 6th-grade students beginning their statistics journey, it is also highly effective for 7th and 8th graders requiring a refresher on data spread. It pairs naturally with a data visualization lesson on box plots or dot plots to provide a comprehensive look at data sets.
Calculation accuracy in middle school statistics is a significant predictor of success in high school data science and probability courses. According to EdReports (2024), instructional materials that utilize structured tabular scaffolds help students internalize multi-step algorithms, such as those required for Mean Absolute Deviation. By focusing on the CCSS.MATH.CONTENT.6.SP.B.5.C standard, this resource ensures that students transition from simple averages to understanding the quantitative nuances of variability. The inclusion of real-world contexts, like social media analytics, mirrors the NAEP's emphasis on data literacy in modern curricula. Mastering MAD provides the mathematical foundation necessary for students to eventually tackle standard deviation and more advanced statistical modeling. This printable resource offers the essential practice needed to turn abstract formulas into a permanent part of a student's mathematical toolkit.