


Views
Downloads


Printable Line Graph Worksheet | Grade 5 Math
Paste this activity's link or code into your existing LMS (Google Classroom, Canvas, Teams, Schoology, Moodle, etc.).
Students can open and work on the activity right away, with no student login required.
You'll still be able to track student progress and results from your teacher account.
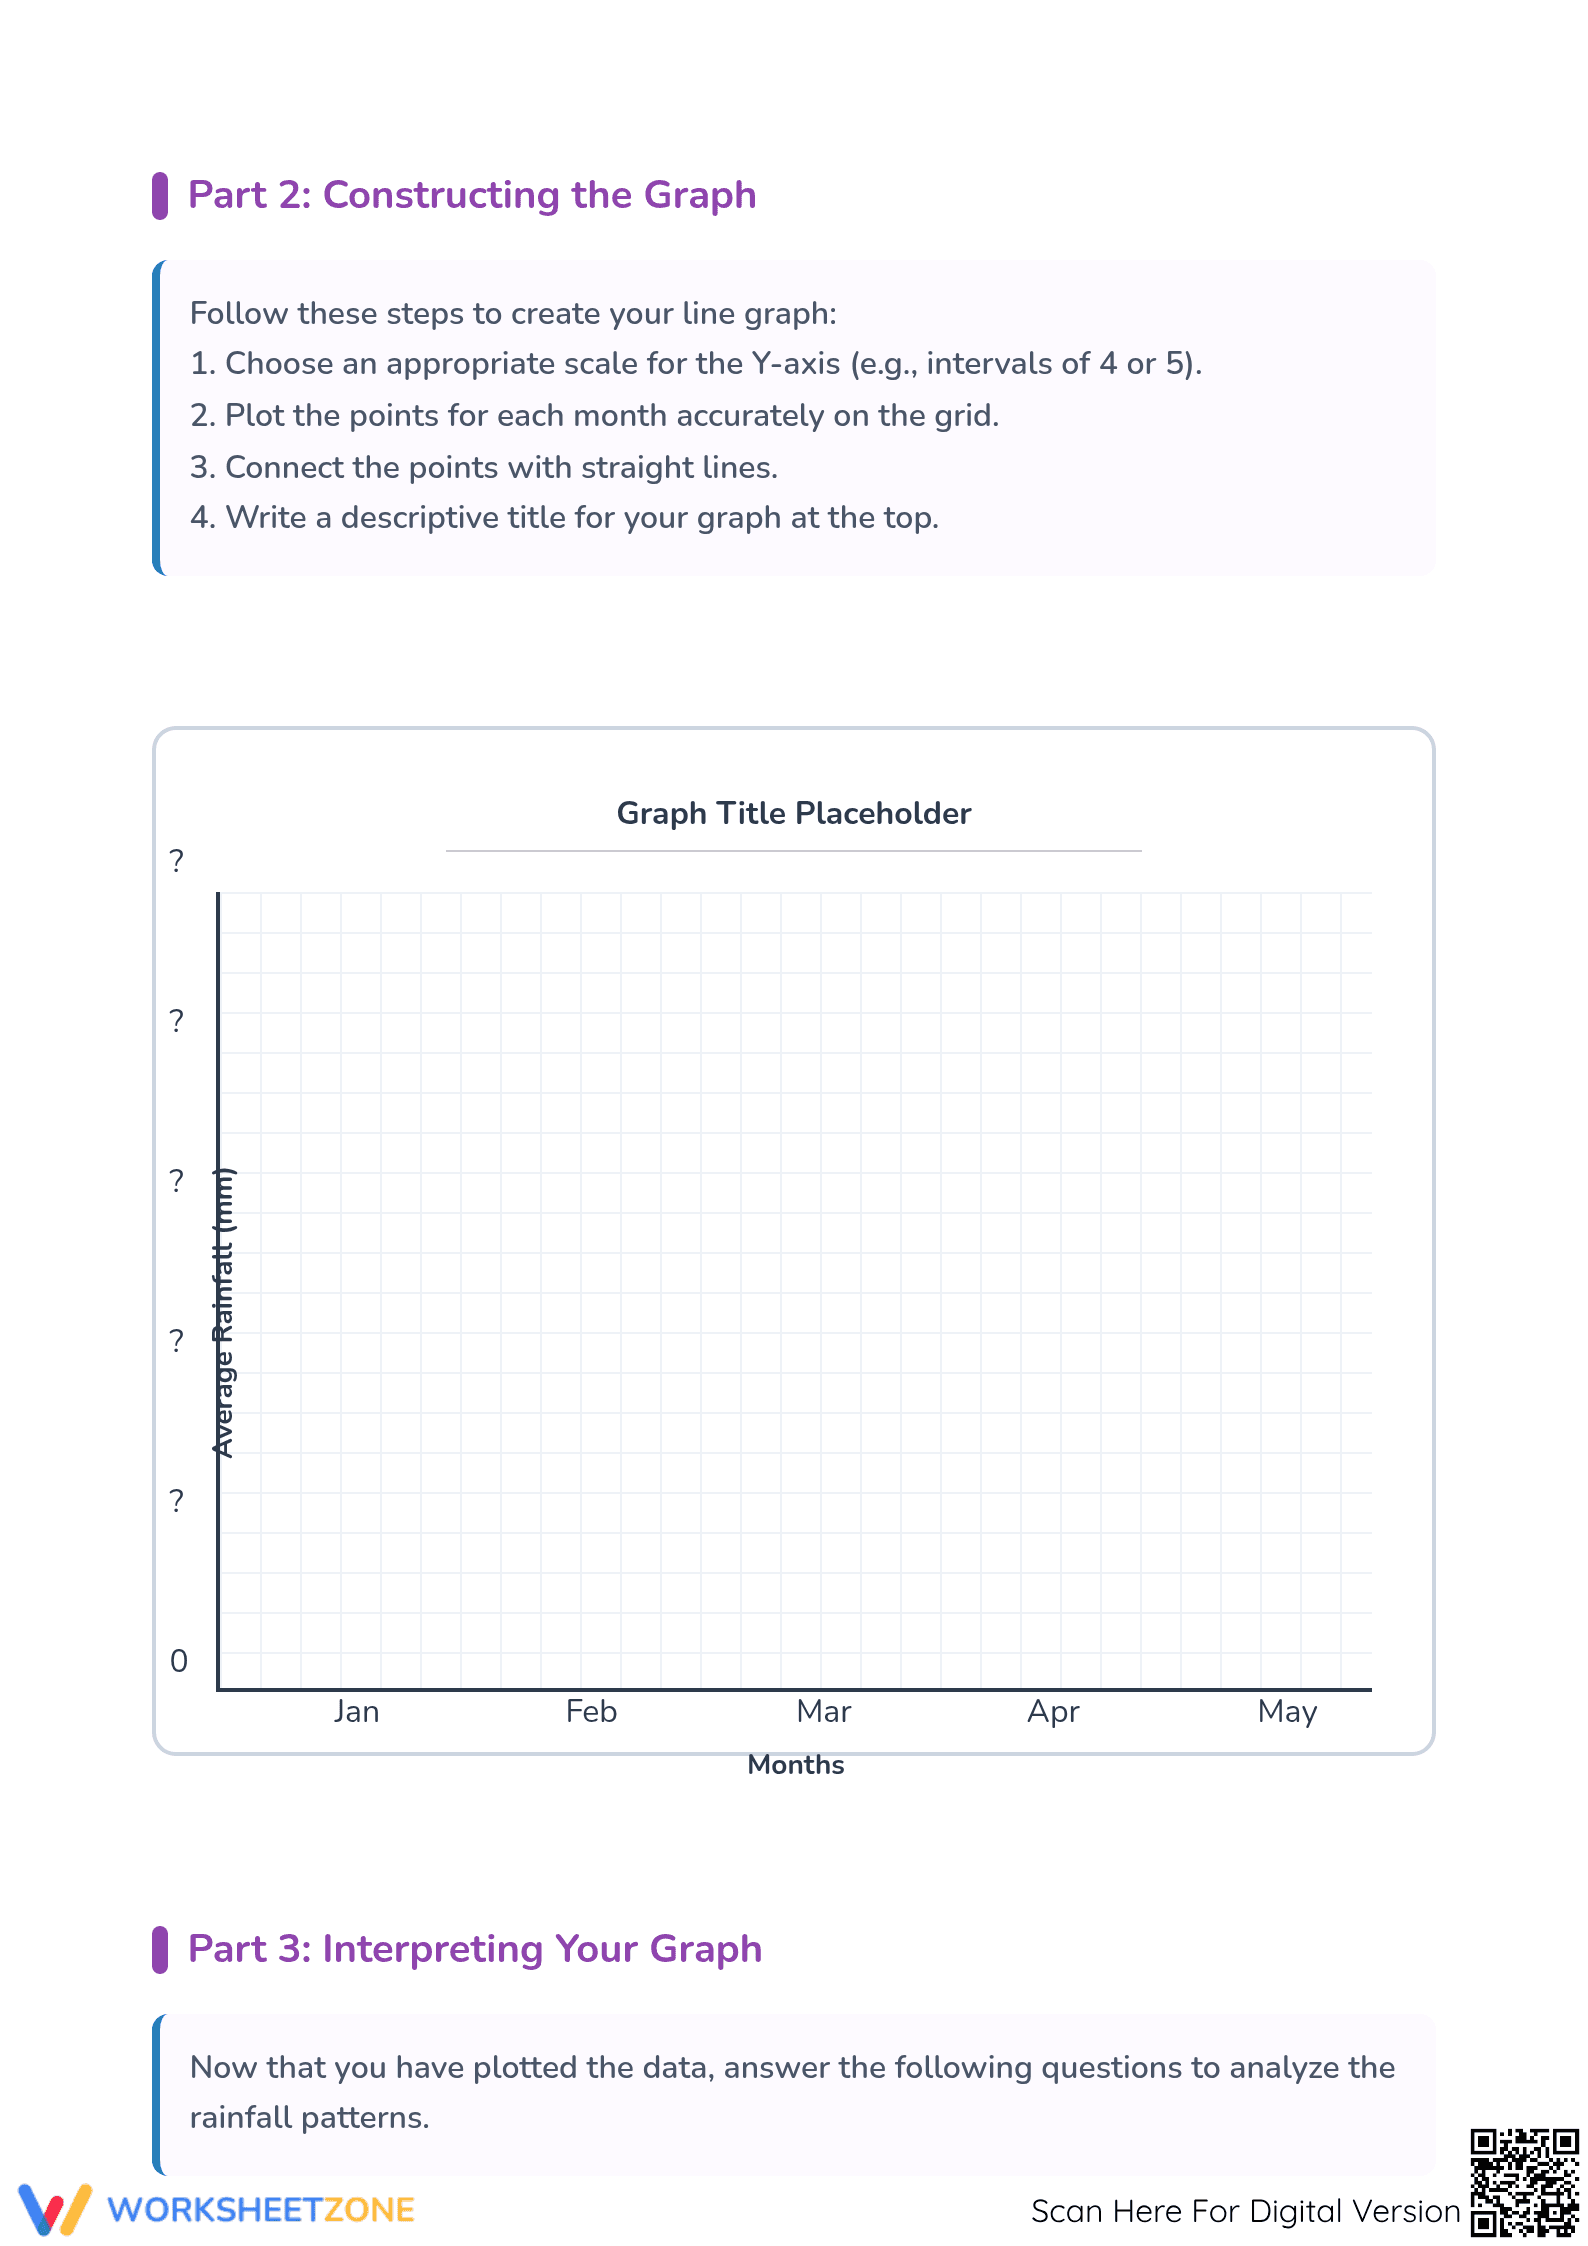
This printable worksheet provides targeted practice for Grade 5 students on the essential math skill of working with line graphs. Students will move from interpreting data presented in existing graphs to constructing their own based on a data table, reinforcing their ability to represent and analyze real-world information visually.
At a Glance
- Grade: 5 · Subject: Math
- Standard:
CCSS.MATH.CONTENT.5.G.A.2— Represent and interpret real-world problems by graphing points.- Skill Focus: Interpreting and Creating Line Graphs
- Format: 3 pages · 15 problems · Answer key included · PDF
- Best For: Independent practice, homework, or formative assessment
- Time: 25–40 minutes
What's Inside
This three-page PDF includes two pages of graph interpretation and one page of graph creation. Students analyze temperature and rainfall graphs (10 questions total), then use a data table to plot a new line graph. A complete, two-page answer key shows correct answers and the accurately drawn graph for easy review.
Skill Progression
The worksheet follows a gradual release model.
- Guided Practice: Students start by analyzing a completed graph, reading specific data points.
- Supported Practice: They apply these skills to a new graph context.
- Independent Practice: Finally, students create a complete line graph from a data table.
Standards Alignment
This worksheet directly aligns with CCSS.MATH.CONTENT.5.G.A.2, which covers graphing and interpreting points on the coordinate plane. Students interpret the meaning of graphed points and plot points themselves to represent a real-world scenario. The standard code is ready to copy into lesson plans.
How to Use It
Use this resource as independent practice after a lesson on line graphs, for homework, or in a math center. For formative assessment, check student accuracy on the final graph-creation task. This provides a clear indicator of mastery. Expect a completion time of 25-40 minutes.
Who It's For
Designed for Grade 5 students, this resource also works as a review for Grade 6 learners. It is helpful for visual learners who benefit from seeing data represented graphically. Pair it with an anchor chart defining key graph components (x-axis, y-axis, scale).
This worksheet supports a core tenet of numeracy education: translating between data representations. Aligned with CCSS.MATH.CONTENT.5.G.A.2, it provides practice in graphing and interpreting coordinate plane data. Research like the RAND AIRS (2024) report highlights that procedural fluency in graphing is a necessary foundation for higher-order problem-solving. This resource provides focused practice to build that fluency. As noted by Fisher & Frey (2014), moving from consumption to creation is crucial for meaning-making, a process this worksheet facilitates by having students construct their own graph.