


1 / 4
0
Views
0
Downloads
0.0
0
Save
0 Likes
Identifying Quadratic Functions Practice
0 Views
0 Downloads
Paste this activity's link or code into your existing LMS (Google Classroom, Canvas, Teams, Schoology, Moodle, etc.).
Students can open and work on the activity right away, with no student login required.
You'll still be able to track student progress and results from your teacher account.
Information
Description
What It Is:
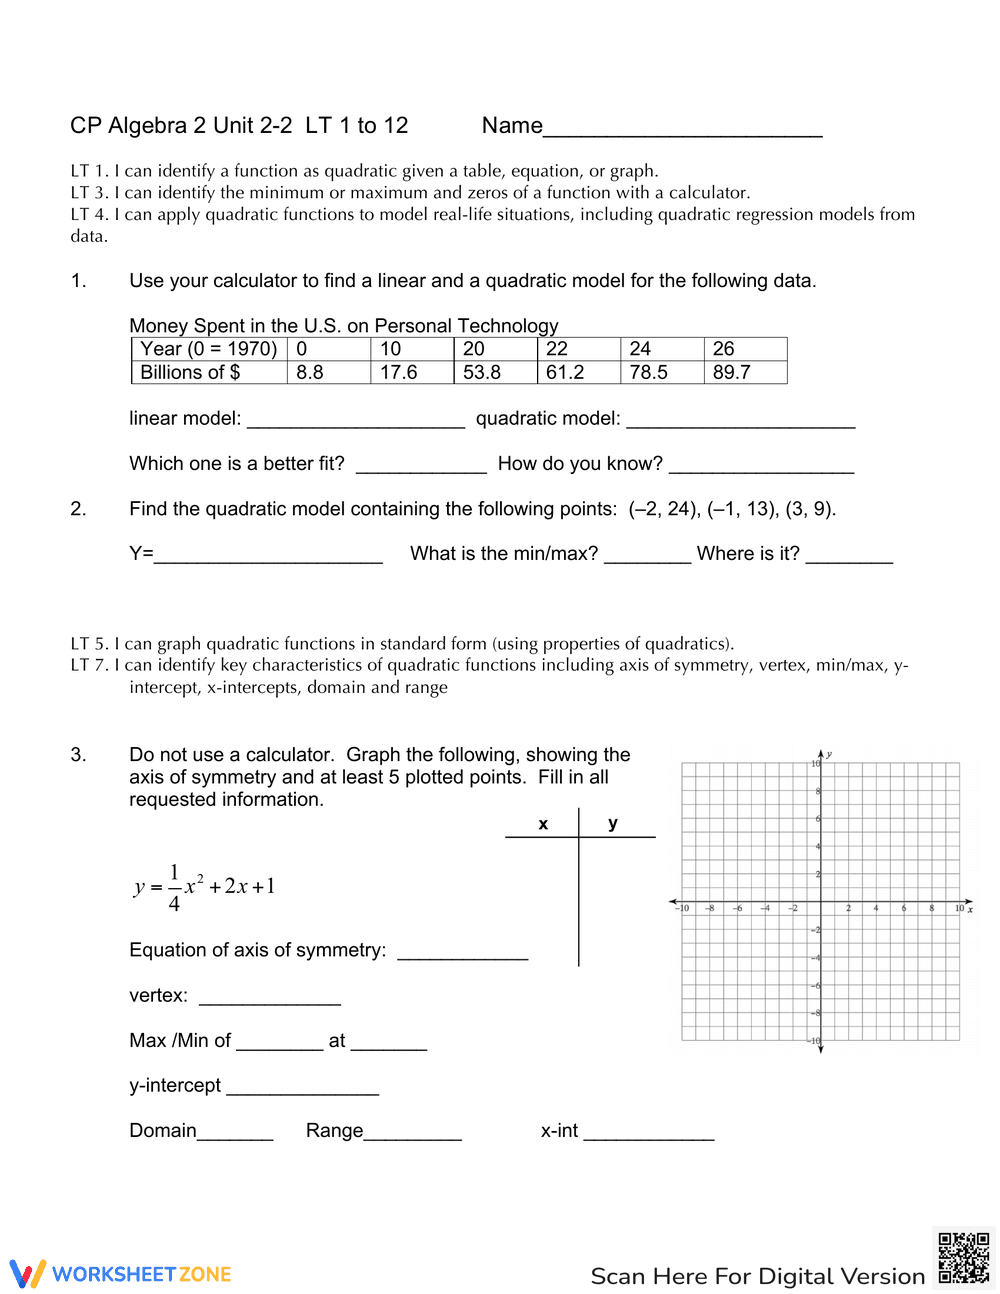
This is an algebra worksheet focusing on quadratic functions. It includes problems on identifying linear and quadratic models from data, finding quadratic models from given points, and graphing quadratic functions without a calculator. Students are asked to find the axis of symmetry, vertex, max/min, y-intercept, domain, range, and x-intercept. The worksheet includes a table of data on money spent on personal technology, coordinate points, and an equation of a quadratic function to graph.
Grade Level Suitability:
This worksheet is suitable for high school students, specifically grades 9-11, likely for Algebra 2 or a pre-calculus course. The content requires understanding of quadratic functions, modeling data, and graphing.
Why Use It:
This worksheet helps students develop skills in modeling real-world data with linear and quadratic functions, finding equations of quadratic functions, and graphing quadratic functions by hand. It reinforces the understanding of key characteristics of quadratic functions, such as axis of symmetry, vertex, and intercepts.
How to Use It:
Students should use a calculator to find linear and quadratic models for the data in problem 1. For problem 2, students should use the given points to determine the equation of the quadratic model and identify the min/max. In problem 3, students must graph the given quadratic function without a calculator, showing the axis of symmetry and plotting at least 5 points, then fill in the requested information about the graph.
Target Users:
The target users are high school students in Algebra 2 or pre-calculus courses who are learning about quadratic functions and their applications. It is also suitable for students preparing for standardized tests that cover these topics.