


Views
Downloads
Essential Grade 5 Solubility Bar Graph Science Worksheet
Paste this activity's link or code into your existing LMS (Google Classroom, Canvas, Teams, Schoology, Moodle, etc.).
Students can open and work on the activity right away, with no student login required.
You'll still be able to track student progress and results from your teacher account.
Understanding Solubility Through Data
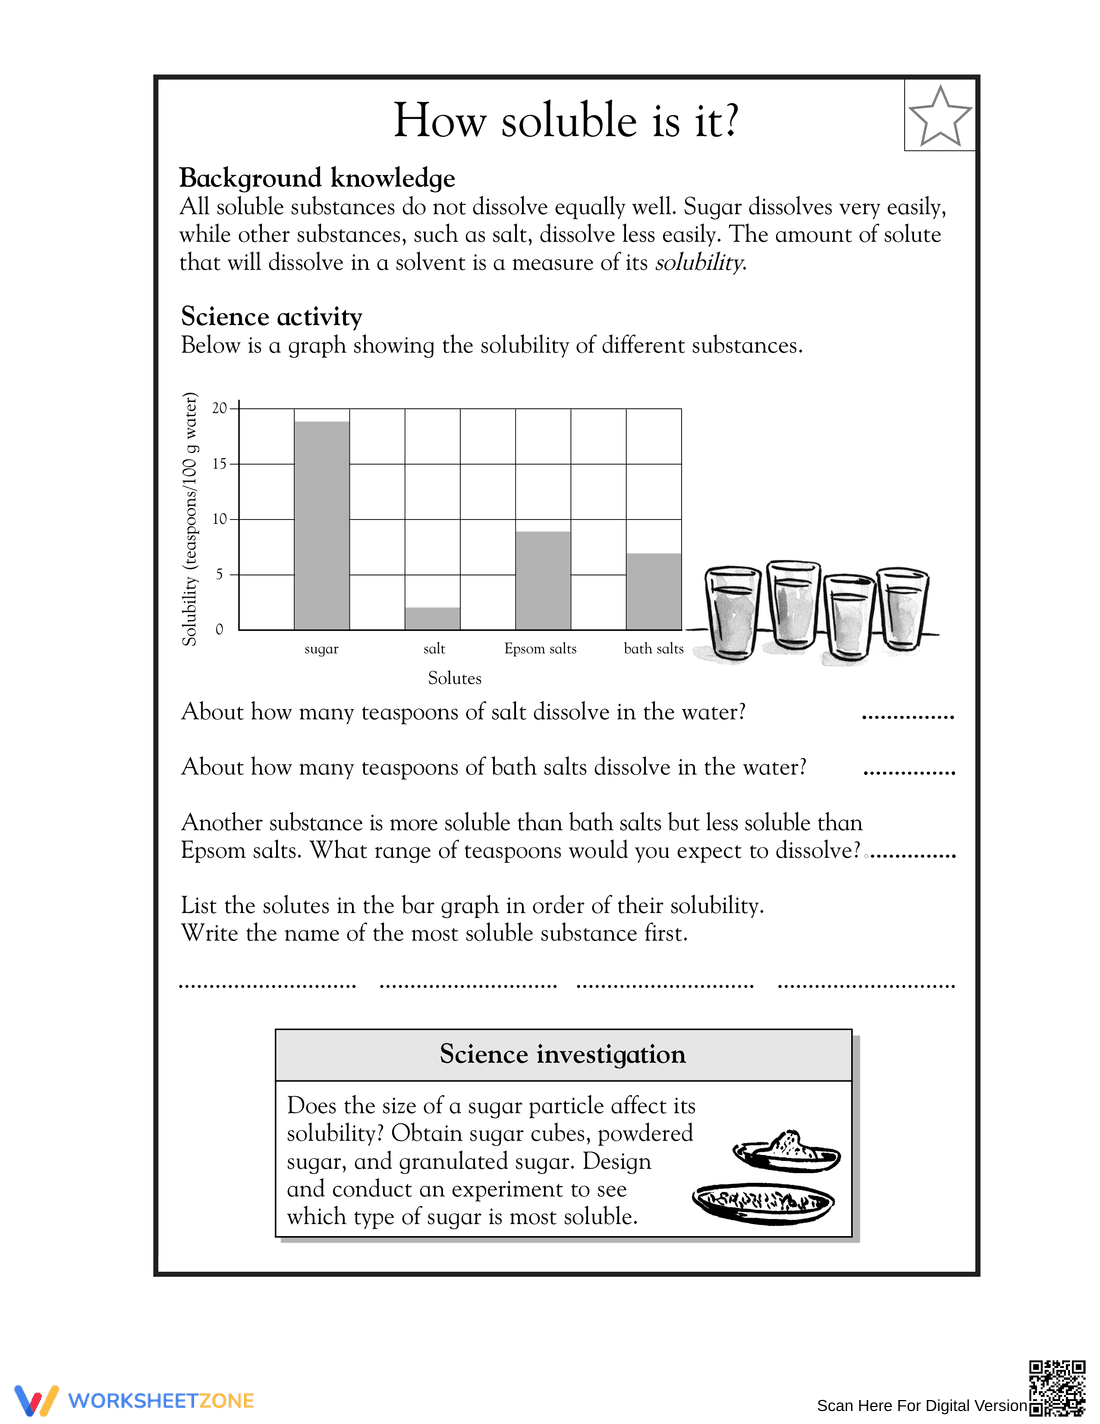
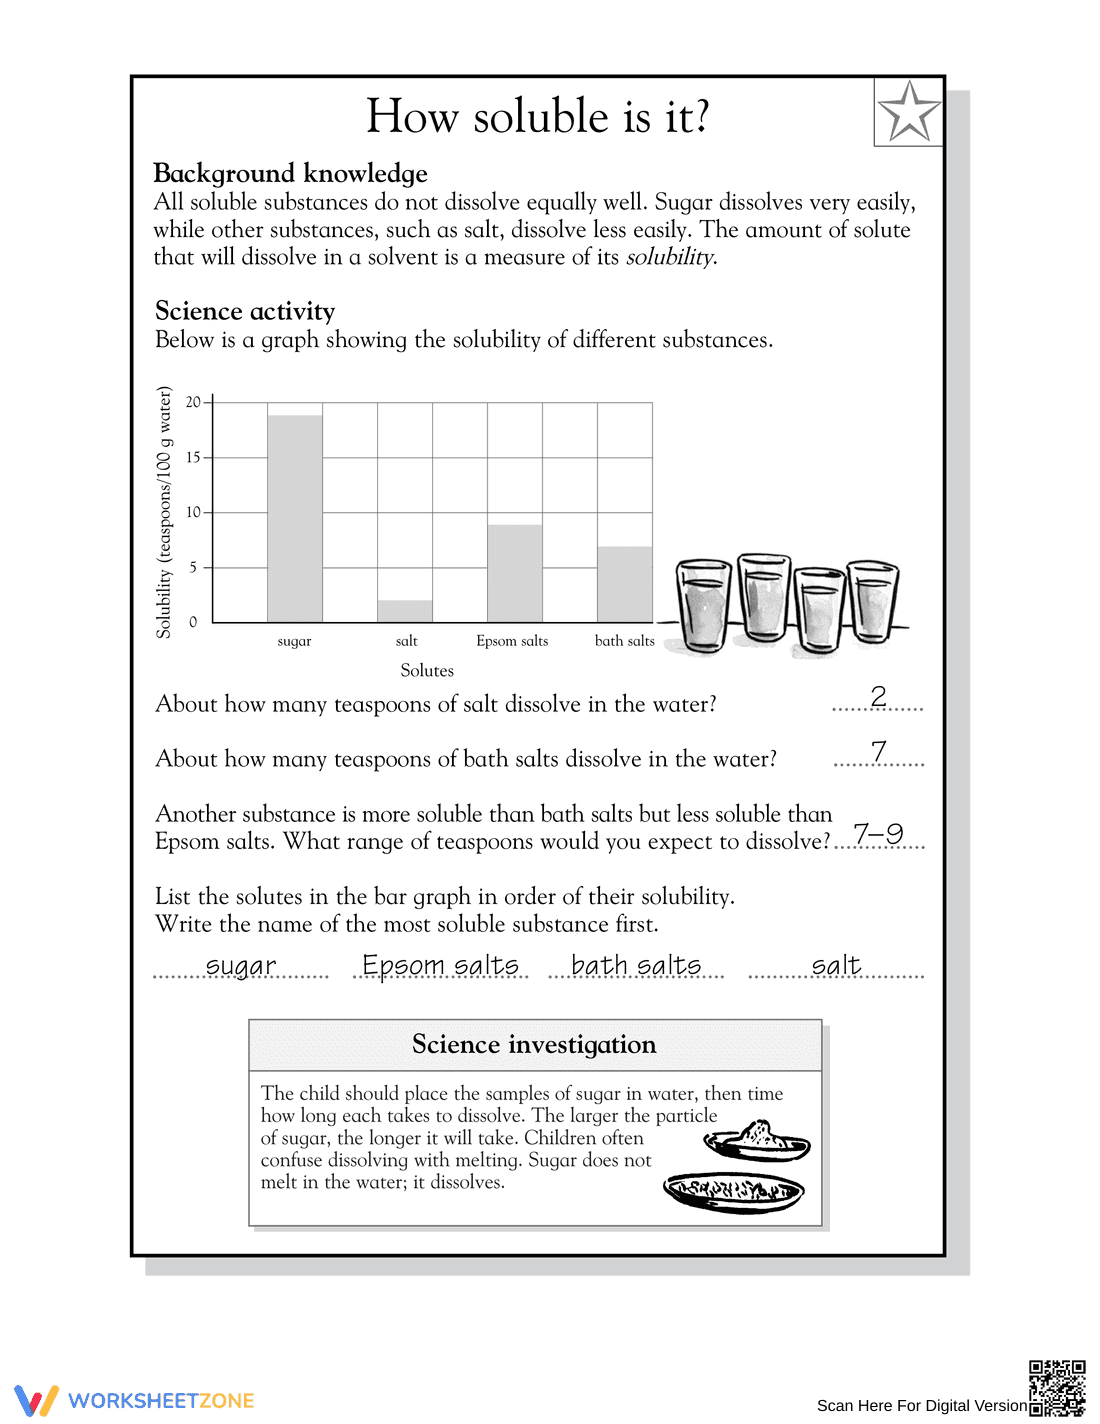
This Grade 5 science worksheet focuses on the fundamental property of solubility. By interpreting a detailed bar graph, students compare how different substances like sugar and salt dissolve in water. This essential practice helps learners move beyond basic observation toward quantitative data analysis, ensuring they understand that physical properties are measurable and predictable.
At a Glance
- Grade: 5 · Subject: Science
- Standard:
5-PS1-3— Identify materials based on their properties through observation and measurement- Skill Focus: Solubility and data interpretation
- Format: 1 page · 5 tasks · Answer key included · PDF
- Best For: Independent practice or quick formative assessment
- Time: 15–20 minutes
What's Inside
The worksheet features a clear "Background Knowledge" section defining solubility and solutes. A central bar graph displays the solubility rates of sugar, salt, Epsom salts, and bath salts in teaspoons per 100g of water. Students engage with four analytical questions that require data extraction and logical reasoning, followed by a "Science Investigation" prompt for hands-on extension.
Zero-Prep Workflow
- Print (30 seconds): Download and print the single-page PDF for your entire class.
- Distribute (1 minute): Hand out the worksheets as a transition into your science block.
- Review (2 minutes): Use the included answer key for rapid grading or peer review.
This resource serves as an ideal "grab-and-go" sub plan or a targeted reinforcement activity after a lab on mixtures and solutions.
Standards Alignment
This activity is strictly aligned to 5-PS1-3: "Make observations and measurements to identify materials based on their properties." It specifically addresses the property of solubility by requiring students to use a bar graph as a measurement tool. Both standard codes can be copied directly into lesson plans, IEP goals, or district curriculum mapping tools.
How to Use It
Use this worksheet during the "Explain" or "Elaborate" phase of a 5E lesson on matter. It provides the necessary bridge between hands-on dissolution experiments and formal data recording. For a formative assessment, observe if students can correctly identify the range for an unknown substance based on the graph’s established data points. Expected completion time is 15-20 minutes.
Who It's For
This resource is designed for Grade 5 students mastering physical science concepts. It provides scaffolds like clear labels and background text for English Language Learners and students with IEPs. It pairs naturally with a hands-on lab where students test the solubility of the same substances listed on the graph.
Aligned with the Next Generation Science Standards (NGSS), this worksheet supports the development of crosscutting concepts such as Scale, Proportion, and Quantity. According to RAND AIRS 2024, integrating data interpretation with domain-specific vocabulary—like "solute" and "solubility"—significantly improves long-term retention of scientific principles in upper elementary students. By requiring students to analyze 5-PS1-3 data points, the resource ensures learners are not merely memorizing definitions but are active participants in scientific practices. Fisher & Frey (2014) emphasize that such guided data analysis is a prerequisite for successful independent inquiry. This worksheet provides that necessary structure, allowing students to verify their understanding of physical properties before moving to complex experimental design. It is an essential component for any curriculum focusing on the structural properties of matter and its interactions in aqueous solutions.