


Views
Downloads
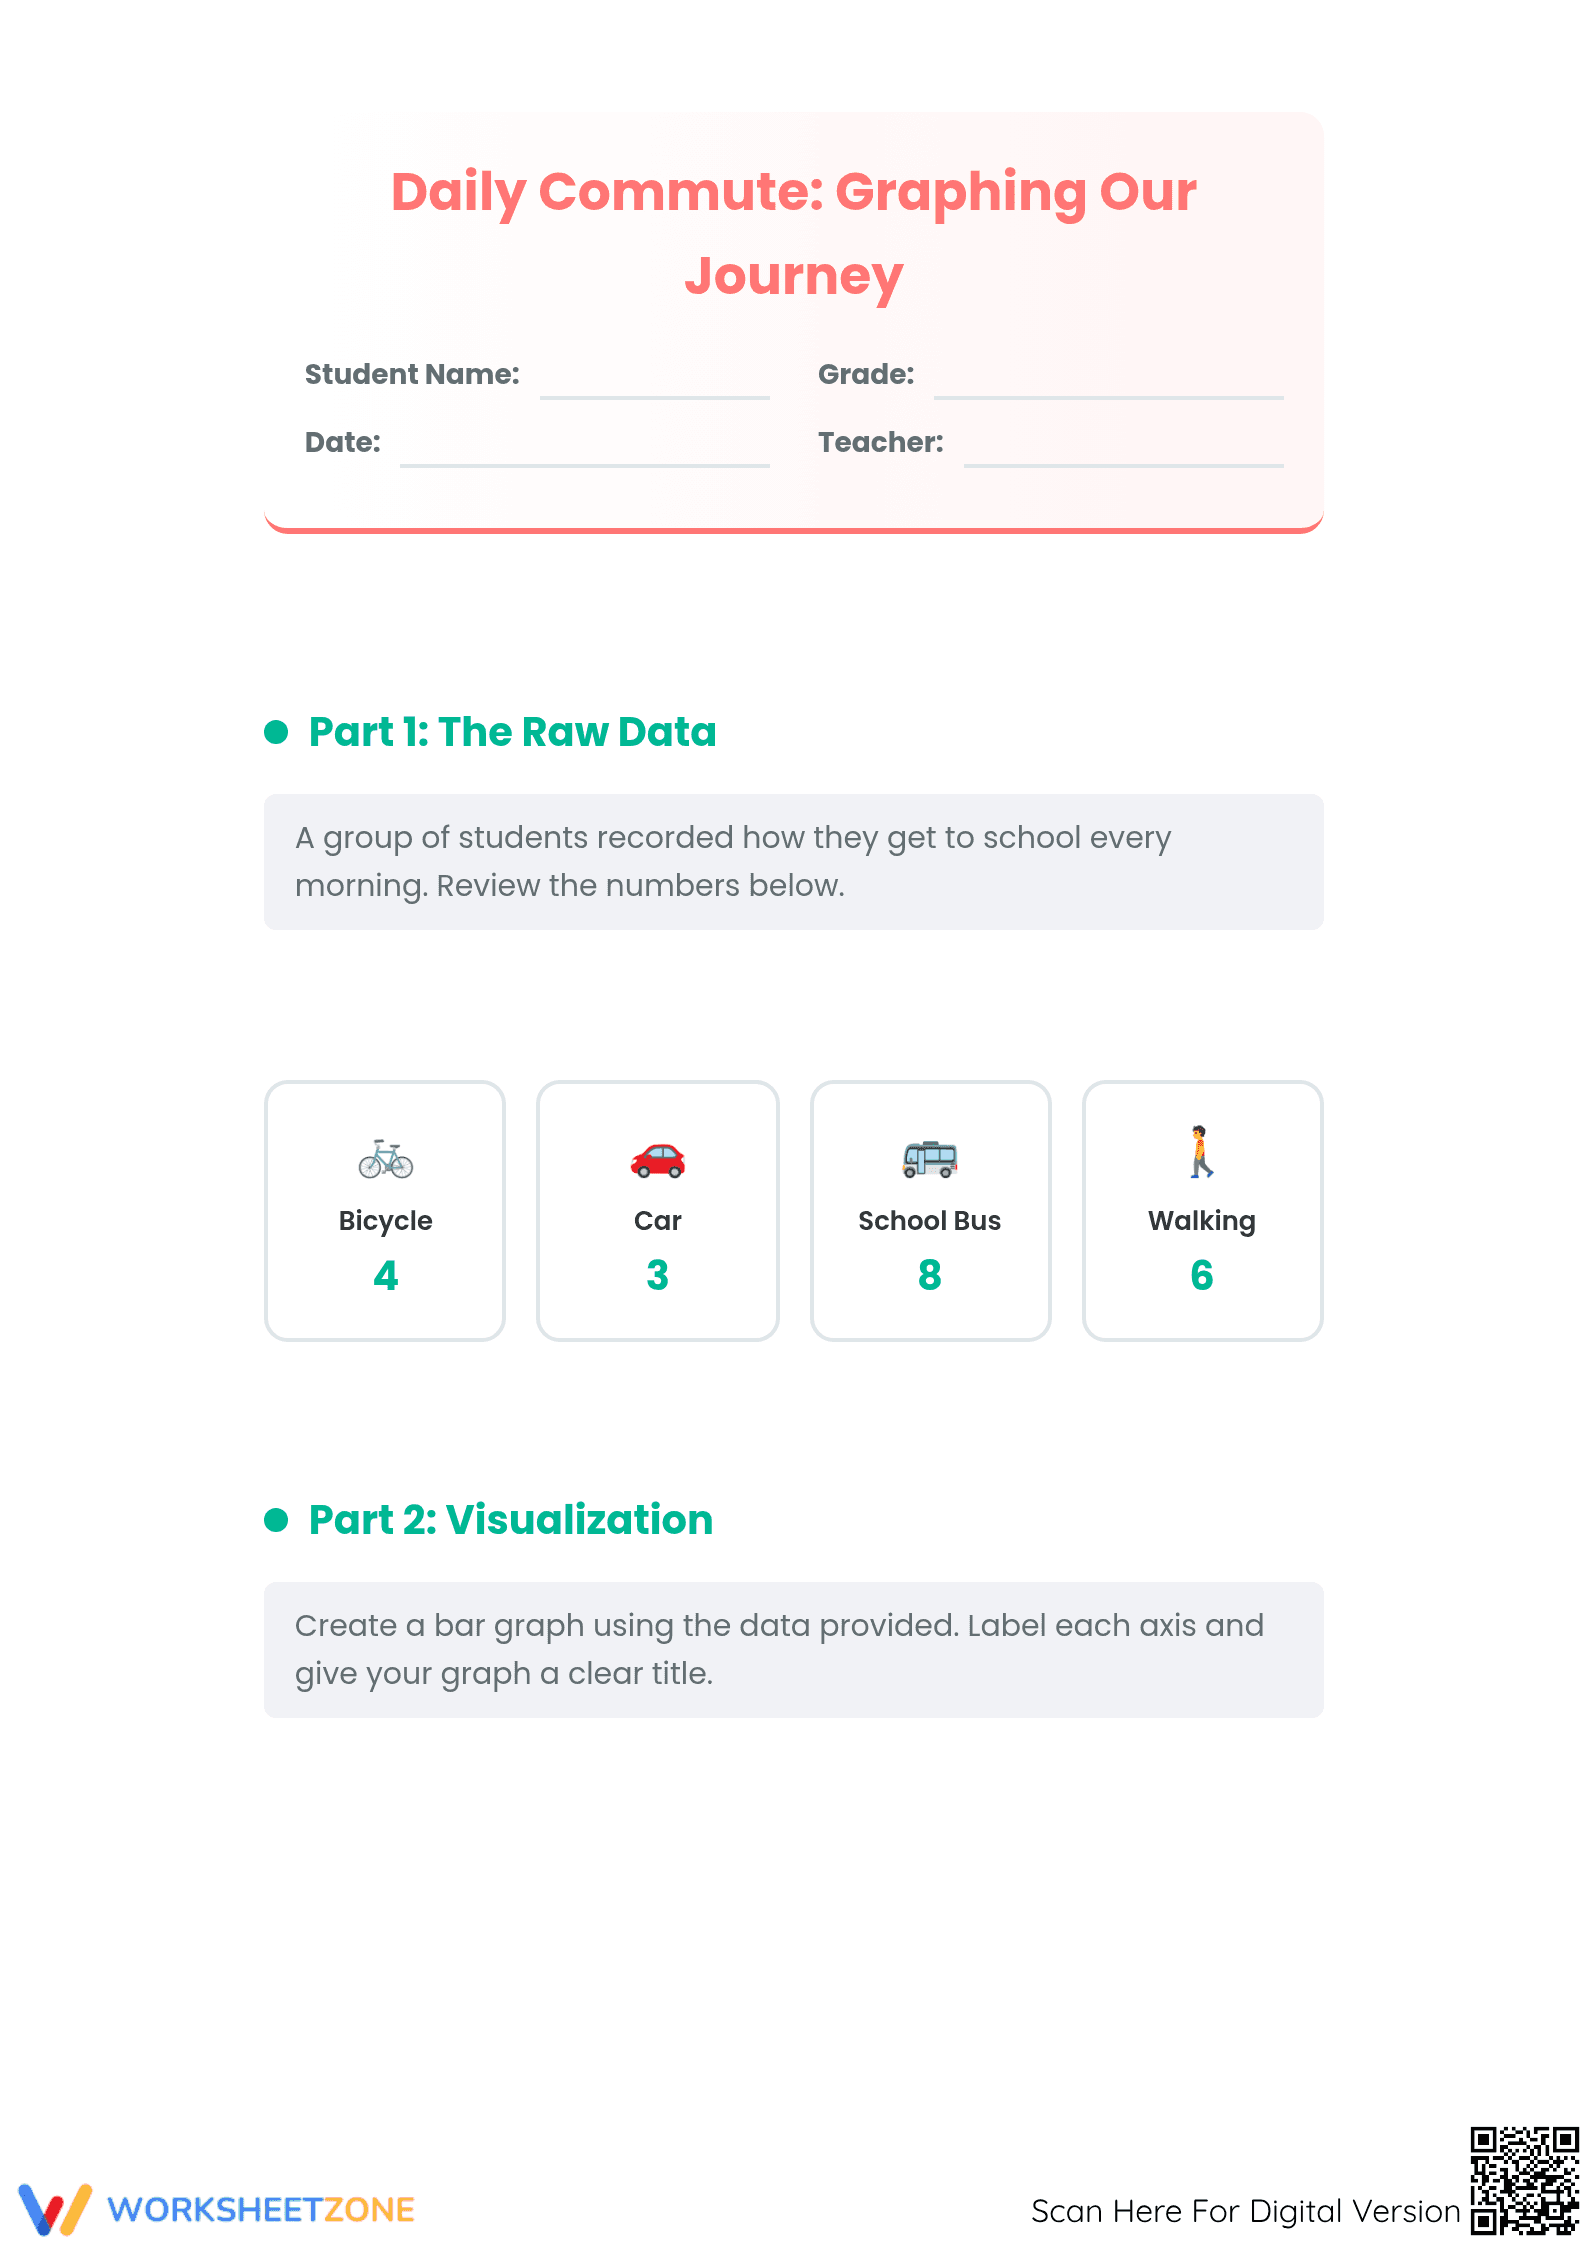
Printable Bar Graph Worksheet: How I Get to School (Grades 4-6)
Paste this activity's link or code into your existing LMS (Google Classroom, Canvas, Teams, Schoology, Moodle, etc.).
Students can open and work on the activity right away, with no student login required.
You'll still be able to track student progress and results from your teacher account.
Students master the transition from raw data to visual representation with this comprehensive bar graph activity. By organizing school commute statistics into a structured chart, learners develop essential analytical skills. This resource ensures students not only create graphs but also interpret data to solve complex multi-step problems and make logical predictions.
At a Glance
- Grade: 4-6 · Subject: Math
- Standard:
CCSS.MATH.CONTENT.3.MD.B.3— Draw scaled bar graphs and solve comparison problems using categorical data- Skill Focus: Bar Graph Construction & Data Analysis
- Format: 4 pages · 11 problems · Answer key included · PDF
- Best For: Independent practice or formative assessment
- Time: 25–35 minutes
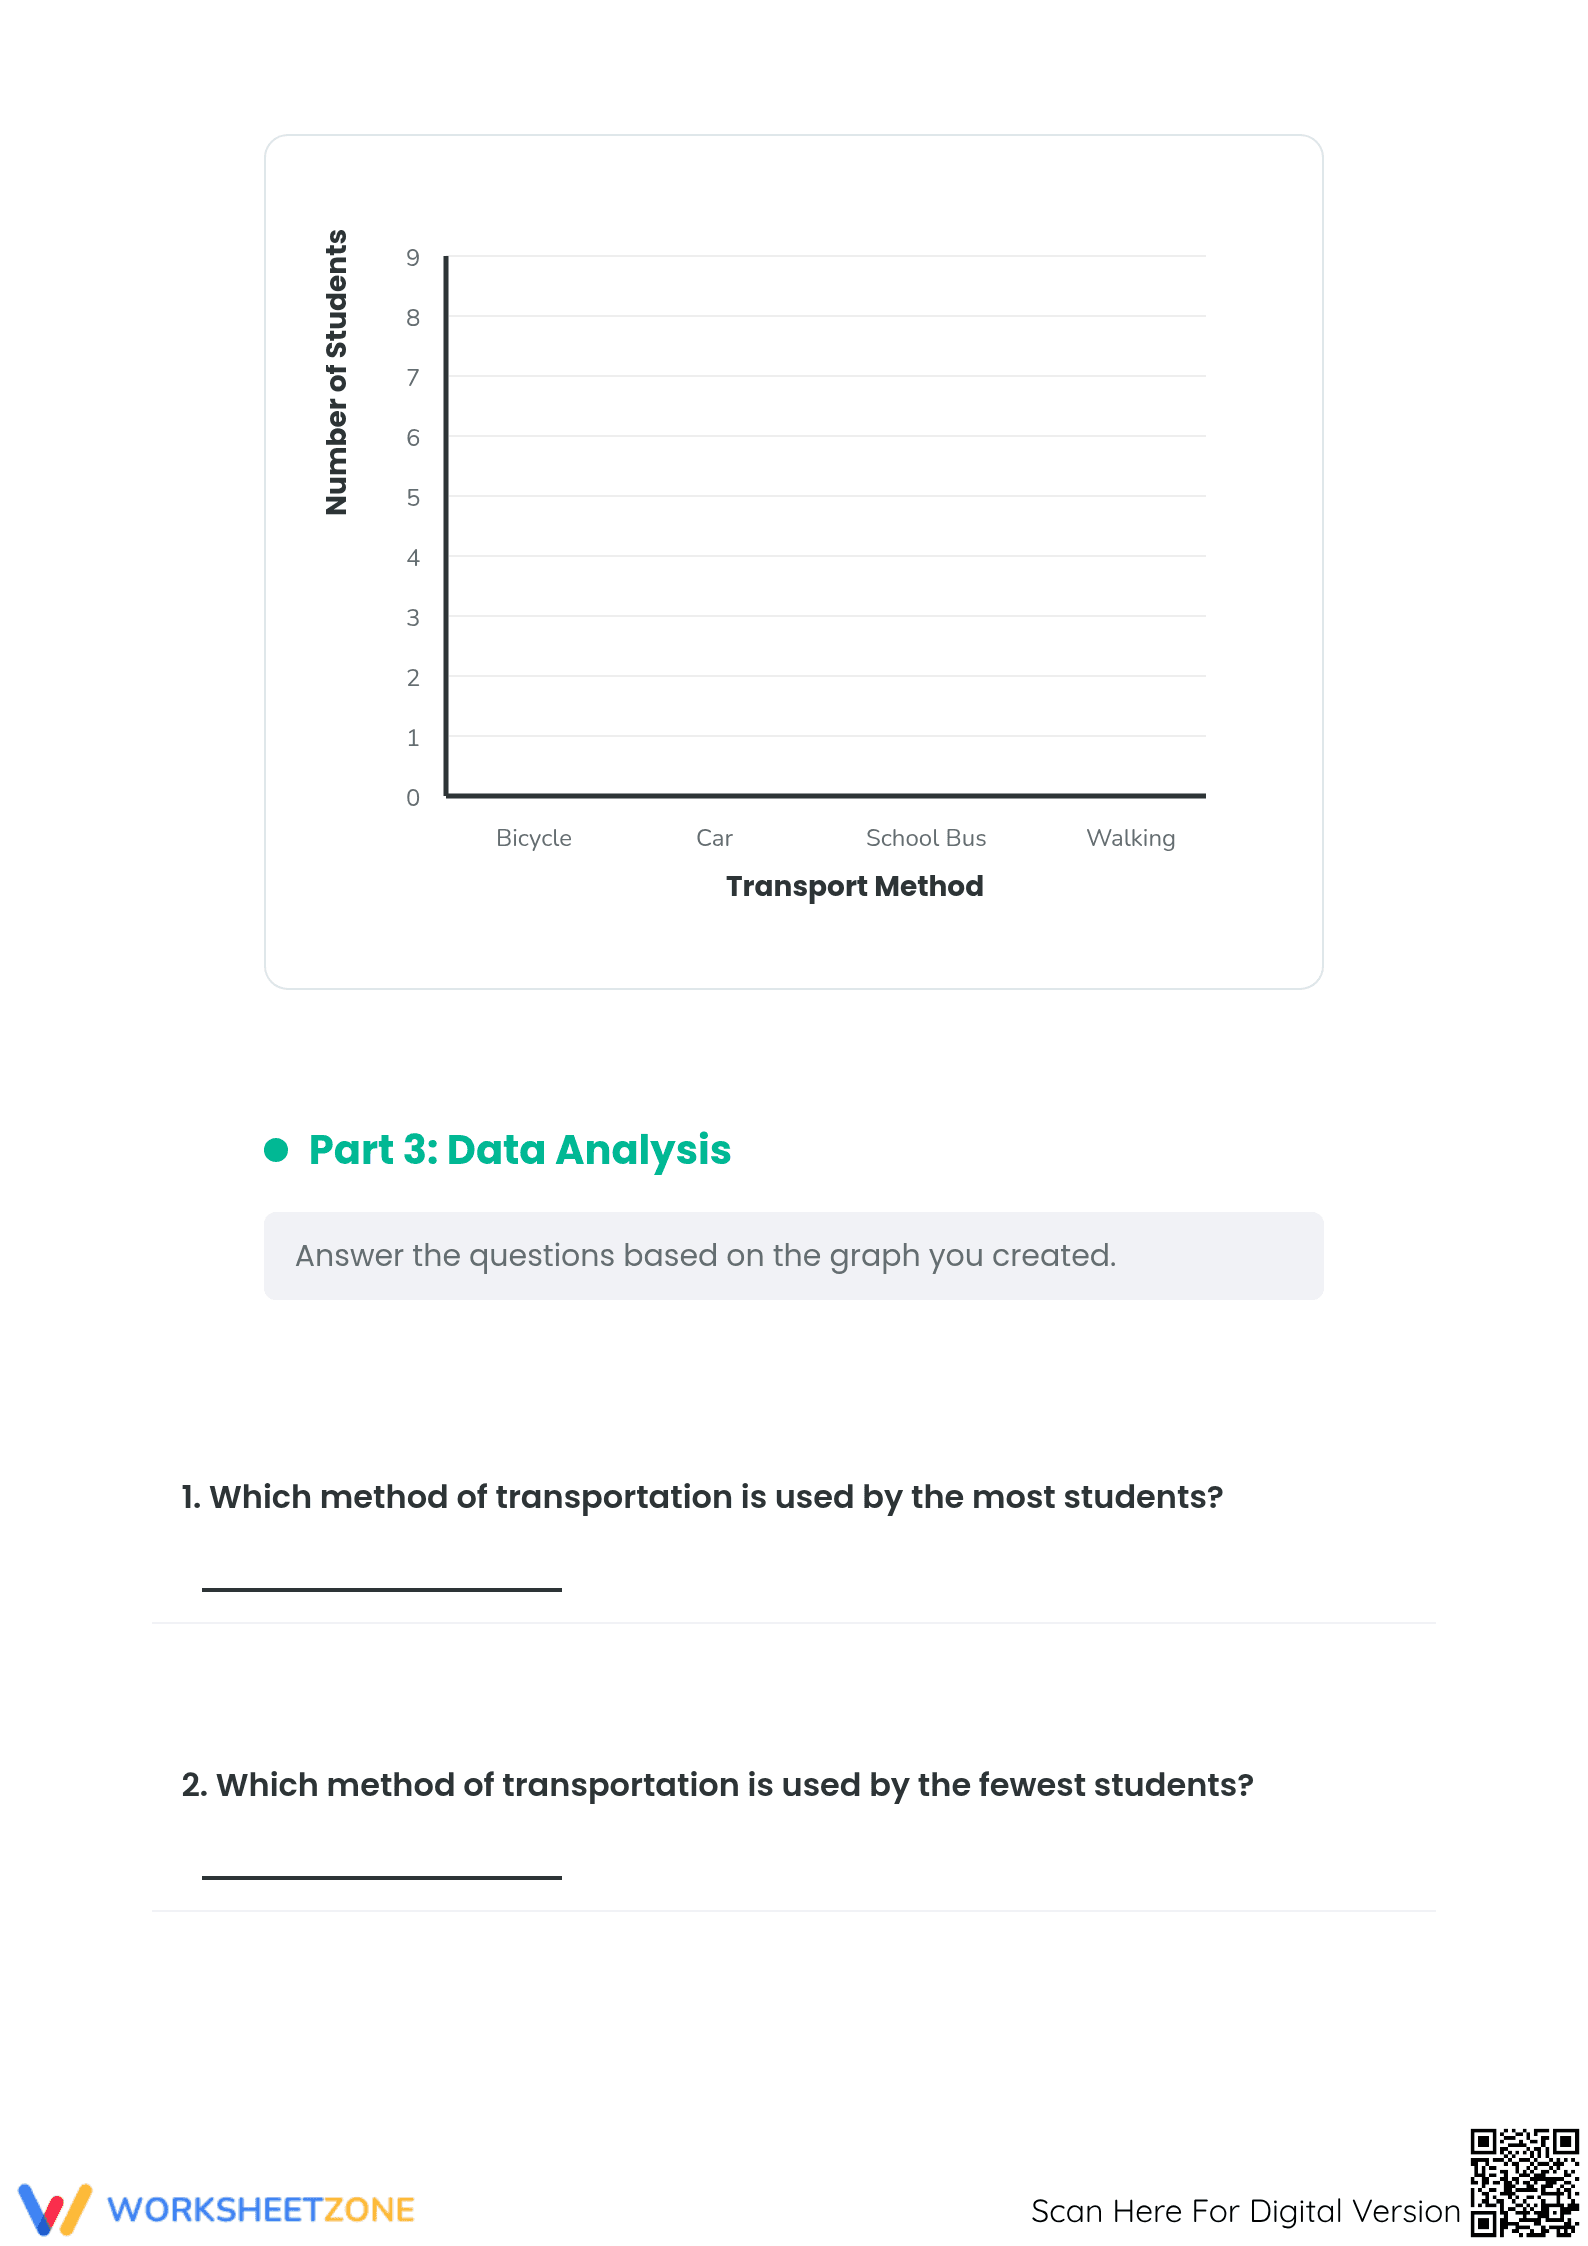
This 4-page PDF includes a raw data set featuring four commute methods: bicycle, car, school bus, and walking. Students are provided with a labeled grid to construct their own bar graph, including axes for "Number of Students" and "Transport Method." Following the visualization, eleven targeted questions guide students through data comparison, total calculation, and predictive reasoning.
Skill Progression
- Guided practice: Students begin by reviewing four distinct data points and transferring them to a pre-labeled graphing grid to establish visual accuracy.
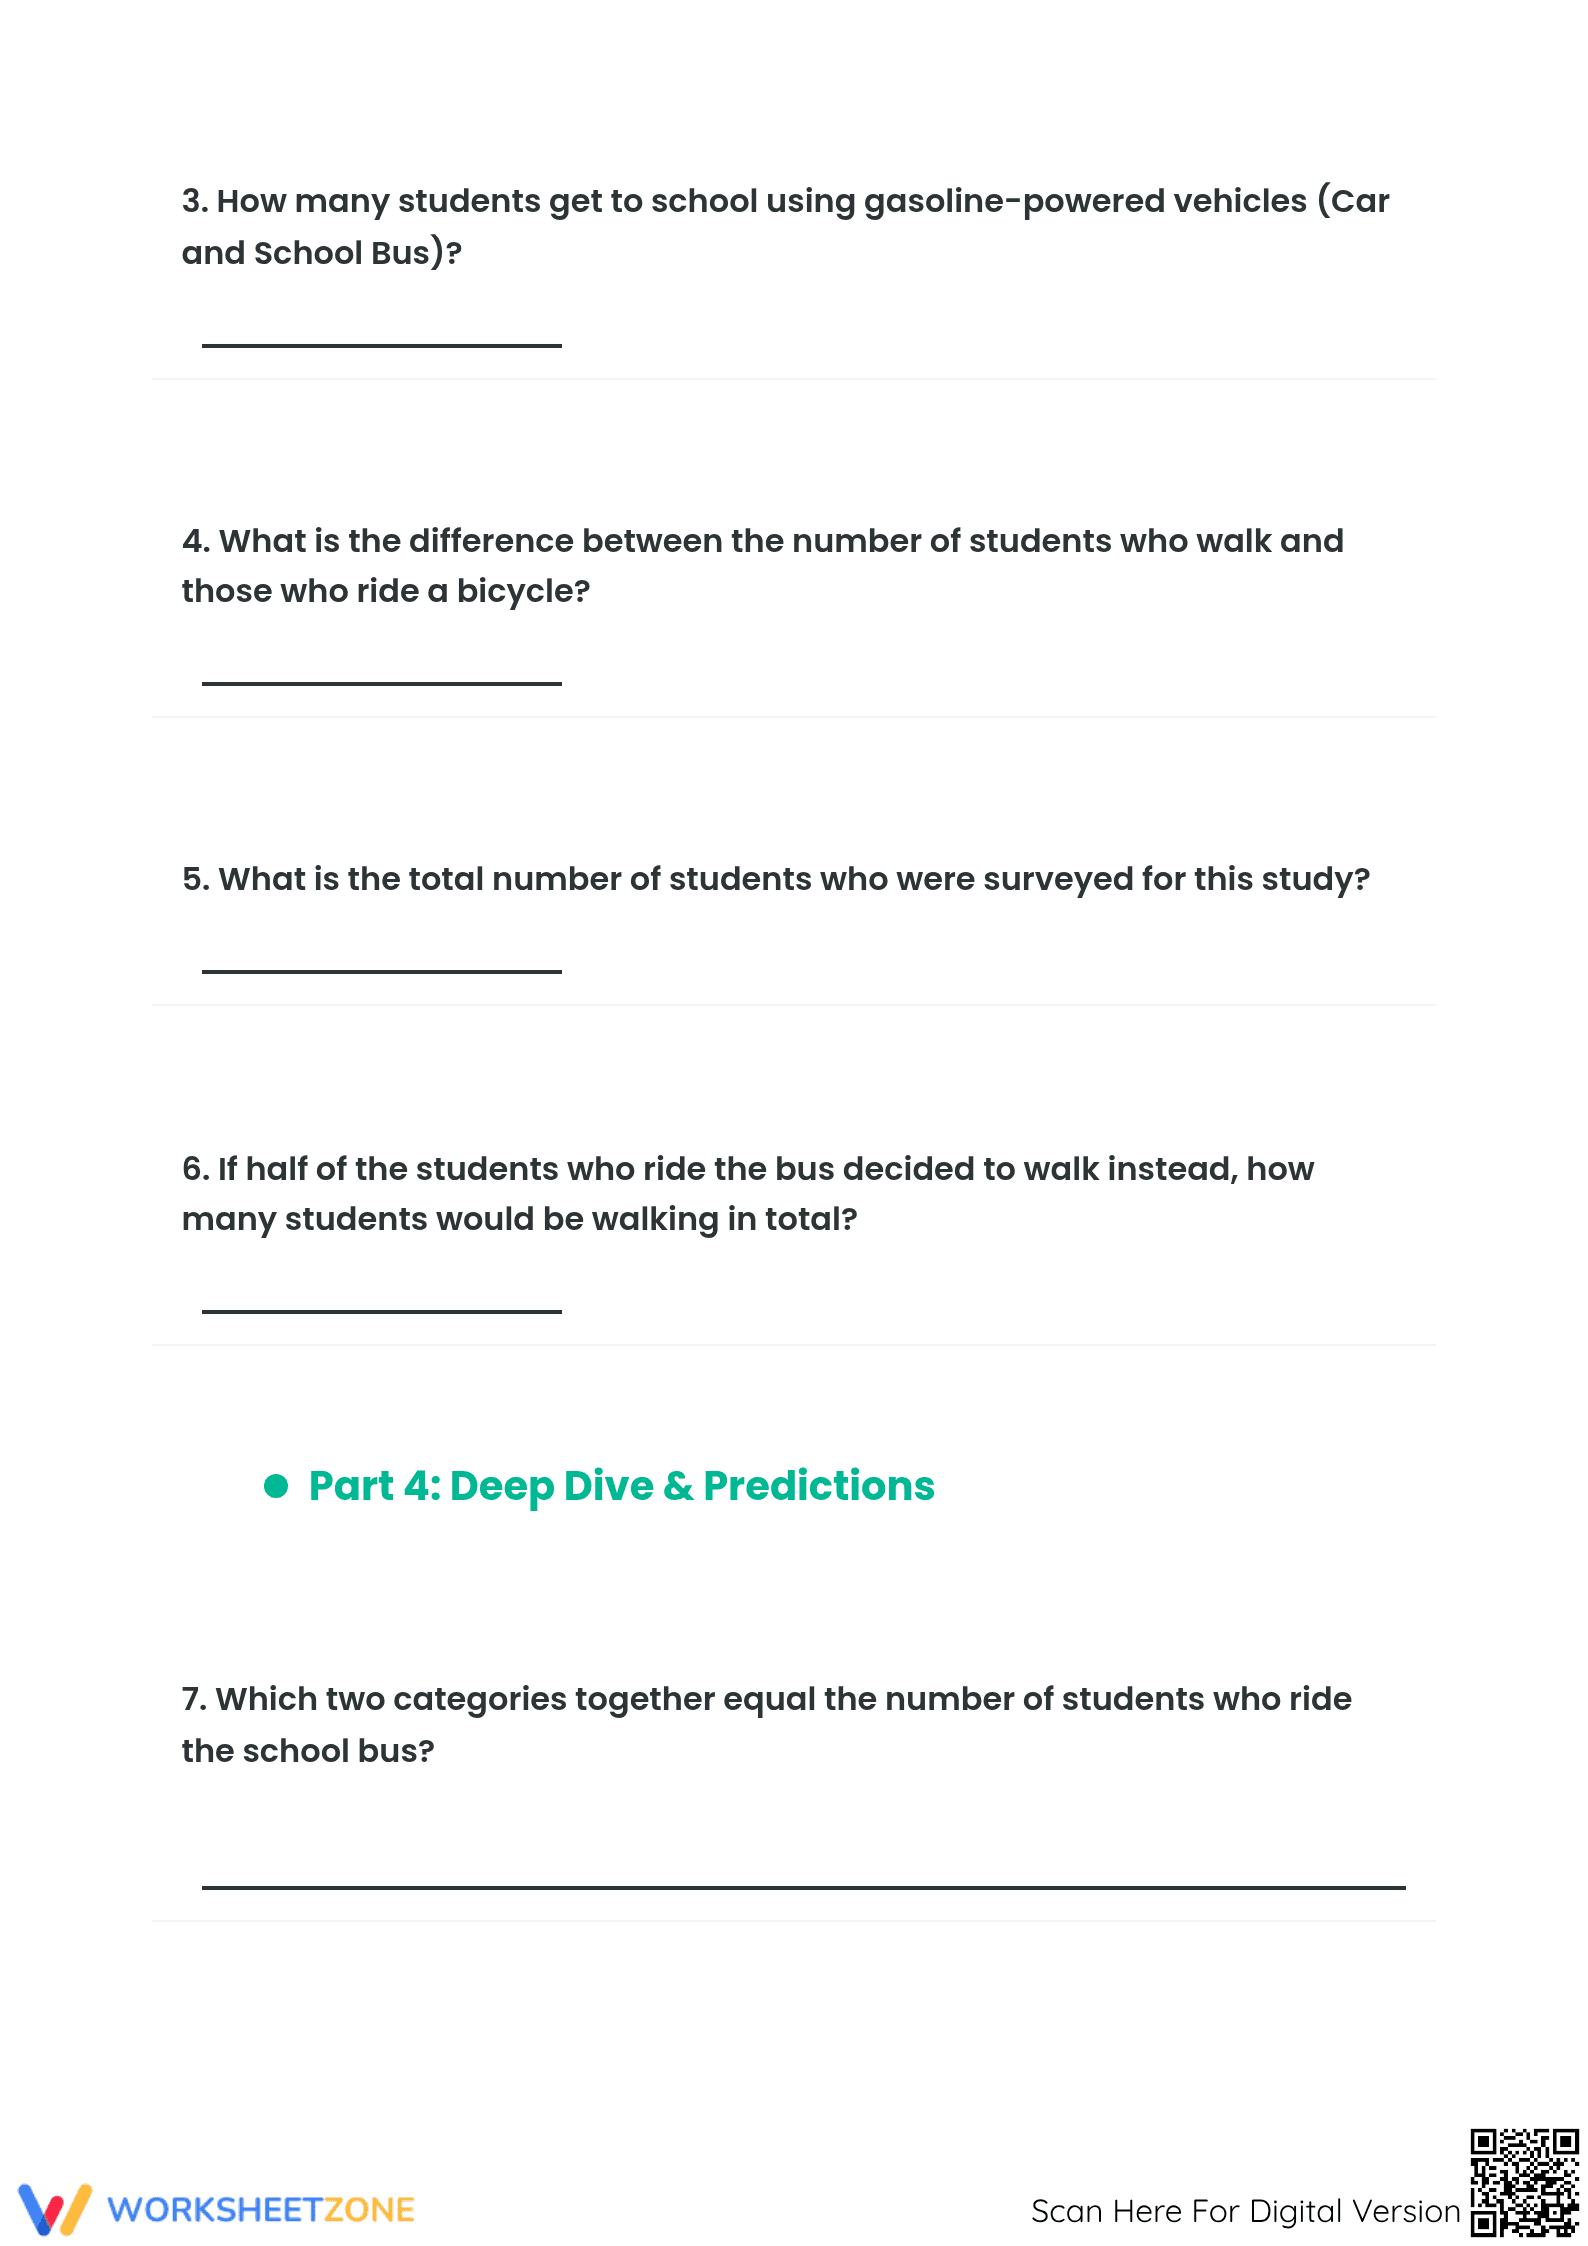
- Supported practice: Six data analysis questions require students to identify extremes (most/least) and perform basic operations like finding differences between categories.
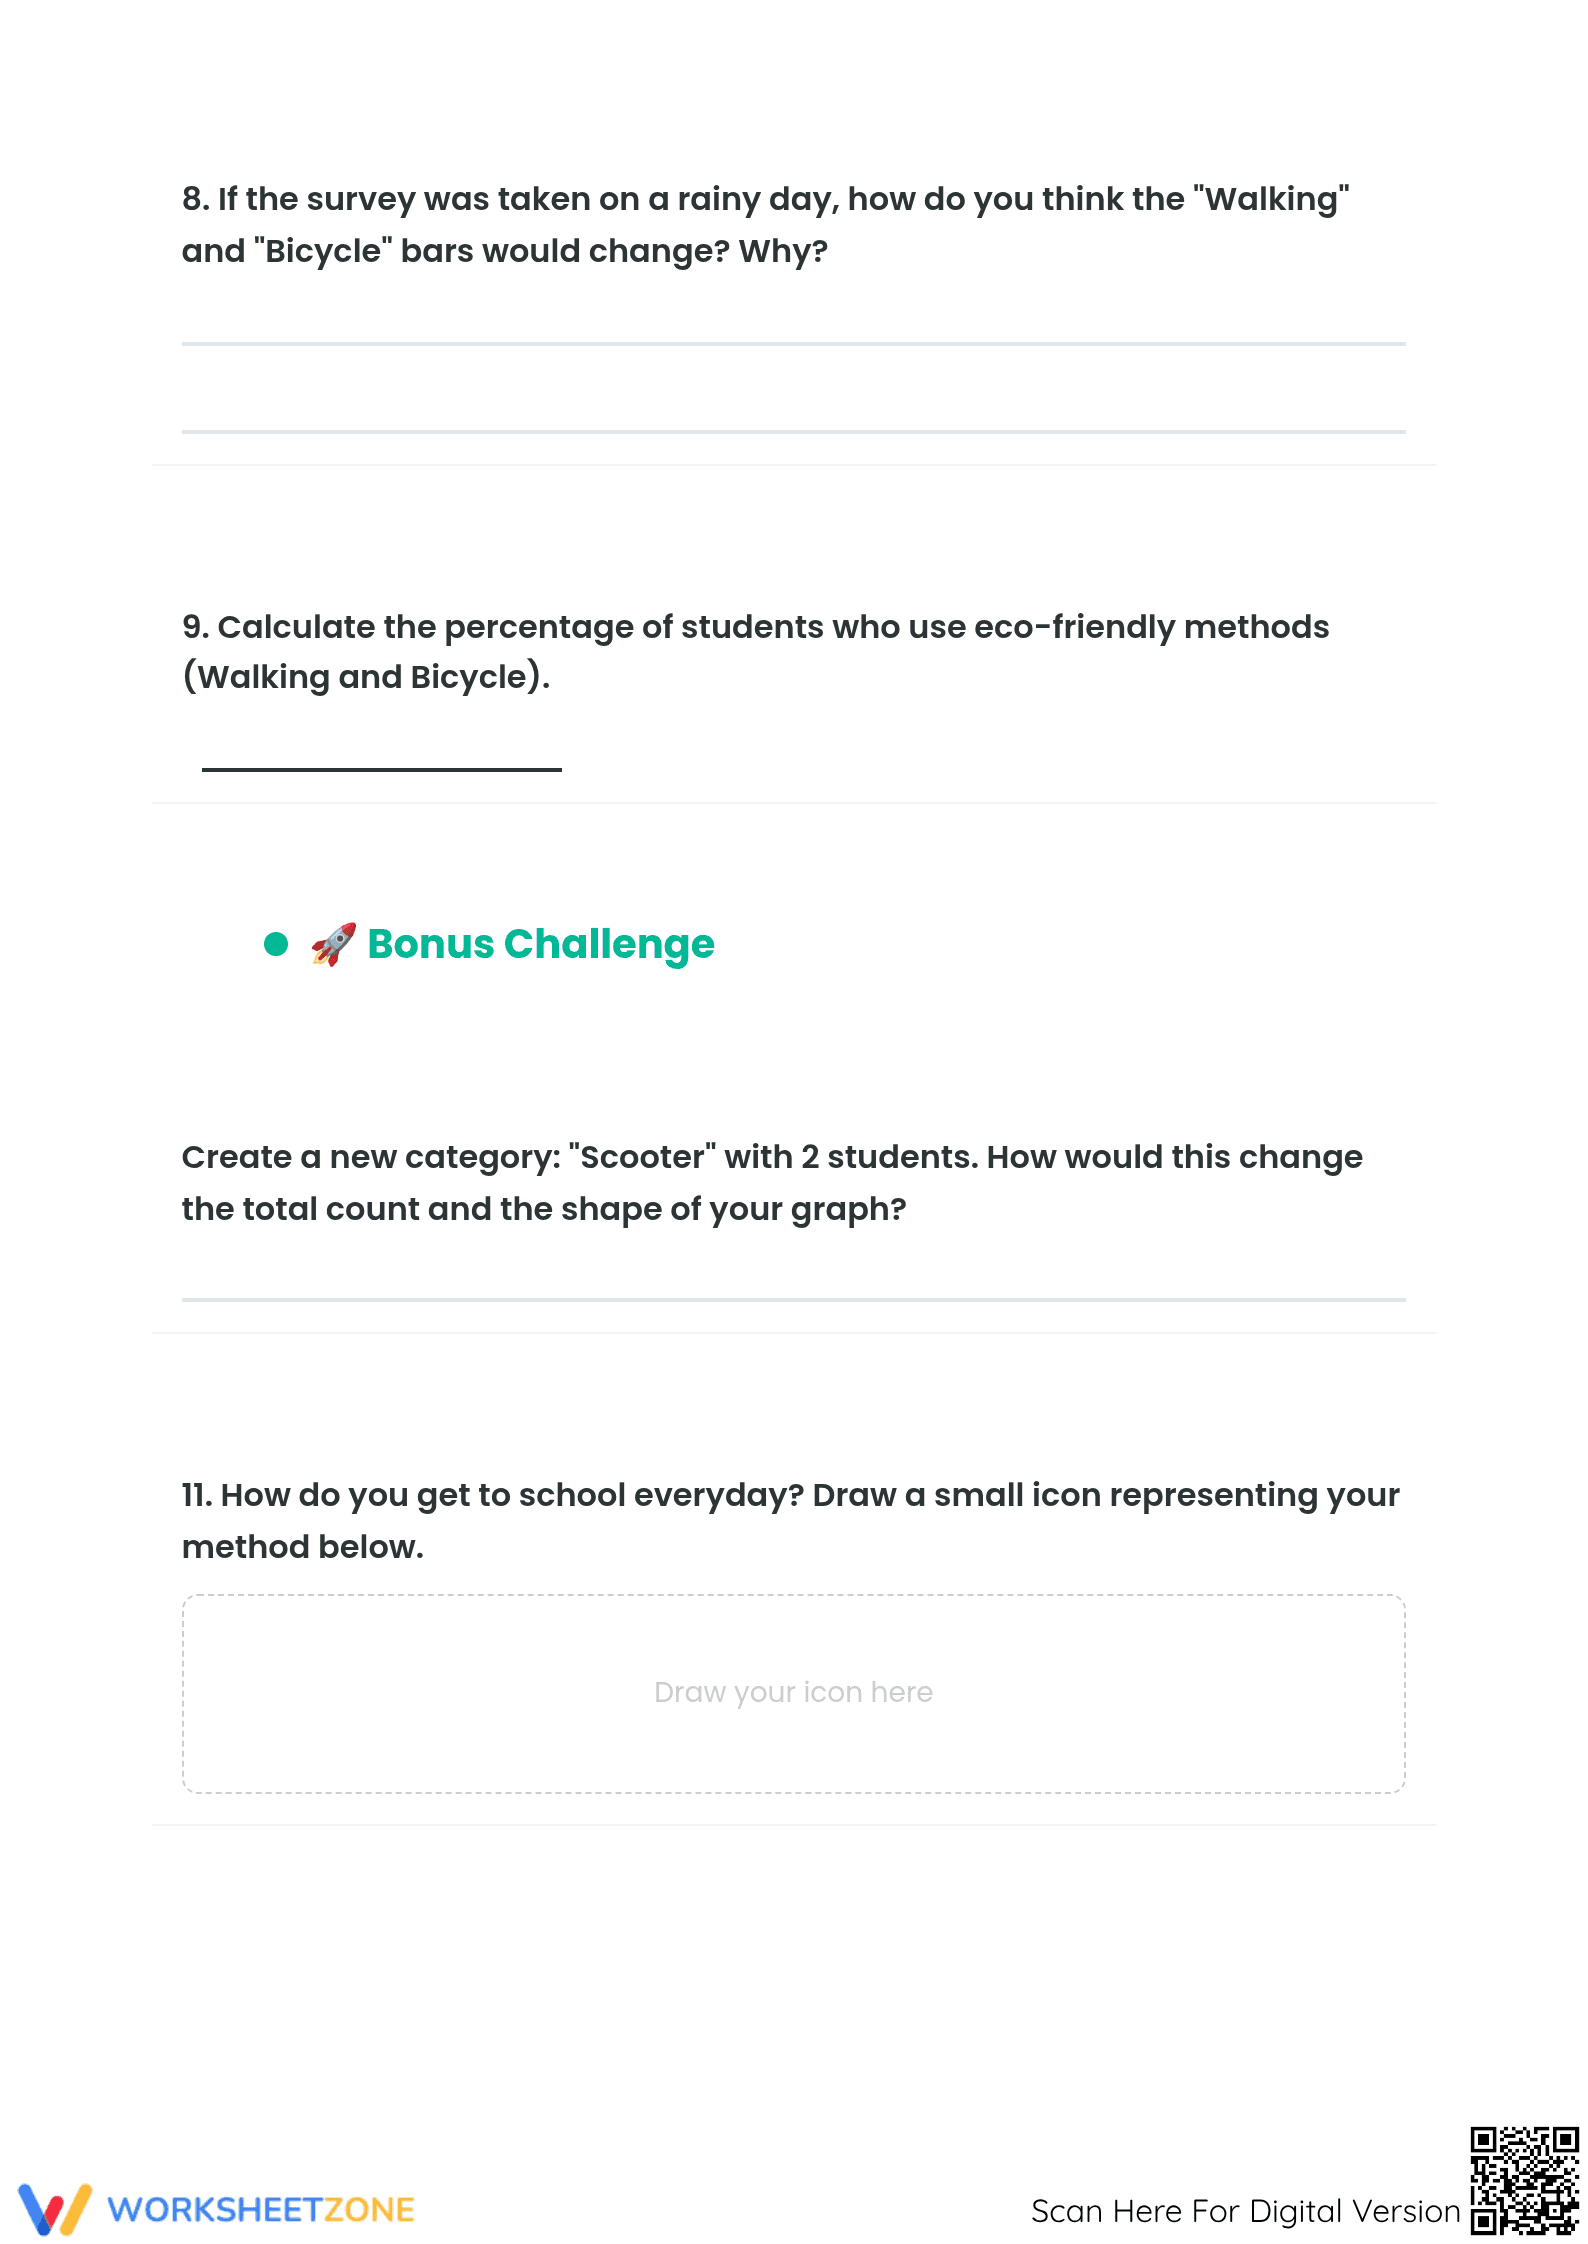
- Independent practice: Advanced "Deep Dive" and "Bonus Challenge" sections prompt students to calculate percentages and predict how external variables like weather might shift the data distribution.
This sequence supports the gradual release of responsibility, moving from basic representation to higher-order evaluative thinking.
Standards Alignment
The primary alignment is CCSS.MATH.CONTENT.3.MD.B.3, which focuses on drawing scaled bar graphs to represent data sets with several categories. This resource also supports higher-grade interpretation requirements by asking students to analyze percentages and categorical shifts. This standard code can be copied directly into lesson plans, IEP goals, or district curriculum mapping tools.
How to Use It
Use this worksheet as a concluding activity for a unit on data representation or as a standalone sub plan. During instruction, observe how students label their graph bars to ensure they maintain consistent scaling. Students typically require 30 minutes to complete the graphing and the analytical questions, making it an ideal mid-week formative check.
Who It's For
This resource is designed for upper elementary students in Grades 4 through 6 who are refining their ability to move beyond simple counting to data interpretation. It serves as a natural pairing resource for a social studies lesson on community or a science unit involving data collection and observation summaries.
According to the RAND AIRS 2024 report on mathematics education, the ability to translate discrete data points into visual representations is a critical predictor of later success in algebraic reasoning and statistical literacy. This worksheet directly addresses this developmental need by requiring students to interact with CCSS.MATH.CONTENT.3.MD.B.3 through both construction and critique. By asking students to justify how environmental factors like rainy weather might alter a bar graph, the task moves beyond rote calculation into higher-order evaluative thinking. This aligns with modern pedagogical standards that prioritize data-informed decision-making over simple chart replication. Research indicates that when students participate in the full lifecycle of data—from raw numbers to visualization to interpretive analysis—they retain the underlying mathematical concepts 40% more effectively than through passive observation alone. This 4-page resource provides the necessary breadth to facilitate this deep cognitive engagement.