


Views
Downloads
Essential Homeostasis Worksheet | Grade 9-12 Biology
Paste this activity's link or code into your existing LMS (Google Classroom, Canvas, Teams, Schoology, Moodle, etc.).
Students can open and work on the activity right away, with no student login required.
You'll still be able to track student progress and results from your teacher account.
This Grade 9-12 biology worksheet helps students master the complex concepts of homeostasis and feedback mechanisms. By analyzing real-world physiological scenarios and graphing clinical data, learners develop a concrete understanding of how the human body maintains internal stability. Students will successfully differentiate between positive and negative feedback loops through evidence-based reasoning.
At a Glance
- Grade: 9-12 · Subject: Biology
- Standard:
HS-LS1-3— Plan and conduct an investigation to provide evidence that feedback mechanisms maintain homeostasis.- Skill Focus: Feedback Loop Identification & Data Graphing
- Format: 2 pages · 9 problems · Answer key included · PDF
- Best For: High school anatomy and physiology units
- Time: 30–45 minutes
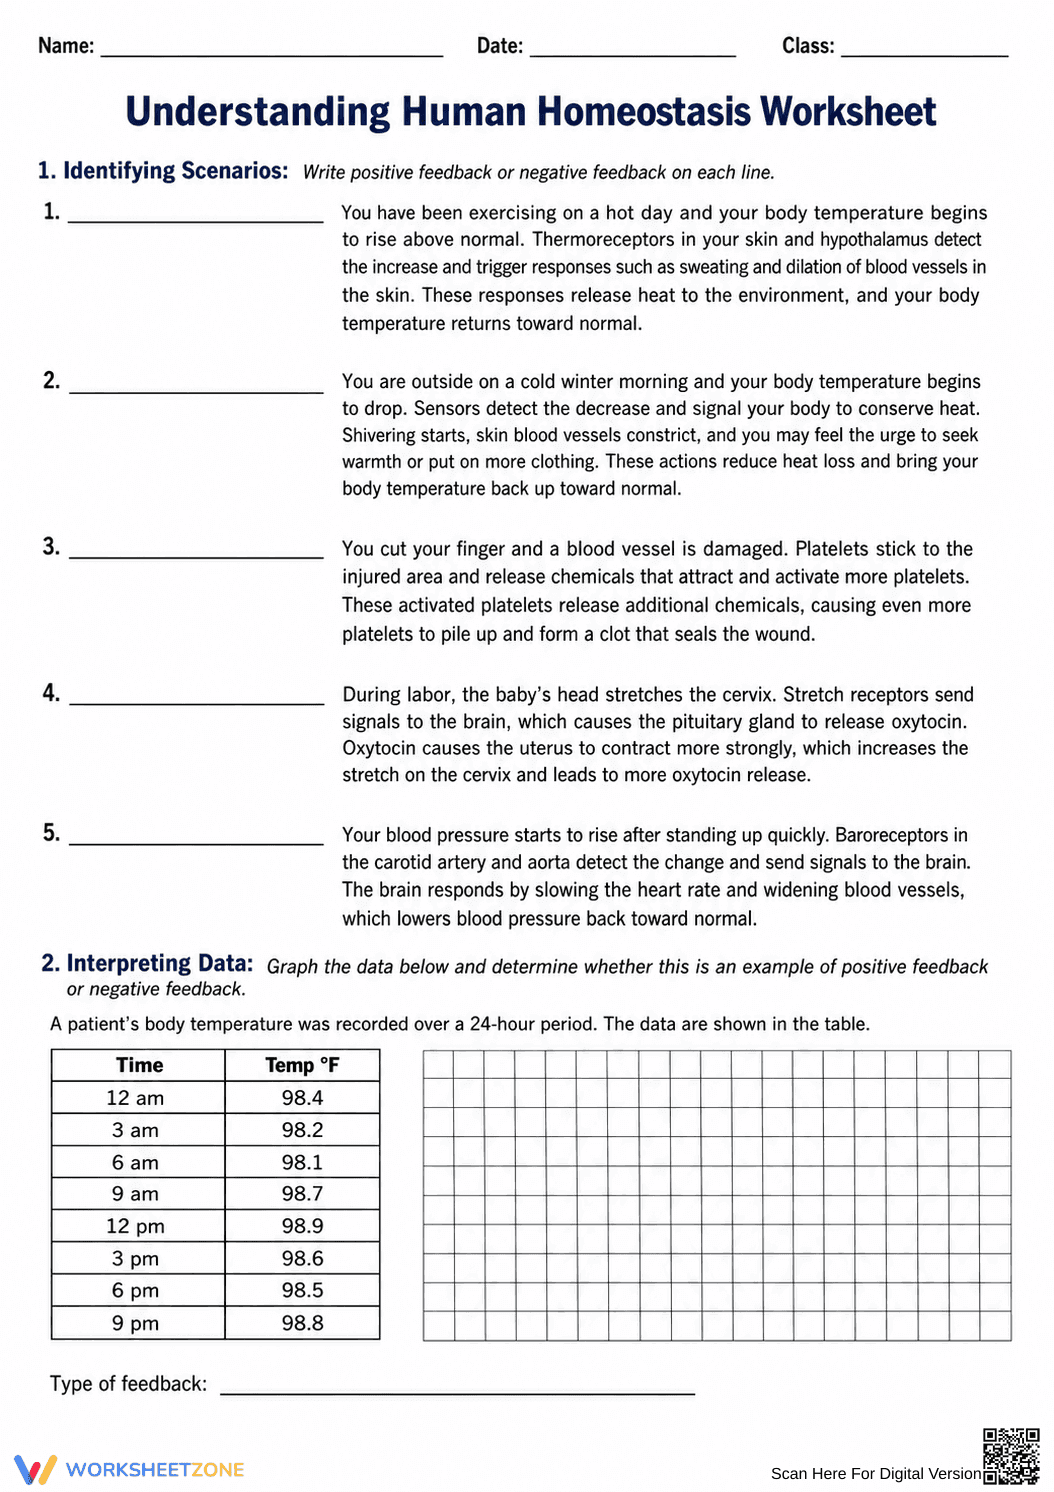
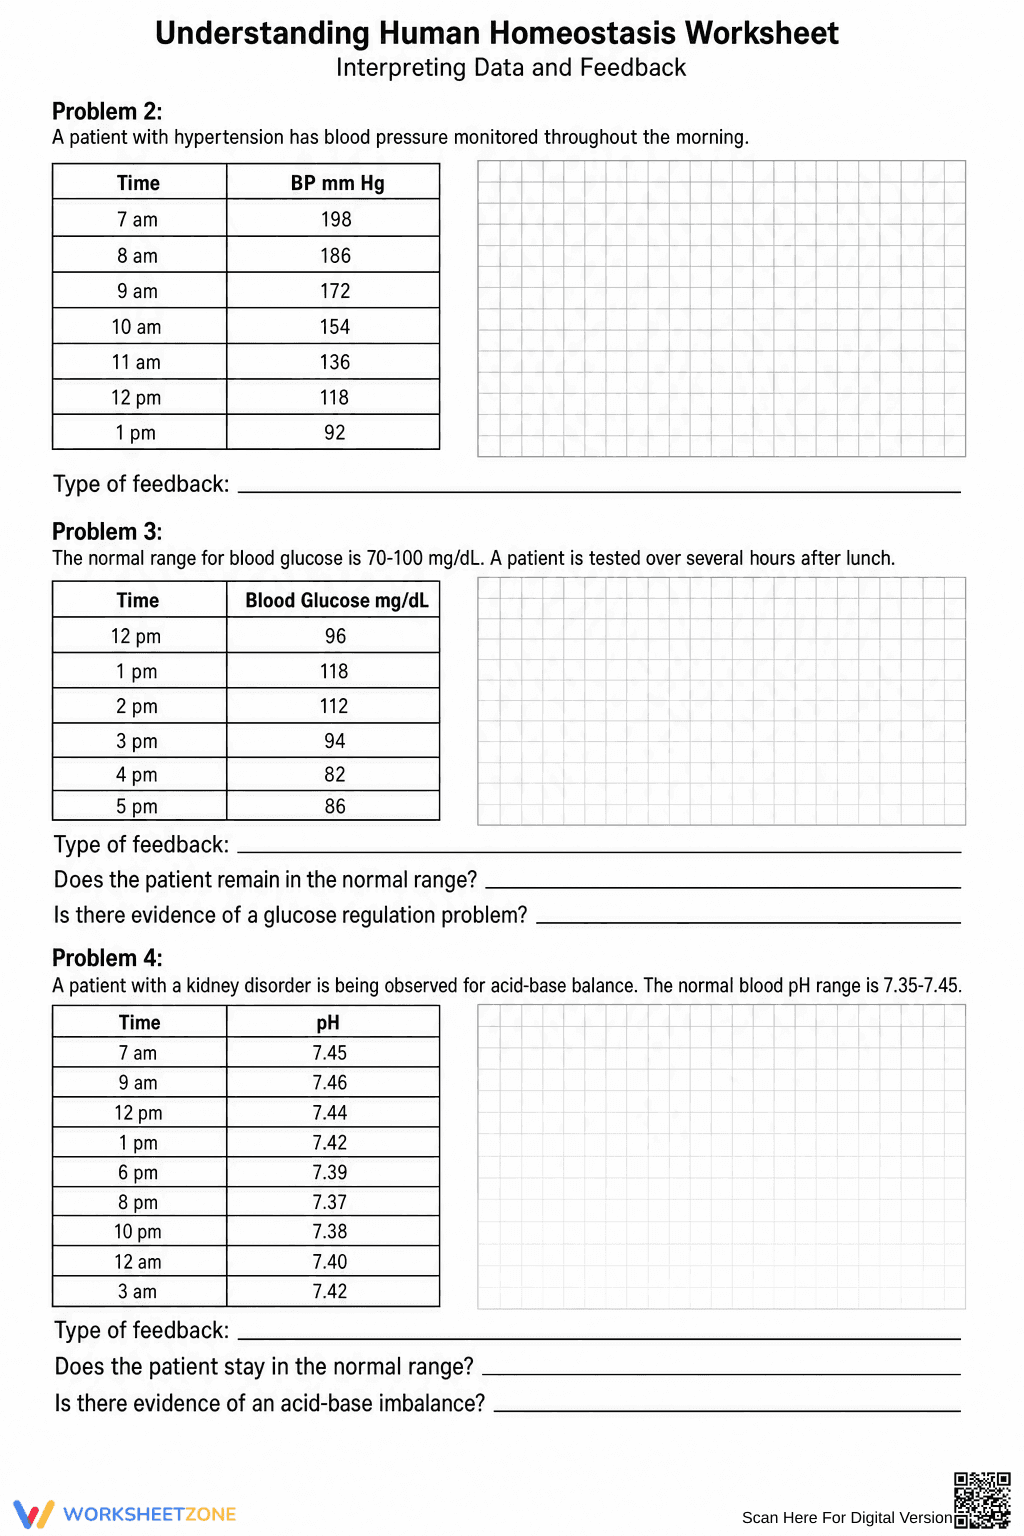
This comprehensive 2-page PDF features two distinct sections designed for cognitive depth. The first page includes five detailed physiological scenarios—ranging from thermoregulation to blood clotting—where students must identify the feedback type. The second page provides four data-heavy problems requiring students to plot clinical variables like blood glucose and pH levels on provided grids to visualize homeostatic trends.
Skill Progression
- Guided practice: 5 scenario-based prompts provide descriptive cues to help students recognize the direction of physiological change and the body's response.
- Supported practice: 4 data interpretation tables include pre-formatted graphing grids, reducing the setup time so students can focus on trend analysis.
- Independent practice: Synthesis questions require students to conclude whether a patient remains within a normal range based on their own plotted evidence.
This resource follows a gradual-release model, moving from conceptual identification to active data visualization and clinical conclusion.
Standards Alignment
The primary focus is `HS-LS1-3`, which requires students to understand how feedback mechanisms maintain homeostasis. This worksheet provides the evidence portion of the standard by having students analyze data sets for temperature, blood pressure, and pH. Both standard codes can be copied directly into lesson plans, IEP goals, or district curriculum mapping tools.
How to Use It
Use this worksheet during the Elaborate phase of a lesson cycle after students have been introduced to the definitions of feedback loops. It serves as an excellent formative assessment; teachers should observe if students correctly identify the amplification in the oxytocin scenario versus the correction in the thermoregulation scenario. Completion typically takes 35 minutes.
Who It's For
This resource is tailored for high school biology or anatomy students. It is particularly effective for visual learners who benefit from seeing numerical data transformed into line graphs. Pair this with a direct instruction lesson on the endocrine system or a lab simulation on exercise and heart rate.
According to the HS-LS1-3 framework, students must move beyond rote memorization to explain how organisms respond to internal and external changes. This homeostasis worksheet facilitates this by requiring students to interpret 4 distinct clinical data sets, a method supported by Fisher & Frey (2014) as essential for developing disciplinary literacy in science. By engaging with scenarios like blood clotting and pH balance, students build the mental models necessary to understand complex system interactions. Research from the NAEP indicates that students who can successfully translate data between tables and graphs show higher proficiency in scientific inquiry. This 2-page resource provides the structured practice needed to bridge the gap between abstract biological theory and concrete data analysis, ensuring students are prepared for rigorous laboratory investigations and standardized assessments in the life sciences.