


0
Views
0
Downloads
0.0
0
Save
0 Likes
Halloween Data Graphing and Analysis for Grade 8
0 Views
0 Downloads
Paste this activity's link or code into your existing LMS (Google Classroom, Canvas, Teams, Schoology, Moodle, etc.).
Students can open and work on the activity right away, with no student login required.
You'll still be able to track student progress and results from your teacher account.
Information
Description
What It Is:
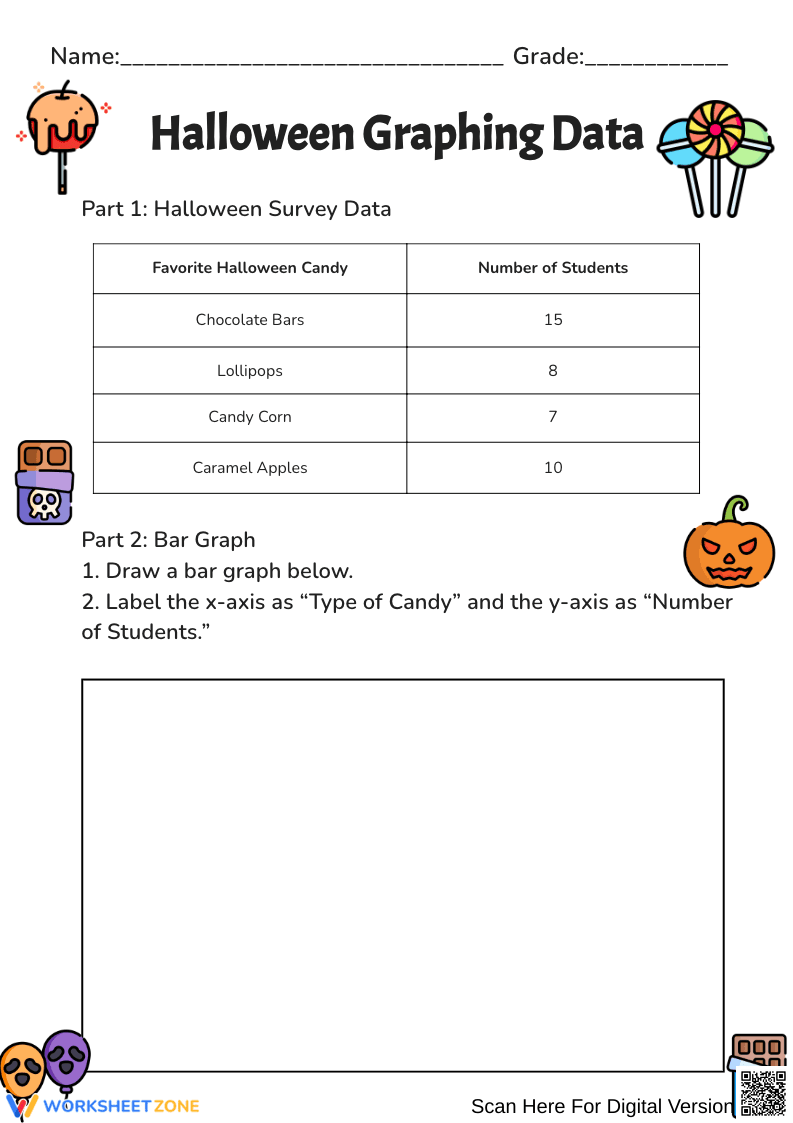
An advanced Halloween-themed math worksheet where Grade 8 students analyze and represent survey data about favorite Halloween candies. This activity challenges students to create accurate bar graphs, interpret patterns, and discuss trends using real-world data.
Why Use It:
This worksheet strengthens data literacy, graphing accuracy, and analytical reasoning skills. By connecting math concepts to a Halloween theme, it encourages critical thinking, creativity, and engagement during seasonal lessons.
How to Use It:
• Review the provided Halloween candy data table.
• Draw a scaled bar graph with clear axis labels and intervals.
• Analyze your results: Which candy is most popular? Which is least? What’s the total number of participants?
• Add a short written interpretation summarizing your findings.
Grade Suitability:
Designed for Grade 8 students.
• Focuses on proportional reasoning, data representation, and real-world analysis.
• Ideal for middle school graphing and statistics units.
Target Users:
• Grade 8 math teachers incorporating holiday-themed lessons.
• Students practicing graphing and interpretation for real-world datasets.
• Parents or tutors reinforcing math skills through festive activities.