


Views
Downloads
Graphing Inequalities — Printable High School Worksheet
Paste this activity's link or code into your existing LMS (Google Classroom, Canvas, Teams, Schoology, Moodle, etc.).
Students can open and work on the activity right away, with no student login required.
You'll still be able to track student progress and results from your teacher account.
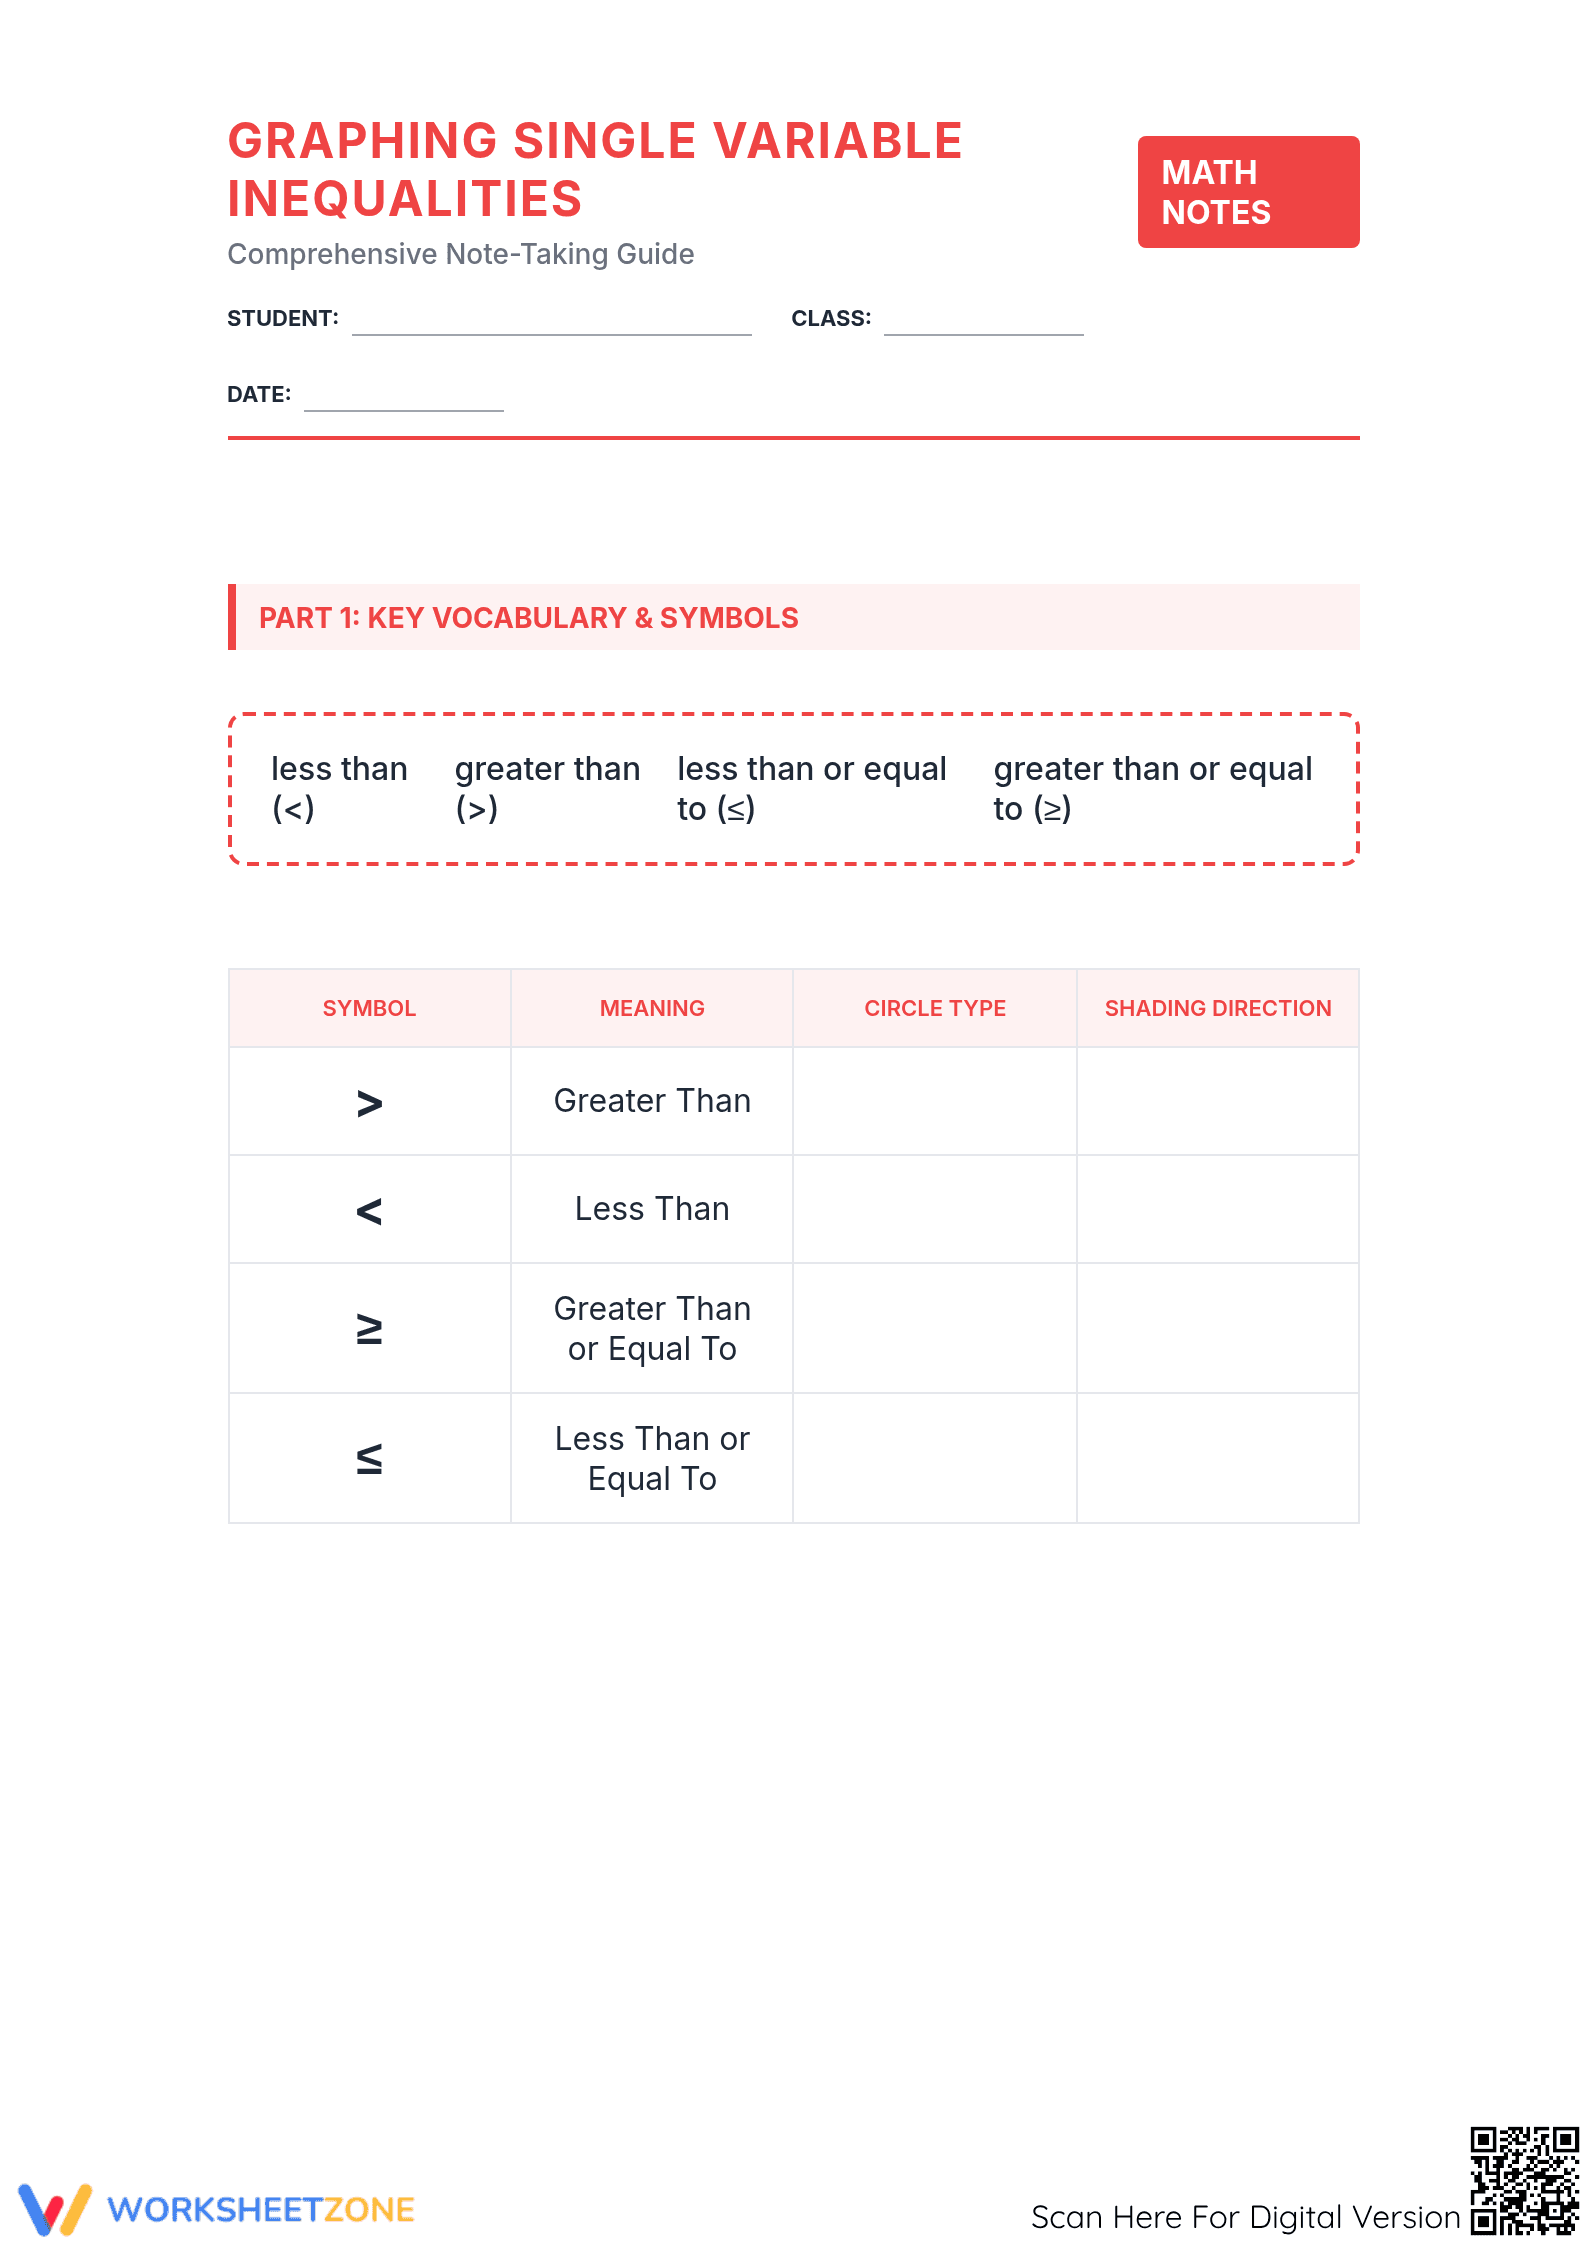
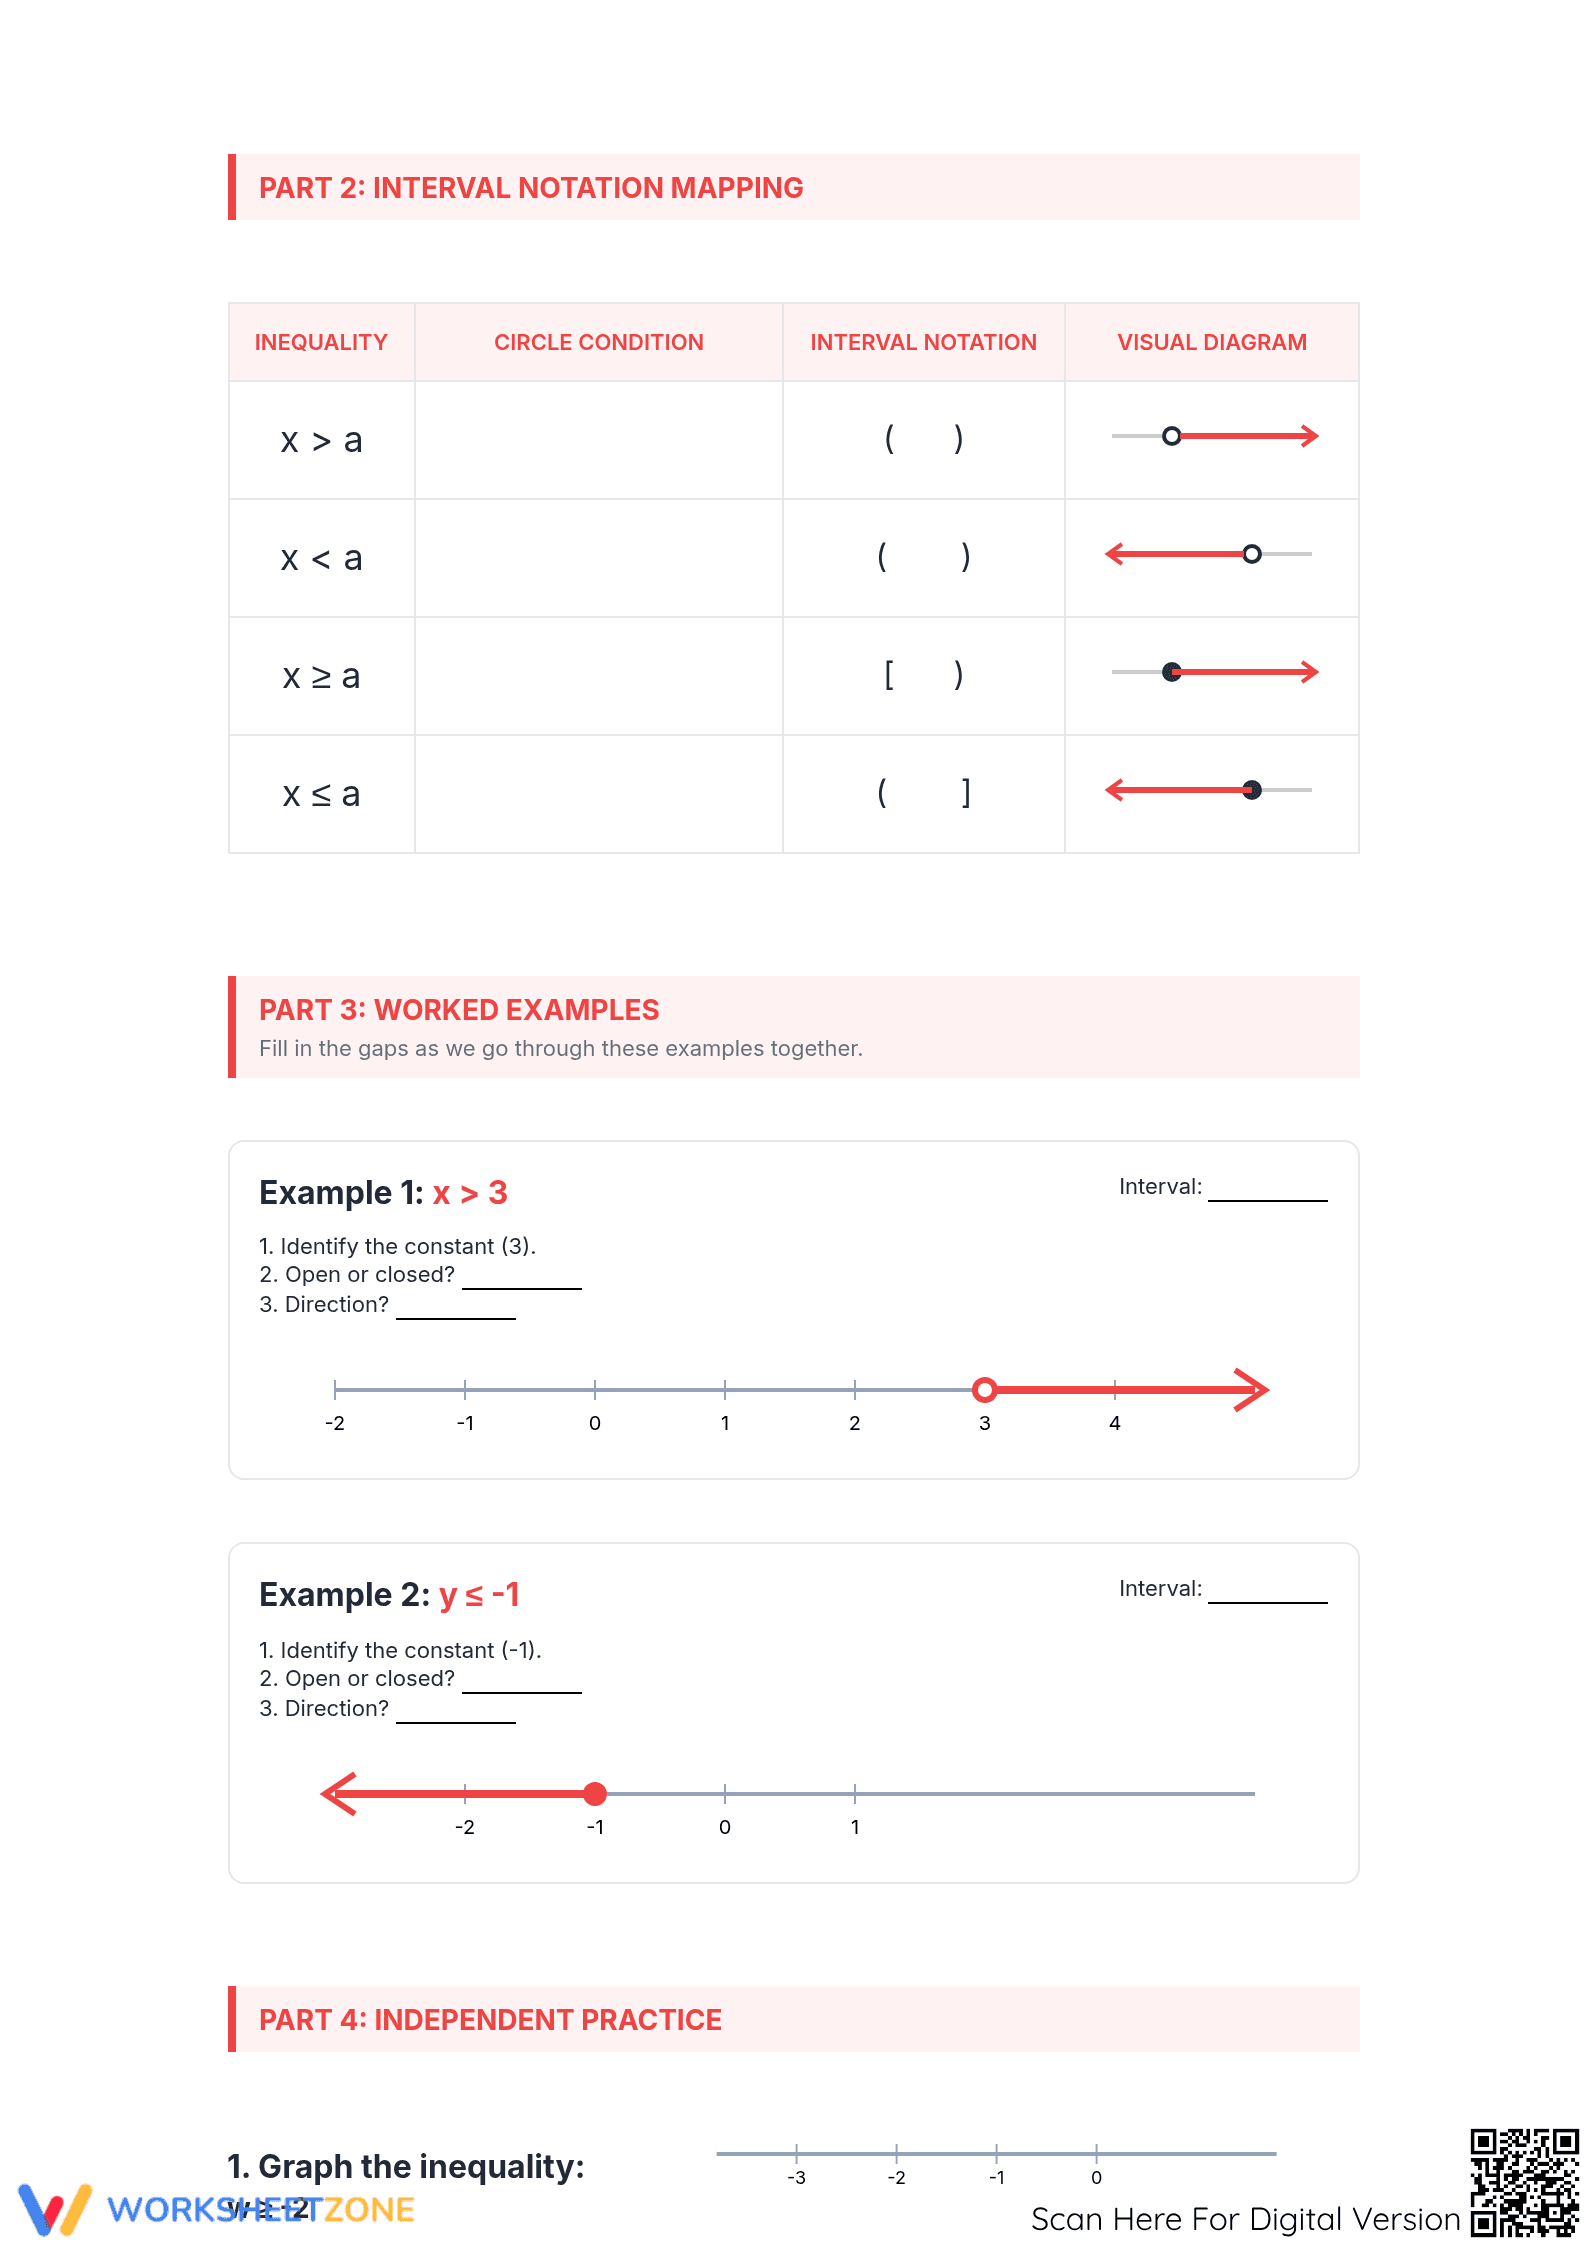
This high school math resource provides comprehensive notes and targeted practice for graphing single-variable inequalities on a number line. Students will learn to represent solutions visually, correctly using open and closed circles, and apply their understanding through a set of structured problems, building a foundational skill for Algebra.
At a Glance
- Grade: 8–12 · Subject: Algebra
- Standard:
CCSS.MATH.CONTENT.HSA.REI.B.3— Solve linear inequalities in one variable and represent solutions on a number line.- Skill Focus: Graphing single-variable inequalities
- Format: 3 pages · 12 problems · Answer key included · PDF
- Best For: Guided notes, independent practice, sub plans
- Time: 25–40 minutes
What's Inside
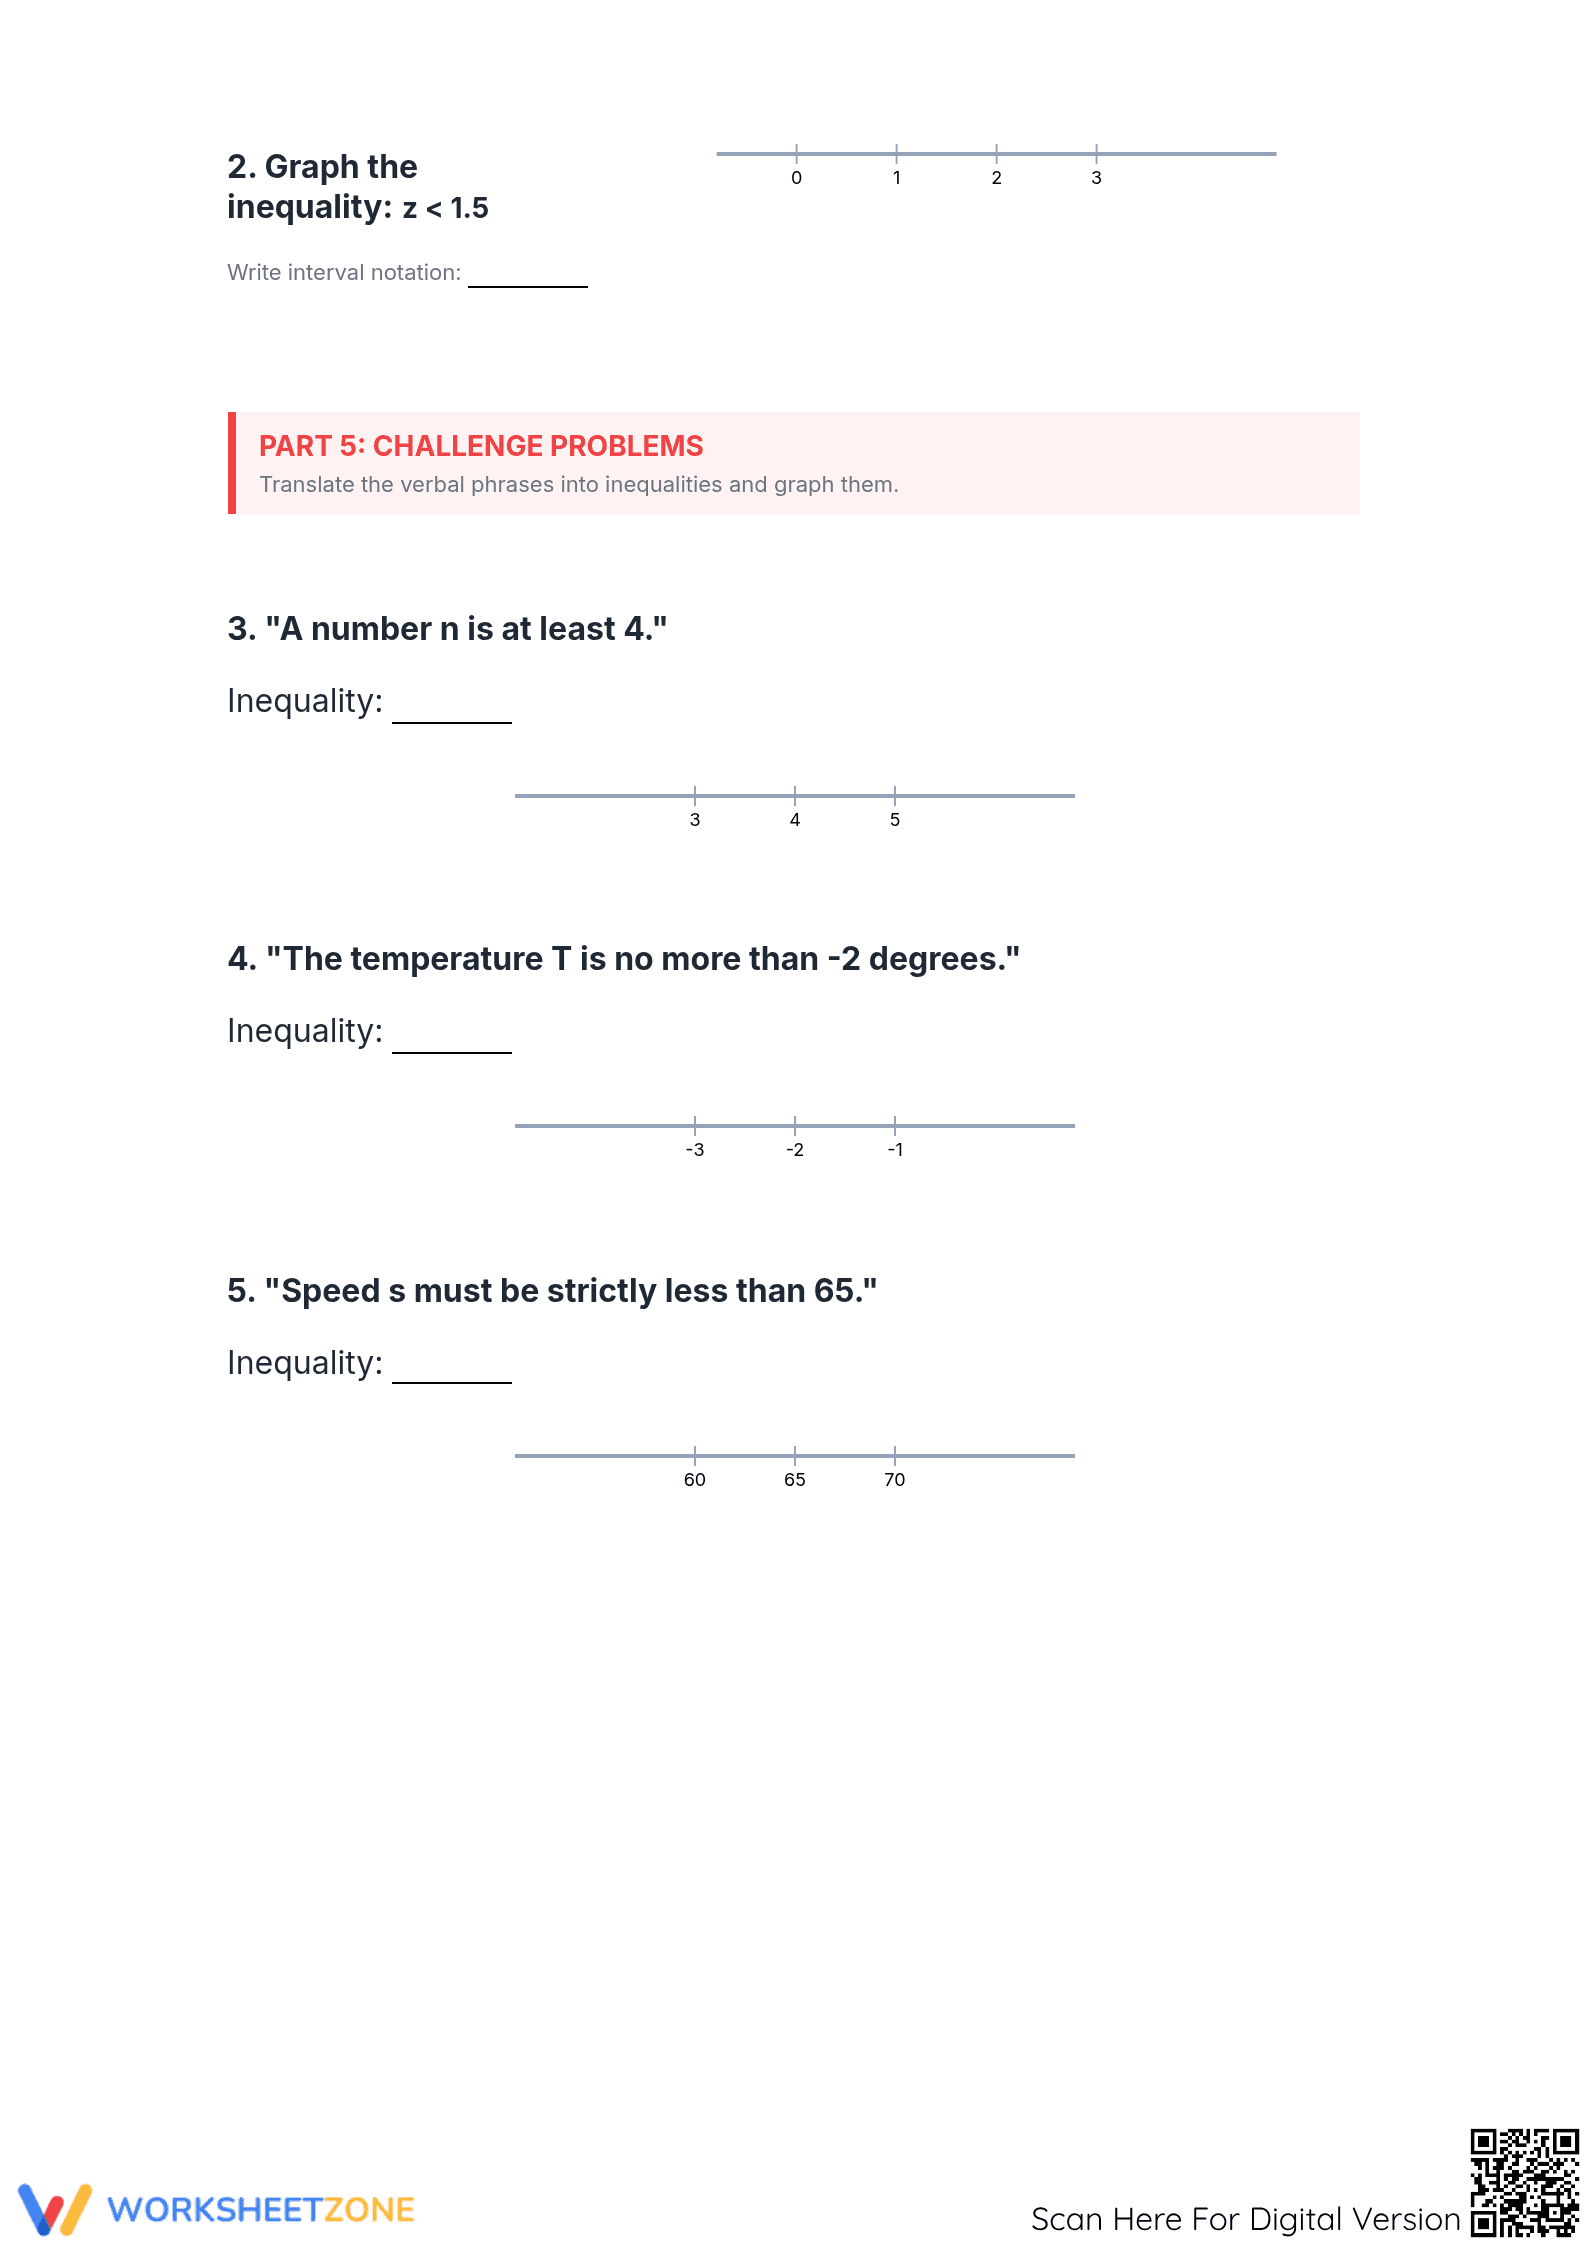
This 3-page PDF contains a page of clear, scaffolded notes on graphing inequalities with worked examples for open versus closed circles. The second page features 12 practice problems split between guided practice and an independent quiz. A complete answer key is on the final page for efficient review.
Zero-Prep Workflow
Designed for classroom efficiency, this resource requires minimal prep.
- Print (1 min): The resource is a 3-page PDF with notes, practice, and an answer key.
- Distribute (2 min): Provide students the first two pages for direct instruction or as a self-guided reference.
- Review (5-10 min): Use the answer key to facilitate whole-class review or for quick grading.
With a prep time of under 5 minutes, this worksheet is ideal for homework or a substitute teacher plan.
Standards Alignment
This worksheet aligns with CCSS.MATH.CONTENT.HSA.REI.B.3, requiring students to represent inequality solutions on a number line. It also supports foundational skills for HSA-CED.A.1. Both standard codes can be copied into lesson plans, IEP goals, or curriculum maps for documentation.
How to Use It
These notes and problems are flexible. Use them to introduce graphing inequalities during direct instruction, allowing students to complete the notes and then work on the 12 practice problems independently. As a formative check, observe students on the 'Show What You Know' section, noting their use of open/closed circles. The activity takes about 25-40 minutes.
Who It's For
This resource is for Algebra 1 or pre-algebra students (Grades 8-10) learning to graph inequalities. The clear examples make it accessible for all learners. For added support, pair this worksheet with an anchor chart that displays the inequality symbols and their corresponding graph components (open/closed circle, direction).
This worksheet provides practice for representing solutions to single-variable inequalities, a key skill under CCSS.MATH.CONTENT.HSA.REI.B.3. Translating an algebraic solution to a visual model on a number line is crucial for conceptual understanding. Research emphasizes connecting symbolic representations with visual models to strengthen comprehension, a principle this worksheet follows (RAND AIRS 2024). This resource offers 12 targeted exercises to build procedural fluency in graphing, ensuring students can accurately model solution sets for inequalities—a skill essential for advanced functions. The structured format supports a gradual release of responsibility from guided examples to independent application.